Coin & market cap tableThis table was built specifically for the Crypto market.
It gives you a quick overview of the markets without having to scroll through numerous charts. The information is the overall markets daily change and the charts coins movement on a daily, weekly and monthly basis.
The weeks start on a Monday morning, the months start on the 1st of the month so this is last weeks data and last calendar months data.
It also gives you Bitcoins dominance. (Total2) you can change it to Bitcoin & Ethereum dominance (Total3)
Statistics

Estimated Time At Price [Kioseff Trading]Hello!
This script uses the same formula as the recently released "Volume Delta" script to ascertain lower timeframe values.
Instead, this script looks to estimate the approximate time spent at price blocks; all time estimates are in minute.second format.
The image above shows functionality. Time spent at price levels/blocks are estimated in duration. The highest estimated block is the highlighted level and a POC line is extended right until violated. Colors, the presence of POC lines and whether they're removed subsequent violation are all configurable.
As show in the image above, the data is displayable in an additional format. When select the "non-classic" format shown above - precise price levels are calculated and the estimated time spent at those levels is summed and displayed right of the current bar. The off-colored level (yellow in the example) denotes the price level encompassing the highest *estimated* time spent.
You can deselect the neon effect and choose to have the script recalculate after any conceivable amount of time has passed.
The script can also calculate for the most current bar should you configure it to do so.
That's all! (for now). A quick/easy script building off an existing foundation.
If you've any ideas for features and ways to "spice up" this script please let me know (: I'll gladly incorporate requests.
Thank you!

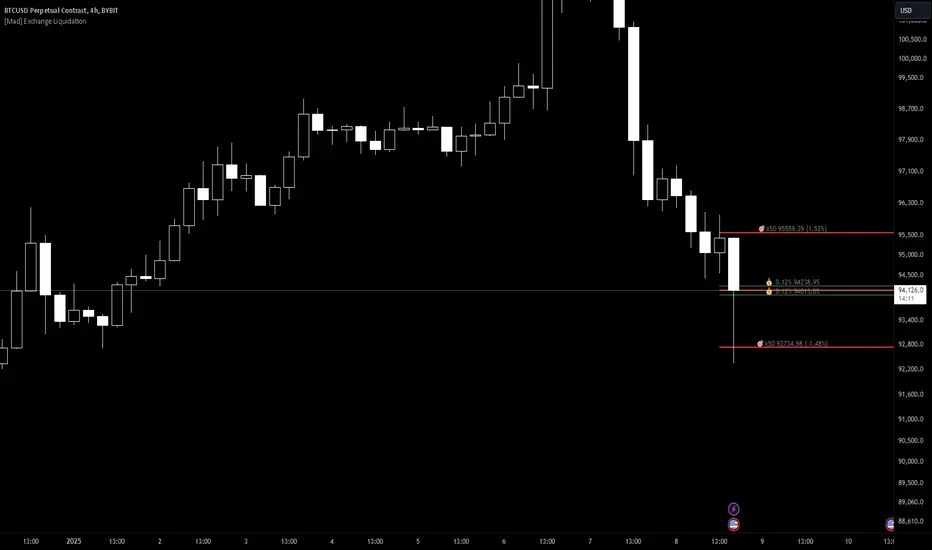
[Mad] Exchange liquidationThis is just a basic tool to calculate liquidation based on:
margin-maintenance
leverage
it starts drawing on your input point short and long liquidation, so you can easily place it on your trade and drag it around if you are rebuying as an example.
Also, you can use it to aim for a specific support/resistance to see if it is even possible to reach some levels, which leverage you can use...
It additionally delivers live data based on the actual close to the 2 liquidation points
have fun
RODO Fair Value IndicatorThe indicator calculates the collateral weight across all pools and gives you the average arbitrage value in real time. Fair value is a green line when the price is undervalued and a red line when the price is overvalued.
We do not yet have TradingView data for the RODOUNI, RODOLINK, RODOHEX and RODOBNB pools - the used data is simulated for this pairs.
I will publish the indicator when we have correct data for all pools. Until then, you can keep an eye on it to know how your investment is moving and what the current fair price is between the pools
If you only use it to monitor your position, just enter your average price and number of tokens
If you also use it for arbitrage, you can enter what amount in USD you do arbitrage transactions with on average in the "Trade Value" field and the indicator will automatically calculate
how much money you can make with such a trade (without considering the transaction price).
Accordingly, the pair that is undervalued and the pair that is overvalued are lit in green
Arbitrage means - we buy the undervalued market and sell the overvalued one. With two transactions, we realize a guaranteed profit. Profits are tiny, but it's a safe trade

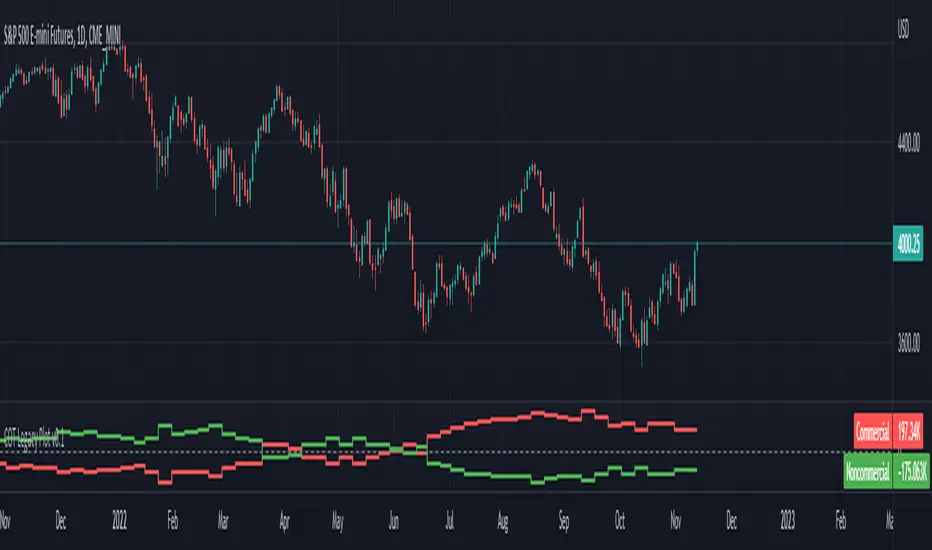
ILM CFTC COT Legacy PlotUse this indicator on Daily Timeframe
Please refer to the below link for CFTC Disaggregated COT
www.cftc.gov
This script is very similar to COT Financial Plot indicator except that it plots the data for Futures in Legacy buckets Commercial vs. Non-Commercial
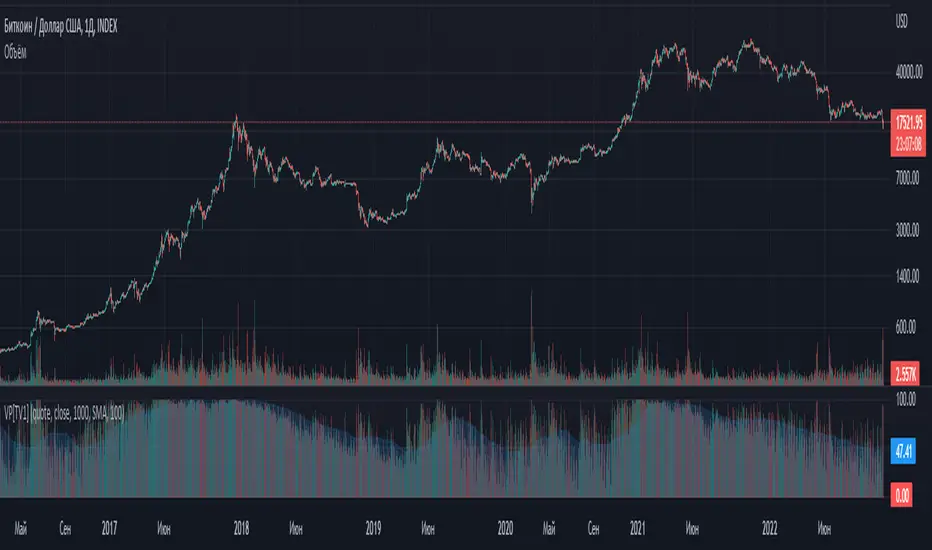
Volume percentrank[TV1]Volume percentrank
Volume normalized by percentile.
The indicator calculates the percentile of the trading volume . The volume in the base asset or quote asset can be selected as data. To calculate the volume of a quoted asset, the closing price or another standard method for calculating the price of a bar can be used.
A feature of percentile calculation with a small data sample length is low accuracy. Despite the fact that the script allows you to calculate a percentile with a length of 1, using a percentile length less than 100 is not recommended.
The percentile calculation method does not allow correctly calculating the percentile at the beginning of the chart due to the lack of all data in the selection, therefore, when the date of the first bar changes (this happens on small timeframes if the TradingView subscription does not allow you to see all historical data), the indicator will be repainted up to the bar number equal to the percentile sample length.
Huge values of the percentile length may cause a script error. If the indicator doesn't work, just make the percentile length smaller.
Объем, нормализованный по процентилью.
Индикатор вычисляет процентиль объема торгов. В качестве данных может быть выбран объем в базовом(base) активе или котировочном(quote) активе. Для расчета объема в котировочном активе может использоваться цена закрытия либо другой стандартный метод расчета цены бара.
Особенностью расчета процентиля при малой длине выборки данных является малая точность. Не смотря на то, что скрипт позволяет вычиcлить процентиль с длинной 1, использовать длину процентиля меньше 100 не рекомендуется.
Метод расчета процентиля не позволяет корректно рассчитать процентиль в начале графика из-за отсутствия всех данных в выборке, поэтому при изменении даты первого бара (это происходит на малых таймфреймах, если подписка TradingView не позволяет видеть все исторические данные) индикатор подвержен перерисовке вплоть до номера бара равного длине выборки процентиля.
Большие значения длины процентиля могут приводить к ошибке скрипта. Если индикатор не работает, просто сделайте длину процентиля меньше.
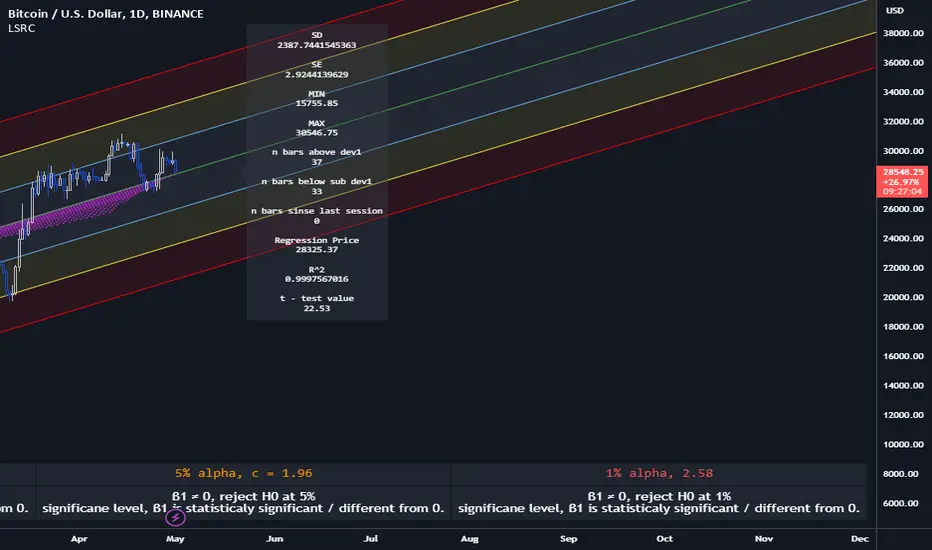
Lagging Session Regression ChannelHello Traders !
Note :
This is my very first published script on trading view & from brainstorming an idea to developing to the finched product it was imperative to me for the indiactor and every one of its features to be of some meaningfull use. If you like the idea of statsitics being able to predict future prices in the market then this indicator may be usefull in your trading arsenal.
Introduction :
Lagging Session Regression Channel (LSRC) is a statistical trend analysis indicator that "laggs" the market by the user defined session, by defualt a day, by doing so the indicator leverges the ability of simple linear regression to predict future asset price.(This can be used on any asset in any market in any time frame)
Options & inputs :
- Bar regression lookback :
The value of bars back from the lats session change, if the seesion time is equivelnt to the the chart timefrmae then the regression line will not lag price, i.e it will act as a stantdard lineer regression channel chnaging on evrey last confimred bar.
- Standard Deviation lookback :
The value of bars from the last session change to cacluate the unbiased standard deviation, The lookback can be set to > or < the regression lookback to cauture > or < less asset volatility. (note this is the same as the residual standard deviation)
- Predicted price at nth bar :
if you whant to know the predicted close price value at any given point in the regression and to the RHS of the regression.
- Regression Line colors group :
Changes the colors of each plotted line.
- OLS Line color : is only changeable when trend color is set to false / unticked.
- Visable deviations group :
Plots the lines that you want on chart, e.g if "Show DEV1" and "Sow DEV SUB1" are the only inputs ticked then they will be the only lines ploted along with the simple linear regression line.
- Regression Line Dynamics group :
All inputs in this group change the regressions calculations given the bar lookback is constant / the same.
- Trend color : if set too true, when the close of the proceding real time bar is greater than the simple linear regression line from the last confimred session the line will be colored green, if otherwise the close is below the simple linear regression line the line will be colored red.
- Extend regression line :
This is the same chart image as seen on the publication chart image but with Extend regression line set to true, this allows the trader to test the valdity of the regression and how well it predicts future price, as seen on the M15 chart of BTCUSD above the indicator was pritty good at doing this.
- Standard deviation channel source :
Source for standard deviation to be calculated on. note if this is set to a varible other than the close then this will no longer be the resdiaul standard deviation, as of now "LSRC 1.0" the regression uses only the close for y / predicted values.
- Time elasped unitl next regression calculation :
The session time until the next LSRC will be calculated and plotted
Label LSRC stats :
- STAN DEV : the standard deviation used to cacluateed the deviation channels
- MIN : The lowest price across the regression
- MAX : The highest price across the regression
- n bars above dev 1 : The number of bars that closed above the first standard deviation channel across the entire regression calculation
- n bars below sub dev1 : The number of bars that closed below the first standard deviation channel.
- Regression Price : The output of "Predicted price at nth bar" input.
Hope you find this usefull !
I will continue too try improve this script and update it accordingly.
ILM CFTC COT Disaggregated PlotUse this indicator on Daily Timeframe
Please refer to the below link for CFTC Disaggregated COT
www.cftc.gov
This script is very similar to COT Financial Plot indicator except that it plots the data for Disaggregated Futures

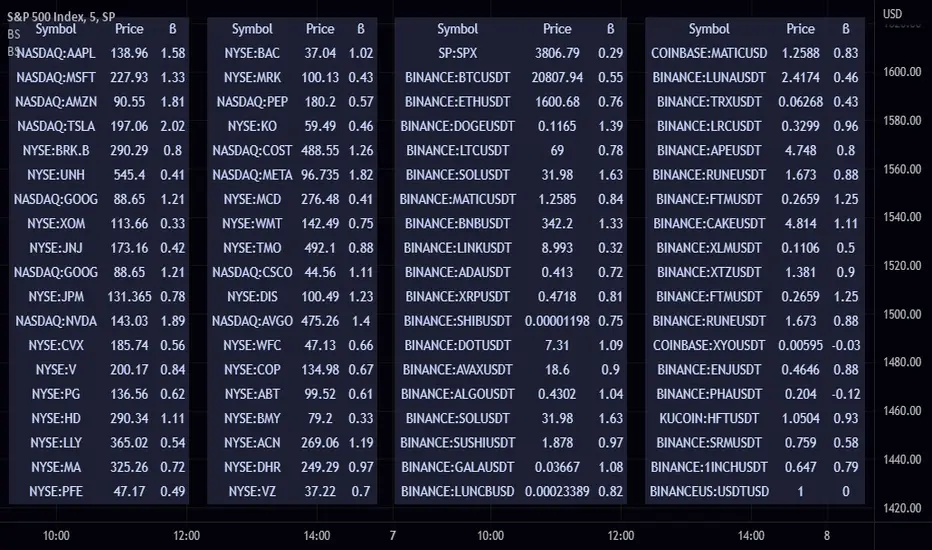
Beta ScreenerThis script allows you to screen up to 38 symbols for their beta. It also allows you to compare the list to not only SPY but also CRYPTO10! Features include custom time frame and custom colors.
Here is a refresher on what beta is:
Beta (β) is a measure of the volatility—or systematic risk—of a security or portfolio compared to the market as a whole (usually the S&P 500 ). Stocks with betas higher than 1.0 can be interpreted as more volatile than the S&P 500 .
Beta is used in the capital asset pricing model (CAPM), which describes the relationship between systematic risk and expected return for assets (usually stocks). CAPM is widely used as a method for pricing risky securities and for generating estimates of the expected returns of assets, considering both the risk of those assets and the cost of capital.
How Beta Works
A beta coefficient can measure the volatility of an individual stock compared to the systematic risk of the entire market. In statistical terms, beta represents the slope of the line through a regression of data points. In finance, each of these data points represents an individual stock's returns against those of the market as a whole.
Beta effectively describes the activity of a security's returns as it responds to swings in the market. A security's beta is calculated by dividing the product of the covariance of the security's returns and the market's returns by the variance of the market's returns over a specified period.
cov (a,b)/var(b)
GDP BreakdownProvides an easy way for viewing the sub sections that make up a country's total GDP. Not all countries provide data for each subsector (Agriculture, Construction, Manufacturing, Mining, Public Administration, Services, Utilities). Only countries that provide complete data are able to be selected in the settings. If I've missed any please let me know in the comment section so they can be added. This is much easier than having to individually selecting each ticker for each country when looking to compare how diversified an economy is.

Sw1tchFX - Average Daily RangeDESCRIPTION AND OVERVIEW
The Average Daily Range is a measure of volatility (typically across 5 days for the FX markets). I originally saw this being used in a trading system called ANTSSYS by Daryll Guppy and some other developers. I couldn't find it anywhere so I decided to build it from scratch.
What this does is allow you to measure volatility across various FX assets (I will apply other asset classes in the future that this is applicable to i.e. Crypto, Commodities, Blue Chip Stocks), and set realistic targets based off that volatility. Overall, this makes much more sense to me in the FX markets rather than support and resistance lines because it's based off the actual movement of the asset class. Market research shows that an asset class has a 80-85% chance to reach 75% of it's Average Daily Range (ADR).
Let's take a look at the daily ADR on the GBPNZD 15m chart. Notice how the values of the ADR act as real support and resistance based off the volatility of the asset. In this case, price did not quite reach the 75% ADR target.
Let's take a look at another example on EURNZD 15m chart. In this case, price hit the 75% target.
It's important to note that these levels do not bound the price. The probability that price exceeds it's 75% ADR is fairly low, but not impossible. Especially during important news events. Let's look at the recent USDCHF 15m chart for example.
Additionally, you can use these values to measure longer term movements (Weekly, and Monthly)
Here is a weekly view:
And a monthly view:
HOW I USE THIS
I use this in conjunction with some other indicators I've developed. Typically, I use range bars since I only care about price, not time. Additionally, averages are smoother when time is not taken into account and only price.
HOW THE CANDLE OPEN AND CLOSE IS CALCULATED
This is done based off of your own specific time zone and from the daily candle. So for me on PST, the daily candle will close at 1400. Once closed, a new ADR value is automatically calculated and added to the chart. There is an option to show past ADR values if you would like to see them or conduct additional research.

Opening Range with Infinite Price TargetsOpening Range with Infinite Price Targets is an ORB indicator that automatically generates price targets into infinity based on a user-defined % of range.
This indicator includes many nice-to-have features missing from other indicators. Such as:
Price Target Labels with Price tooltip, want to know exactly what price pt3 is at? Hover over it and see.
Custom Defined Range time, Set your Range Start and end time to whatever you need, Doesn't have to be pinned to opening range!. Note: Time is in chart time.
Historical View (Default off), Tired of your chart looking messy with a ton of lines from historical data? No problem! You can choose to view or not view historical data.
Alerts for Range Breaks, First Range Breaks, and Discovery Price Target hits. As well as Exported Values for Range High, Low, and Mean to set your own alerts from custom sources.
Custom Price Targets, set your price targets to a % of the range based on your own strategy.
Last but not Least, Infinitely Generating Price Targets. They just keep building. New Targets will be generated when the price closes above/below the current farthest target.
Enjoy!

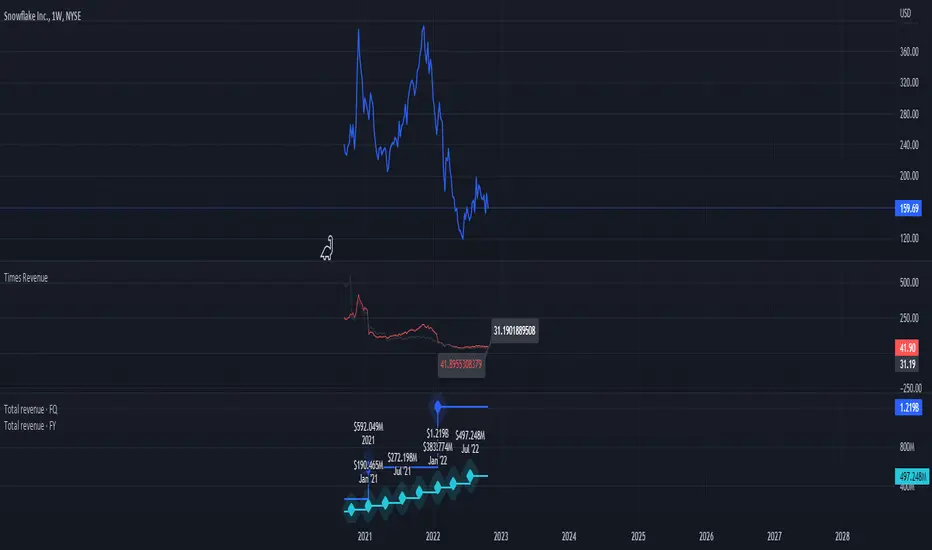
Times-Revenue (Fundamental Metric)Times-revenue is calculated by dividing the selling price of a company by the prior 12 months revenue of the company. The result indicates how many times of annual income a buyer was willing to pay for a company.
In color Red: it shows the last annual metric calculated
In color Gray: it shows the last 4 quarters annualized results
Quantitative Backtesting Panel + ROI Table - ShortsThis script is an aggregate of a backtesting panel with quantitative metrics, ROI table and open ROI reader. It also contains a mechanism for having a fixed percentage stop loss, similar to native TV backtester. For shorts only.
Backtesting Panel:
- Certain metrics are color coded, with green being good performance, orange being neutral, red being undesirable.
• ROI : return with the system, in %
• ROI(COMP=1): return if money is compounded at a rate of 100%
• Hit rate: accuracy of the system, as a %
• Profit factor: gross profit/gross loss
• Maximum drawdown: the maximum value from a peak to a successive trough of the system's equity curve
• MAE: Maximum Adverse Excursion. The biggest loss of a trade suffered while the position is still open
• Total trades: total number of closed trades
• Max gain/max loss: shows the biggest win over the biggest loss suffered
• Sharpe ratio: measures the performance of the system with adjusted risk (no comparison to risk-free asset)
• CAGR: Compound Annual Growth Rate. The mean annual rate of growth of the system of n years (provided n>1)
• Kurtosis: measures how heavily the tails of the distribution differ from that of a normal distribution (symmetric on both sides of mean where mean=0, standard deviation=1). A normal distribution has a kurtosis of 3, and skewness of 0. The kurtosis indicates whether or not the tails of the returns contain extreme values
• Skewness: measures the symmetry of the distribution of returns
- Leptokurtic: K > 0. Having more kurtosis than a normal distribution. It's stretched up and to the side too (2nd pic down). High kurtosis (leptokurtic) is bad as the wider tails (called heavy tails) suggest there is relatively high probability of extreme events
- Mesokurtic: K =0. Having the same kurtosis as a normal distribution
- Platykurtic: K < 0. Having less kurtosis than a normal distribution. This suggests there are light tails and fewer extreme events in the distribution
- Skewness is good: +/- 0.5 (fairly symmetrical)
- Skewness is average: -1 to -0.5 or 0.5 to 1 (moderately skewed)
- Skewness is bad: > +/- 1 (highly skewed)
Evolving ROI table:
- The table of ROI values evolve with the year and month. The sum of each year is given. Please avoid using it on non-cryptocurrencies or any market whose trading session is not 24/7
Open ROI reader:
- At the top center is the open ROI of a trade

[ENT] IndicatorsИндикатор показывает:
Открытие и закрытие торговых сессий (KillZones) - Азия, Лондон, Нью-Йорк
Открытие дня
Хай и Лой предыдущего дня
Разделение дней недели и их отображение.
Используйте на здоровье)

Quantitative Backtesting Panel + ROI Table - LongsThis script is an aggregate of a backtesting panel with quantitative metrics, ROI table and open ROI reader. It also contains a mechanism for having a fixed percentage stop loss, similar to native TV backtester. For longs only.
Backtesting Panel:
- Certain metrics are color coded, with green being good performance, orange being neutral, red being undesirable.
• ROI : return with the system, in %
• ROI(COMP=1): return if money is compounded at a rate of 100%
• Hit rate: accuracy of the system, as a %
• Profit factor: gross profit/gross loss
• Maximum drawdown: the maximum value from a peak to a successive trough of the system's equity curve
• MAE: Maximum Adverse Excursion. The biggest loss of a trade suffered while the position is still open
• Total trades: total number of closed trades
• Max gain/max loss: shows the biggest win over the biggest loss suffered
• Sharpe ratio: measures the performance of the system with adjusted risk (no comparison to risk-free asset)
• CAGR: Compound Annual Growth Rate. The mean annual rate of growth of the system of n years (provided n>1)
• Kurtosis: measures how heavily the tails of the distribution differ from that of a normal distribution (symmetric on both sides of mean where mean=0, standard deviation=1). A normal distribution has a kurtosis of 3, and skewness of 0. The kurtosis indicates whether or not the tails of the returns contain extreme values
• Skewness: measures the symmetry of the distribution of returns
- Leptokurtic: K > 0. Having more kurtosis than a normal distribution. It's stretched up and to the side too (2nd pic down). High kurtosis (leptokurtic) is bad as the wider tails (called heavy tails) suggest there is relatively high probability of extreme events
- Mesokurtic: K =0. Having the same kurtosis as a normal distribution
- Platykurtic: K < 0. Having less kurtosis than a normal distribution. This suggests there are light tails and fewer extreme events in the distribution
- Skewness is good: +/- 0.5 (fairly symmetrical)
- Skewness is average: -1 to -0.5 or 0.5 to 1 (moderately skewed)
- Skewness is bad: > +/- 1 (highly skewed)
Evolving ROI table:
- The table of ROI values evolve with the year and month. The sum of each year is given. Please avoid using it on non-cryptocurrencies or any market whose trading session is not 24/7
Open ROI reader:
- At the top center is the open ROI of a trade
