MACD Triple divergence signalsThis script is a basic combination of several scripts that I found very useful. It's a MACD divergence on steroids. Instead of using only one plot as a source for detecting divergence, I use all of the plots.
The idea is that if more divergence signals appear—especially after a prolonged downtrend or uptrend—they can be interpreted as a strong divergence signal.
The third divergence signal is taken from the MACD signal line. It has a longer-term lookback range, which could provide a more reliable divergence signal.
The default minimum lookback range is 15, much greater than the usual value of 5. This makes it more suitable for long-term trading or for lower timeframes (lower than 4H) to reduce noise from excessive signals. For timeframes higher than 4H, the setting can be reduced to around 10 or even 5.
For the 1W (weekly) timeframe, try using a value of 3.
I also added a band to give a clear visual of overbought and oversold areas. It works similarly to Bollinger Bands (BB). You can spot when the price is ranging or when a stop-loss hunt occurs (i.e., the price breaks the band).
Please do your homework—backtest it yourself to find which timeframe suits you best. You can also tweak the settings if you find the default values too aggressive or too mild.
I’ve found that MACD is more reliable on timeframes greater than 1H. Personally, I use it on the 4H and 1D timeframes.
in bahasa:
MACD dengan 3 sinyal divergence, kalau muncul lebih banyak, bisa jadi sinyal lebih menyakinkan.
Minimum lookback range default-nya 15 agar tidak muncul terlalu banyak sinyal. 15 lebih panjang, lebih ok. Kalau main di higher timeframe seperti 1D, bisa 5-10, kalau weeky timeframe = 3.
Untuk band, cek ketika plot-nya keluar dari band, itu bisa jadi jackpot, apalagi kalau plot-nya membentuk double bottom.
Backtest sendiri, siapa tahu kalian bisa dapet setting sendiri.
MACD with upper and lower band will give you a clear visual of price movements
More divergence signals are generated and when the price breaks out of the oversold band = jackpot.
Volatility


TrendBoxThis indicator is called "TrendBox," designed to help traders analyze daily price ranges using several technical indicators. Below is a breakdown of its functionality, purpose, and key components:
Purpose
The script overlays indicators on a chart to assess whether the price is above or below key levels and moving in a trend.
VIX-based expected range (index fund targeted)
- This helps calculate the expected dealers range based on VIX implications. You can expect to see ranges be bought on and sold on. Moving outside this range creates heightened volatility and most of the time a gamma squeeze follows.
VWAP (Volume Weighted Average Price)
- This allows you to understand the mid point or average pricing of the daily session. If you're paying a premium or getting a discount on the daily session.
Daily Market Open
- Identifying the market open price is a key level on a daily session and allows you to identify some level of intraday trend.
Daily 4-period VWMA
- This is a crucial role of our indicator and showing short term time frame bias. Seeing price move over the top of our daily 4 level establishes a short term trend and can be used as a distribution guide, closing positions when we see longer time frame candles close under it. Vice versa for shorting.
It also displays a status box (optional) summarizing whether the price is above or below these levels, helping traders quickly evaluate market conditions.

Pro Scalping Strategy [1Min | No Repaint | High Precision]Pro Scalping Strategy
Dual-Mode Precision Scalping System | EMA Trend + RSI + ATR | Non-Repainting
🔍 Overview
This indicator is a precision-engineered scalping tool optimized for lower timeframes (1–5 min), offering stable Buy/Sell signals without repainting.
Built on a robust trend-following framework, this system gives you the choice of two operating modes:
🔒 High Accuracy: Strict filters, fewer but stronger signals
⚡ More Signals: Looser filters, more frequent entries
🧠 How It Works
The logic is based on a multi-filter engine applied on closed candles only, ensuring non-repainting, clean, and confirmed entries.
⚙️ Technical Filters Used
1. EMA Trend Stack
Defines market trend using 3 EMAs (9, 21, 50)
Buy: EMA9 > EMA21 > EMA50
Sell: EMA9 < EMA21 < EMA50
2. EMA Crossover Filter
A confirmed crossover or crossunder is required from 2 candles back
Ensures trend momentum is validated before signal appears
3. EMA Slope Filter
Only accepts signals if mid EMA (EMA21) is sloping in trend direction
4. RSI Filter
Filters out signals when RSI is too extreme
RSI < overbought for Buy / RSI > oversold for Sell
5. ATR Filter
Confirms market has enough volatility
ATR must exceed a minimum threshold
✅ Modes Comparison
Feature High Accuracy Mode More Signals Mode
Min EMA Gap 0.1 0.05
Min ATR 0.2 0.1
RSI Range 30–70 25–75
Entry Frequency Lower Higher
Signal Quality Tighter + Stronger Looser + Flexible
🔔 Features
🔁 No repaint logic
⚙️ Adjustable settings with simple mode switch
⚡ Real-time alerts via alertcondition()
✅ Visual confirmation with BUY/SELL labels
💹 Suitable for scalping crypto, forex, gold, indices, and more
📌 Author: ALIP FX
“Success Elevated, Trade Smarter.”

Volatility Strategy 01a quantitative volatility strategy (especially effective in trend direction on the 15min chart on the s&p-index)
the strategy is a rule-based setup, which dynamically adapts to the implied volatility structure (vx1!–vx2!)
context-dependent mean reversion strategy based on multiple timeframes in the vix index
a signal is provided under following conditions:
1. the vvix/vix spread has deviated significantly beyond one standard deviation
2. the vix is positioned above or below 3 moving averages on 3 minor timeframes
3. the trade direction is derived from the projected volatility regime, measured via vx1! and vx2! (cboe)

EMA/ATR/RSIThis indicator overlays three key technical measures—Exponential Moving Average (EMA), Average True Range (ATR), and a custom-scaled Relative Strength Index (RSI)—on your price chart, all using the same lookback period.
Features
• EMA (Exponential Moving Average): Smooths price action to highlight trend direction.
• ATR (Average True Range): Measures market volatility via an RMA-smoothed True Range.
• RSI (Modified): Scales the standard RSI by subtracting 35 and multiplying by 2, shifting the baseline for clearer momentum signals.
Inputs
• period (integer): Lookback length for EMA, ATR, and RSI calculations (default: 14).
How to Use
1. Adjust period to suit your preferred timeframe (e.g., 14 for daily charts, 7 for intraday).
2. Use the EMA line to identify trend direction and dynamic support/resistance.
3. Monitor ATR to gauge changing volatility—wider bands signal stronger moves.
4. Watch the modified RSI crossovers around zero:
• Above 0: Bullish momentum
• Below 0: Bearish momentum
Combine these three overlays to refine entries, exits, and stop-loss placement based on trend strength, volatility, and momentum all in one view.

RAHA - Roni's Adjusted Hybrid AverageRoni's Hybrid Moving Average Oscillator
Each value in the series is weighted inversely to its distance from the mean, meaning that outliers have less impact.
The indicator reduces distortions caused by extreme movements.
More suitable for cases such as volatile stocks.
מתנד הממוצע ההיברידי של רוני
כל ערך בסדרה מקבל משקל הפוך למרחקו מהממוצע כלומר חריגים משפיעים פחות.
האינדיקטור מצמצם עיוותים שנגרמים על ידי תנועות קיצוניות.
מתאים יותר למקרים כמו מניות תנודתיות.

Close vs 50SMA % (Bars colored by 20SMA)This indicator plots the percentage difference between the Close price and the 50-period Simple Moving Average (SMA50), and colors each bar based on whether the Close is above or below the 20-period SMA (SMA20).


Z-Score + Momentum Strategy (Filtered)✅ What the script does:
Calculates the Z-Score of price with EMA smoothing.
Calculates Momentum as the difference between the current price and the price n bars ago.
Generates signals:
Buy: When the Z-Score is rising and relatively positive, and momentum is increasing.
Sell: When the Z-Score is falling, and momentum is decreasing.
Plots BUY and SELL labels on the candles.
Provides alerts that can be activated from the TradingView settings.
Displays Z-Score and Momentum in the lower pane of the chart.
🎯 How to use the script:
Copy the code into the Pine Editor on TradingView.
Click "Add to Chart".
Enable alerts using the alertcondition settings.
You can modify the following parameters:
Z-Score period: length
Momentum lookback period: momentumLength
Z-Score entry threshold: threshold

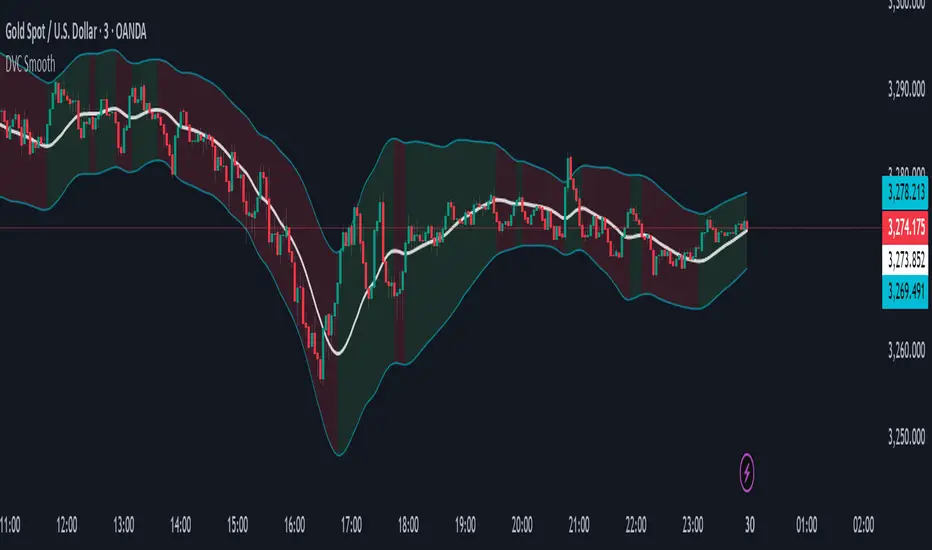
Dynamic Volatility Channel (DVC) - Smooth
The indicator's adaptability comes from a unique blend of well-known concepts:
The Adaptive Engine (ADX): The indicator uses the Average Directional Index (ADX) in the background to analyze the strength of the trend. This acts as the "brain", telling the channel whether the market is trending strongly or moving sideways.
Hybrid Volatility: This is the core of the indicator. The width of the channel is determined by a weighted mix of two volatility measures:
In trending markets (high ADX), the channel gives more weight to the Average True Range (ATR).
In ranging markets (low ADX), the channel gives more weight to Standard Deviation.
Smooth Centerline (HMA): The channel is centered around a Hull Moving Average (HMA), which is known for its smoothness and reduced lag compared to other moving averages.
Advanced Smoothing Layers: This version includes dedicated smoothing for both the volatility components (ATR and StDev) and the logic that switches between regimes. This ensures the channel expands, contracts, and adapts in a very fluid manner, eliminating sudden jumps and reducing market noise.
Mean Reversion: In ranging markets (indicated by a flatter channel), the outer bands can act as dynamic support and resistance levels. Look for opportunities to sell near the upper band and buy near the lower band, always waiting for price action confirmation like reversal candles.
Trend Following: In strong trends (indicated by a steeply sloped channel), the centerline (HMA) often serves as a dynamic level of support (in an uptrend) or resistance (in a downtrend). Pullbacks to the centerline can present opportunities to join the trend. A "band ride," where price action consistently pushes against the upper or lower band, signals a very strong trend.
Volatility Analysis: A "squeeze," where the bands come very close together, indicates low volatility and can foreshadow a significant price breakout. A sudden expansion of the bands signals an increase in volatility and the potential start of a new, powerful move.
All core parameters are fully customizable to suit your trading style and preferred assets:
You can adjust the lengths for the HMA, ATR, StDev, and the ADX filter.
You can change the multipliers for the ATR and Standard Deviation components.
Crucially, you can control the Volatility Smoothing Length and Logic Smoothing Length to find the perfect balance between responsiveness and smoothness.
Disclaimer: This indicator is provided for educational and analytical purposes only. It is not financial advice, and past performance is not indicative of future results. Always conduct your own research and backtesting before risking capital in a live market.
Volatility & Momentum Nexus (VMN)Volatility & Momentum Nexus (VMN)
This indicator was designed to solve a common trader's problem: chart clutter from dozens of indicators that often contradict each other. The Volatility & Momentum Nexus ( VMN ) is not just another indicator; it's a complete analysis system that synthesizes four essential market pillars into a single, clean, and intuitive visual signal.
The goal of VMN is to identify high-probability moments where a period of accumulation (low volatility) is about to erupt into an explosive move, confirmed by trend, momentum, and volume.
VMN analyzes the real-time confluence of four critical elements:
The Trend (The Main Filter): A 100-period Exponential Moving Average (EMA) sets the overall context. The indicator will only look for buy signals above this line (in an uptrend) and sell signals below it (in a downtrend). The line's color changes for quick visualization.
Volatility (Energy Accumulation): Using Bollinger Bands Width (BBW), the indicator identifies "Squeeze" periods—when the price contracts and builds up energy. These zones are marked with a yellow background on the chart, signaling that a major move is imminent.
Momentum (The Trigger): An RSI (Relative Strength Index) acts as the trigger. A signal is only validated if momentum confirms the direction of the breakout (e.g., RSI > 55 for a buy), ensuring we enter the market with force.
Volume (The Final Confirmation): No breakout move is credible without volume. VMN checks if the volume at the time of the signal is significantly higher than its recent average, adding a vital layer of confirmation.
Green Arrow (Buy Signal): Appears ONLY when ALL the following conditions are met simultaneously:
Price is above the 100 EMA (Bullish Trend).
The chart is exiting a Squeeze zone (yellow background on the previous bar).
Price breaks above the upper Bollinger Band.
RSI is above the buy threshold (default 55).
Volume is above average.
Red Arrow (Sell Signal): Appears ONLY when all the opposite conditions are met.
Do not treat signals as blind commands to trade. They are high-probability confirmations.
Look for signals near key Support/Resistance levels for an even higher success rate.
Always set a Stop Loss (e.g., below the low of the signal candle or below the lower Bollinger Band for a buy).
All parameters (EMA, RSI, Bollinger Bands lengths, thresholds, etc.) can be customized from the settings menu to adapt the indicator to any financial asset or timeframe.
Disclaimer: This indicator is a tool for educational and analytical purposes. It does not constitute and should not be interpreted as financial advice. Trading involves significant risk. Always perform your own analysis and backtesting before risking real capital.

Future is hereOverview
"Future is Here" is an original, multi-faceted Pine Script indicator designed to provide traders with a comprehensive toolset for identifying high-probability trading opportunities. By integrating volatility-based entry zones, trend-based price targets, momentum confirmation, dynamic support/resistance levels, and risk-reward ratio (RRR) calculations, this indicator offers a cohesive and actionable trading framework. Each feature is carefully designed to complement the others, ensuring a synergistic approach that enhances decision-making across various market conditions. This script is unique in its ability to combine these elements into a single, streamlined interface with clear visual cues and customizable alerts, making it suitable for both novice and experienced traders.
Key Features and How They Work Together
Volatility-Based Entry Zones
Purpose: Identifies overbought and oversold conditions using a volatility-adjusted moving average, helping traders spot potential reversal zones.
Mechanism: Utilizes a user-defined volatility length and multiplier to calculate dynamic overbought/oversold thresholds based on the standard deviation of price. Crossovers and crossunders of these levels trigger "Buy Zone" or "Sell Zone" labels.
Synergy: These zones act as the foundation for entry signals, which are later confirmed by momentum and trend filters to reduce false signals.
Trend-Based Price Targets
Purpose: Projects potential price targets based on the prevailing trend, giving traders clear objectives for profit-taking.
Mechanism: Combines a fast and slow moving average to determine trend direction, then calculates target prices using a multiplier of the price deviation from the slow MA. Labels display bullish or bearish targets when the fast MA crosses the slow MA.
Synergy: Works in tandem with entry zones and momentum signals to align targets with market conditions, ensuring traders aim for realistic price levels supported by trend strength.
Momentum Confirmation
Purpose: Validates entry signals by assessing momentum strength, filtering out weak setups.
Mechanism: Uses the momentum indicator to detect bullish or bearish momentum crossovers, labeling them as "Strong" or "Weak" based on a comparison with a smoothed momentum average.
Synergy: Enhances the reliability of buy/sell signals by ensuring momentum aligns with volatility zones and trend direction, reducing the risk of premature entries.
Dynamic Support/Resistance Levels
Purpose: Highlights key price levels where the market is likely to react, aiding in trade planning and risk management.
Mechanism: Detects pivot highs and lows over a user-defined lookback period, drawing horizontal lines for the most recent support and resistance levels (limited to two each for clarity). Labels mark these levels with price values.
Synergy: Complements entry zones and price targets by providing context for potential reversal or continuation points, helping traders set logical stop-losses or take-profits.
Buy/Sell Signals with Risk-Reward Ratios
Purpose: Generates precise buy/sell signals with integrated take-profit (TP), stop-loss (SL), and RRR calculations for disciplined trading.
Mechanism: Combines volatility zone crossovers, trend confirmation, and positive momentum to trigger signals. ATR-based TP and SL levels are calculated, and the RRR is displayed in labels for quick assessment.
Synergy: This feature ties together all previous components, ensuring signals are only generated when volatility, trend, and momentum align, while providing clear risk-reward metrics for trade evaluation.
Customizable Alerts
Purpose: Enables traders to stay informed of trading opportunities without constant chart monitoring.
Mechanism: Alert conditions are set for buy and sell signals, delivering notifications with the entry price for seamless integration into trading workflows.
Synergy: Enhances usability by allowing traders to act on high-probability setups identified by the indicator’s combined logic.
Originality
"Future is Here" is an original creation that distinguishes itself through its holistic approach to technical analysis. Unlike single-purpose indicators, it integrates volatility, trend, momentum, and support/resistance into a unified system, reducing the need for multiple scripts. The inclusion of RRR calculations directly in signal labels is a unique feature that empowers traders to evaluate trade quality instantly. The script’s design emphasizes clarity and efficiency, with cooldowns to prevent label clutter and a limit on support/resistance lines to maintain chart readability. This combination of features, along with its customizable parameters, makes it a versatile and novel tool for traders seeking a robust, all-in-one solution.
How to Use
Setup: Add the indicator to your TradingView chart and adjust input parameters (e.g., Volatility Length, Trend Length, TP/SL Multipliers) to suit your trading style and timeframe.
Interpretation:
Look for "Buy Zone" or "Sell Zone" labels to identify potential entry points.
Confirm entries with "Bull Mom" or "Bear Mom" labels and trend direction (Bull/Bear Target labels).
Use Support/Resistance lines to set logical TP/SL levels or anticipate reversals.
Evaluate Buy/Sell signals with TP, SL, and RRR for high-probability trades.
Alerts: Set up alerts for Buy/Sell signals to receive real-time notifications.
Customization: Fine-tune multipliers and lengths to adapt the indicator to different markets (e.g., stocks, forex, crypto) or timeframes.

Dow Theory Trend IndicatorIdentifies bullish (Higher Highs/Lows) and bearish (Lower Highs/Lows) trends using Dow Theory principles, with dynamic volume confirmation.
Displays the current trend status ("Bull", "Bear", or "Neutral")

💰 Volume Spike Detector - by TenAMTrader💰 Volume Spike Detector – by TenAMTrader
Overview
This indicator helps you spot potential trading opportunities by identifying volume spikes—a common precursor to strong market moves. When a candle's volume exceeds the average volume of the past sessions by a defined percentage (default 25%), a 💰 emoji will appear beneath the bar on your chart.
How to Use It:
Look for the 💰 money sign plotted below candles—these mark when the current volume is significantly higher than usual.
Use these signals to confirm price action setups, trend reversals, or breakout entries.
Combine with support/resistance or other indicators for higher conviction.
Settings & Customization
Spike Ratio %: The percentage above average volume required to trigger a signal (default: 25%).
Trading Period: The number of past bars used to calculate average volume (default: 21).
Enable Alert: Toggle on/off if you want to be alerted when a spike happens.
How to Set Up Alerts
After adding the script to your chart, click the "Alerts" icon.
Choose the condition: Volume Spike Alert.
Set frequency: Once per bar close or Once per bar.
Save and activate to be notified of incoming volume surges.
⚠️ Disclaimer
This indicator is for educational and informational purposes only. It does not constitute financial advice or a recommendation to buy or sell any security. Always perform your own due diligence and risk management. The creator of this script, TenAMTrader, is not liable for any losses incurred from using this tool.

Step Channel Momentum Trend [ChartPrime]OVERVIEW
Step Channel Momentum Trend is a momentum-based price filtering system that adapts to market structure using pivot levels and ATR volatility. It builds a dynamic channel around a stepwise midline derived from swing highs and lows. The system colors price candles based on whether price remains inside this channel (low momentum) or breaks out (strong directional flow). This allows traders to clearly distinguish ranging conditions from trending ones and take action accordingly.
⯁ STRUCTURAL MIDLNE (STEP CHANNEL CORE)
The midline acts as the backbone of the trend system and is based on structure rather than smoothing.
Calculated as the average of the most recent confirmed Pivot High and Pivot Low.
The result is a step-like horizontal line that only updates when new pivot points are confirmed.
This design avoids lag and makes the line "snap" to recent structural shifts.
It reflects the equilibrium level between recent bullish and bearish control.
snapshot
This unique step logic creates clear regime shifts and prevents noise from distorting trend interpretation.
⯁ DYNAMIC VOLATILITY BANDS (ATR FILTERING)
To detect momentum strength, the script constructs upper and lower bands using the ATR (Average True Range):
The distance from the midline is determined by ATR × multiplier (default: 200-period ATR × 0.6).
These bands adjust dynamically to volatility, expanding in high-ATR environments and contracting in calm markets.
The area between upper and lower bands represents a neutral or ranging market state.
Breakouts outside the bands are treated as significant momentum shifts.
snapshot
This filtering approach ensures that only meaningful breakouts are visually emphasized — not every candle fluctuation.
⯁ MOMENTUM-BASED CANDLE COLORING
The system visually transforms price candles into momentum indicators:
When price (hl2) is above the upper band, candles are green → bullish momentum.
snapshot
When price is below the lower band, candles are red → bearish momentum.
snapshot
When price is between the bands, candles are orange → low or no momentum (range).
snapshot
The candle body, wick, and border are all colored uniformly for visual clarity.
This gives traders instant feedback on when momentum is expanding or fading — ideal for breakout, pullback, or trend-following strategies.
⯁ PIVOT-BASED SWING ANCHORS
Each confirmed pivot is plotted as a label ⬥ directly on the chart:
snapshot
They also serve as potential manual entry zones, SL/TP anchors, or confirmation points.
⯁ MOMENTUM STATE LABEL
To reinforce the current market mode, a live label is displayed at the most recent candle:
Displays either:
“Momentum Up” when price breaks above the upper band.
snapshot
“Momentum Down” when price breaks below the lower band.
snapshot
“Range” when price remains between the bands.
snapshot
Label color matches the candle color for quick identification.
Automatically updates on each bar close.
This helps discretionary traders filter trades based on market phase.
USAGE
Use the green/red zones to enter with momentum and ride trending moves.
Use the orange zone to stay out or fade ranges.
The step midline can act as a breakout base, pullback anchor, or bias reference.
Combine with other indicators (e.g., order blocks, divergences, or volume) to build high-confluence systems.
CONCLUSION
Step Channel Momentum Trend gives traders a clean, adaptive framework for identifying trend direction, volatility-based breakouts, and ranging environments — all from structural logic and ATR responsiveness. Its stepwise midline provides clarity, while its dynamic color-coded candles make momentum shifts impossible to miss. Whether you’re scalping intraday momentum or managing swing entries, this tool helps you trade with the market’s rhythm — not against it.

Doji Ashi v2.0 (with SL & TP levels)This is a version of @SassyStonks Doji Ashi v2.0 that includes ATR based SL levels with adjustable R:R TP levels.
What is Doji Ashi v2.0?
This indicator is designed for short-term intraday momentum trading, offering Buy and Sell signals based on a refined combination of filters including:
Trend alignment with daily SMAs
Momentum confirmation using EMA 3/8 cross
Relative volume to identify activity spikes
VWAP positioning to confirm trend consistency
Time filters to avoid unreliable early market chop
It adapts dynamically depending on whether you’re trading Stocks or Crypto, with appropriate filters toggled automatically.
...
How the Script Works
Core Logic:
A Buy signal appears when:
The price is in an uptrend (via SMAs)
VWAP and volume confirm momentum
EMA 3 crosses above EMA 8
Relative strength is strong (if enabled)
Market opens past first 30 mins
A Sell signal appears when:
The asset shows weakness across these same filters, in reverse
You’ll see green “BUY” or red “SELL” markers on your chart instantly when the full condition set is met. This script does not repaint.
Entry Logic Options:
Choose between:
"Cross" mode: Signals appear on 3/8 EMA crossover
"Above/Below" mode: Persistent signal while 3 EMA stays above/below 8 EMA
...
Strategy for Consistent Gains
This script works best on liquid stocks such as LUNR, ASTS and PLUG. It also works with Crypto. Make sure you choose the correct indicator setup type (Stocks or Crypto) in the setting before testing.
If you don't see any signals the default settings may be too strict for your chosen stock. Have a play with the settings to find the right balance for you. The default settings follow the strategy below for what I believe are currently the best results.
Alerts for buy/sell signals can be set from the alerts menu. For best results, make sure you set the alert to action on close of bar.
This indicator is most effective when:
Used with liquid stocks or crypto
Entries are confirmed with VWAP, not counter-trend
Signals are filtered by volume spikes and trend direction
Example strategy:
Buy a Call when you see a BUY signal with high volume, in an uptrend
Exit on a cross back to VWAP (the orange line) or a quick 1% profit
Do the opposite with PUTs on a SELL signal
This is ideal for quick day trades (scalps or trend moves), and avoids the choppy, uncertain zones at market open.
...
Optimizing via Settings
There are additional, stricter filters in the settings. Please adapt to your preference.
Presets:
Stocks (Default): Applies all filters but lets you disable them as needed
Crypto: Disables stock-specific filters (SPY comparison, RS, Daily trend)
Filters:
Daily Trend Filter: Helps align trades with higher timeframe direction (recommended ON for stocks)
Market Trend & RS: Filters based on SPY and relative performance (test enabling for SPY-following tickers)
VWAP Entry Filter: Keeps you from fighting the dominant intraday trend
Ignore First 30 Minutes: Avoids false signals at the open
Experiment with toggling filters ON/OFF to match your asset class and volatility conditions.
...
Finally
The best way to master this indicator is to understand the trading mindset it came from.
Read The Damn Wiki — it’s free, comprehensive, and packed with wisdom that this script distills into a usable tool.
If you would like to adapt this indicator you are very welcome to do so. All I ask in return is that you share your findings with the wider community.
...
Happy trading. May your entries be sharp and your exits cleaner.
~ @SassyStonks

Profit Seeker📈 Profit Seeker — Precision Trend Signal Indicator
Profit Seeker is a trend-based multi-condition indicator designed to identify high-probability long and short trade setups by combining the strengths of multiple proven technical tools:
🔍 Core Features:
Heiken Ashi Mode (Optional): Smoothens price action to reduce noise and improve trend clarity.
Stochastic Ribbon Pivots: Detect trend reversals with built-in “HUNT” signals.
Chande Momentum Oscillator (CMO): Confirms weakening or strengthening momentum — labeled as “SIGHT”.
Bollinger Bands (BB): Pinpoint final entry triggers when price breaches volatility extremes — the “FIRE” signal.
Multi-Timeframe Trend Filtering: Trade only in the direction of a dominant higher-timeframe trend.
Color-coded Flags:
🟢 HUNT: Initial trend signal
🟢 SIGHT: Momentum alignment
🟢 FIRE: Volatility-based confirmation
Smart Alerts: Receive real-time long or short alerts when all conditions align.
🛠️ Use Cases:
Ideal for swing and intraday traders
Works on all asset classes: crypto, forex, equities, commodities
Compatible with manual trading or automated bots

[Mad]Triple Bollinger Bands ForecastTriple Bollinger Bands Forecast (BBx3+F)
This open-source indicator is an advanced version of the classic Bollinger Bands, designed to provide a more comprehensive and forward-looking view of market volatility and potential price levels.
It plots three distinct sets of Bollinger Bands and projects them into the future based on statistical calculations.
How It Is Built and Key Features
Triple Bollinger Bands: Instead of a single set of bands, this indicator plots three. All three share the same central basis line (a Simple Moving Average), but each has a different standard deviation multiplier. This creates three distinct volatility zones for analyzing price deviation from its mean.
Multi-Timeframe (MTF) Capability: The indicator can calculate and display Bollinger Bands from a higher timeframe (e.g., showing daily bands on a 4-hour chart). This allows for contextualizing price action within the volatility structure of a more significant trend.
(Lower HTF selection will result in script-crash!)
Future Forecasting: This is the indicator's main feature. It projects the calculated Bollinger Bands up to 8 bars into the future. This forecast is a recalculation of the Simple Moving Average and Standard Deviation based on a projected future source price.
Selectable Forecast Methods: The mathematical model for estimating the future source price can be selected:
Flat: A model that uses the most recent closing price as the price for all future bars in the calculation window.
Linreg (Linear Regression): A model that calculates a linear regression trend on the last few bars and projects it forward to estimate the future source price.
Efficient Drawing with Polylines: The future projections are drawn on the chart using Pine Script's polyline object. This is an efficient method that draws the forecast data only on the last bar, which avoids repainting issues.
Differences from a Classical Bollinger Bands Indicator
Band Count: A classical indicator shows one set of bands. This indicator plots three sets for a multi-layered view of volatility.
Perspective: Classical Bollinger Bands are purely historical. This indicator is both historical and forward-looking .
Forecasting: The classic version has no forecasting capability. This indicator projects the bands into the future .
Timeframe: The classic version works only on the current timeframe. This indicator has full Multi-Timeframe (MTF) support .
The Mathematics Behind the Future Predictions
The core challenge in forecasting Bollinger Bands is that a future band value depends on future prices, which are unknown. This indicator solves this by simulating a future price series. Here is the step-by-step logic:
Forecast the Source Price for the Next Bar
First, the indicator estimates what the price will be on the next bar.
Flat Method: The forecasted price is the current bar's closing price.
Price_forecast = close
Linreg Method: A linear regression is calculated on the last few bars and extrapolated one step forward.
Price_forecast = ta.linreg(close, linreglen, 1)
Calculate the Future SMA (Basis)
To calculate the Simple Moving Average for the next bar, a new data window is simulated. This window includes the new forecasted price and drops the oldest historical price. For a 1-bar forecast, the calculation is:
SMA_future = (Price_forecast + close + close + ... + close ) / length
Calculate the Future Standard Deviation
Similarly, the standard deviation for the next bar is calculated over this same simulated window of prices, using the new SMA_future as its mean.
// 1. Calculate the sum of squared differences from the new mean
d_f = Price_forecast - SMA_future
d_0 = close - SMA_future
// ... and so on for the rest of the window's prices
SumOfSquares = (d_f)^2 + (d_0)^2 + ... + (d_length-2)^2
// 2. Calculate future variance and then the standard deviation
Var_future = SumOfSquares / length
StDev_future = sqrt(Var_future)
Extending the Forecast (2 to 8 Bars)
For forecasts further into the future (e.g., 2 bars), the script uses the same single Price_forecast for all future steps in the calculation. For a 2-bar forecast, the simulated window effectively contains the forecasted price twice, while dropping the two oldest historical prices. This provides a statistically-grounded projection of where the Bollinger Bands are likely to form.
Usage as a Forecast Extension
This indicator's functionality is designed to be modular. It can be used in conjunction with as example Mad Triple Bollinger Bands MTF script to separate the rendering of historical data from the forward-looking forecast.
Configuration for Combined Use:
Add both the Mad Triple Bollinger Bands MTF and this Triple Bollinger Bands Forecast indicator to your chart.
Open the Settings for this indicator (BBx3+F).
In the 'General Settings' tab, disable the Activate Plotting option.
To ensure data consistency, the Bollinger Length, Multipliers, and Higher Timeframe settings should be identical across both indicators.
This configuration prevents the rendering of duplicate historical bands. The Mad Triple Bollinger Bands MTF script will be responsible for visualizing the historical and current bands, while this script will overlay only the forward-projected polyline data.

Momo MasterA combination of moving averages and macd in one indicator.
Shows trend directionality and momentum.
SMA200 and VWAP are additional indicators that help to quickly assess whether we are in an up or down trend

COG GravityBased on the COG concept by veryfid — but shown directly on the chart instead of an oscillator pane.
Long Entry
Price crosses above the COG line, and
Price is above the SMA
COG velocity is rising (momentum is building)
Short Entry
Price crosses below the COG line, and
Price is below the SMA
COG velocity is falling (momentum is weakening)
Feel free to modify the script and let me know ☺️

Annualized Historical VolatilityAnnualized, realized vol calculated as
hv = std_dev(log returns) x sqrt(trading periods)

Breakout Strength Radar🚀 What It Does:
The Breakout Strength Radar tells you:
✅ Trend direction: Bullish / Bearish / Neutral
✅ Trend slope: Rising / Falling / Flat
→ Is the trend gaining strength or fading?
✅ Momentum: Strong Bullish / Strong Bearish / Neutral
→ Is there fuel behind the move?
✅ Volatility condition: Expanding / Contracting / Stable
→ Is the market opening up (breakout likely) or squeezing (consolidation)?
✅ Breakout Watch:
→ Tells you when the market just shifted from a squeeze to expansion — this is prime breakout territory.
🏗️ How It Works Under The Hood:
📈 Trend:
→ Compares EMA 50 vs EMA 200. Standard institutional trend filter.
⛰️ Slope:
→ Checks whether EMA50 is rising, falling, or flat based on its slope over the past 5 bars.
🚀 Momentum:
→ Uses RSI:
→ RSI > 55 → Momentum Bullish
→ RSI < 45 → Momentum Bearish
→ RSI between 45-55 → Neutral / No strong pressure
🌪️ Volatility:
→ Uses Bollinger Band Width (BB Width):
→ Expanding → Breakouts, volatility rising.
→ Contracting → Squeeze, compression, range.
💥 Breakout Watch:
→ Triggers when volatility was contracting for 5 candles → then starts expanding.
→ This often precedes massive directional moves.
🎯 How to Use It for Swing Trades:
🔥 Prime Swing Setup Checklist:
→ ✅ Trend: Bullish or Bearish (no Neutral).
→ ✅ Slope: Rising (Bull) or Falling (Bear).
→ ✅ Momentum: Strong Bullish or Strong Bearish.
→ ✅ Volatility: Expanding.
→ ✅ Breakout Watch: Active → If it just flipped from contraction to expansion, this is often the start of the move.
→ → This is a high-conviction swing setup.
🔥 Swing Entry Example (Long):
→ Trend: Bullish
→ Slope: Rising
→ Momentum: Strong Bullish
→ Volatility: Expanding
→ Breakout Watch: Active (optional but ideal)
→ ✅ → Look for pullbacks to support zones, moving averages, or breaks of recent highs.
→ Entry → On pullback confirmation or breakout candle.
→ Stop → Below swing low / ATR stop.
→ TP → Based on Risk/Reward or prior highs.
🔥 Swing Entry Example (Short):
→ Trend: Bearish
→ Slope: Falling
→ Momentum: Strong Bearish
→ Volatility: Expanding
→ ✅ Ideal when price is breaking down from a squeeze or retesting failed support.
🚫 Avoid Trades When:
Trend is Neutral.
Slope is Flat.
Volatility is Contracting.
Momentum is Neutral.
→ These are chop conditions → low win rate → avoid.
🧠 Pro Tips:
📊 Combine it with structure: Use it with supply/demand, support/resistance zones, or liquidity levels.
⏳ Hold during expansions: As long as Volatility = Expanding, the move often continues.
🚩 Exit or tighten stops if: Volatility contracts and slope flattens → move may be done.
🔥 Breakout Watch Active: Means a squeeze just broke → often the start of large moves.
🏆 Bottom Line:
→ This tool isn’t about buy/sell signals.
→ It’s a market condition scanner that tells you:
“Is this a time to hunt aggressive swing trades or stand down?”
→ When all conditions align → You have a high-probability trade environment.
