Zero Lag MTF On Balance Volume Oscillator by CoffeeShopCryptoIntroducing the Zero Lag Multi Timeframe On Balance Volume Oscillator — the next evolution in volume trading.
Imagine tracking both your trading timeframe and any higher timeframe volume in real time, with absolutely zero lag and no waiting for candles to close.
Whether you’re comparing a 1-minute chart to a 2-hour chart, or a 5-minute to a daily, you’ll instantly see how volume is shifting across timeframes — live, as it happens.
This unique oscillator reveals volume divergences, confirms breakouts, and shows you exactly when buyers or sellers are in control by oscillating around a zero line — with no repainting, ever.
Don’t let delayed tools make you miss the move. Stay ahead of the market with the Zero Lag Multi Timeframe OBV Oscillator — and trade with volume on your side.
(OBV) was created by Joe Granville and introduced in his 1963 book Granville's New Key To Stock Market Profits.
The indicator is significant in history because it was one of the first known indicators to account for positive and negative volume flow.
However the concept and method most people use for today is simply observing a singular current timeframe chart of volume.
The purpose of this volume indicator is to tell you when both the higher timeframe volume and lower timeframe volume are moving in accordance with each other so you have a more clear understanding of the broad picture of the market movement.
This indicator uses the same basic concept of OBV but plots it as an oscillator.
Volume Divergence
What is a Volume Divergence:
A volume divergence takes place when the spread between the HTF and LTF volume isnt reaching higher highs or lower lows while price is reaching higher highs and lower lows. This is more accurate than noting divergence peaks from other indicators like the RSI or MACD because those are giving you an average but the OBV in its "RAW" setting is giving you actual bullish or bearish volume spikes per candle.
How to trade a Volume Divergence:
When you note either a bullish or bearish volume divergence you need to switch to a divergence trading strategy.
BULLISH DIVERGENCE STRATEGY
1.Zone out the range of candles that caused the divergence
2. If this is a bullish divergence, find the swing high on the volume between point A and B and mark that price level
3. This level should play out as a new support level for price.
4. Let the price break and retest this level
OR
BEARISH DIVERGENCE STRATEGY
1.Zone out the range of candles that caused the divergence
2. If this is a bearish divergence, find the swing low on the volume between point A and B and mark that price level
3. This level should play out as a new resistance level for price.
4. Let the price break and retest this level.
Confirming Trendline Breaks
While following short term trendlines on price, you can detect when price trends are broken.
If volume still supports the previous trend when the trendline is broken, you wait for price to react to a previous support or resistance level, or you want for price to retrace to a fair value gap and follow the trend that follows the supporting volume.
Confirming Trend Direction
Confirming a trend direction means that both the high timeframe and low timeframe trend agree with each other while price is moving away from a previously tested support or resistance area. Once price moves out of these key levels and the oscillator confirms a particular direction, you have the start of your new trend and are open for trades.
Volume Smoothing Settings
You can look at Volume in different ways. Commonly you want to smooth it to match your trading style. So if price is trending between range levels, you want to see HOW its trending. If your go to is to use an EMA, SMA, WMA, or other smoothing style, then set the ZLMTF OBV to match this in the "smoothing settings.
Here are the different ways you can set it and how it appears on the chart.
Raw Volume
This gives you the Raw volume calculations with no smoothing taking place.
(Commonly you would use this as price intercepts key levels.
SMA Smoothed Volume
This gives you the Raw volume smoothed over an SMA calculation which you would watch if you commonly use Smoothed Moving Averages on your chart while price is not near a support or resistance area.
Other Smoothing Outputs
You also have the ability to choose between EMA, SMMA, WMA, and VWAM types of smoothing to compare to the smoothing you use on your chart.
Volume

Auto AVWAP (Anchored-VWAP) with Breakout ScreenerAuto AWAP based indicator that is able to idenifty the breakout of AWAP

Purple Dot IndicatorDescription:
Identifies high-momentum candles using price % move + volume spike.
Purple = Combined signal | Blue = Price only | Orange = Volume only.
Created by Haseeb Badar (@HB_Stocks).

Stan's Magic PotionStan's Magic Potion Indicator
Overview
"Stan's Magic Potion" is a robust Pine Script® v6 indicator designed for short-term trading on 3-minute and 5-minute time frames, optimized for major indices such as AMEX:SPY , SP:SPX , NASDAQ:QQQ , and $IWM. This indicator integrates Opening Range Breakout (ORB) logic, Dynamic Momentum Metrics (DMM), VWAP, and confluence-based entry signals to deliver clear, actionable trade setups for bullish and bearish opportunities.
Key Features
Opening Range Breakout (ORB): Captures the high and low of the 9:30 AM – 9:45 AM EST opening range, locking these levels at 9:45 AM to identify breakout zones. Breakouts above or below these levels are highlighted with background colors for easy visualization.
DMM Cross Signals: Utilizes fast and slow Dynamic Momentum Metrics (DMM) to generate "CALL" and "PUT" signals on crossovers, with dynamic fill colors between the DMM lines to indicate trend direction.
Confluence Entry at 10:00 AM: Generates high-probability "CALL" or "PUT" signals at 10:00 AM when price aligns with key levels (above/below EMA 200, VWAP, and locked ORB high/low) and DMM trend confirmation.
VWAP and EMA 200: Plots VWAP and a 200-period EMA as dynamic support/resistance levels to aid in trend analysis.
Visual Clarity: Includes clear labels for trade signals, ORB lock markers, and color-coded plots for intuitive chart reading.
How to Use
Time Frame: Best used on 3-minute or 5-minute charts for AMEX:SPY , SP:SPX , NASDAQ:QQQ , or $IWM.
Trade Setups:
* Look for "CALL" or "PUT" signals from DMM crossovers throughout the session.
* Prioritize 10:00 AM confluence signals for higher-probability entries when price aligns with EMA 200, VWAP, and ORB levels.
* Monitor ORB breakouts (highlighted by background colors) for momentum-driven trades.
Risk Management: Always use proper risk management and confirm signals with additional analysis, as market conditions may vary.
Settings
* The indicator is pre-configured with default parameters (DMM settings, ORB time window, VWAP). No user inputs are required, ensuring simplicity and ease of use.
* Maximum bars back is set to 500 for performance optimization.
Notes
* This indicator is subject to the terms of the Mozilla Public License 2.0.
* © StanTheTradingMan.
* Designed for educational and informational purposes. Always backtest and validate strategies before live trading.
Why Use Stan's Magic Potion?
This indicator combines multiple proven technical concepts (ORB, DMM, VWAP) into a single, cohesive tool tailored for short-term traders. Its focus on key intraday time windows (9:30–9:45 AM and 10:00 AM) and clear visual cues make it an excellent choice for those seeking precision in fast-moving markets.
License
This Pine Script® code is licensed under the Mozilla Public License 2.0.

VOLs BTC & ETHInstant view of the combined trading volume for BTC and ETH across major exchanges.
Plots two lines — Σ VOL BTC and Σ VOL ETH — on any timeframe.
Choose whether to sum spot or futures markets in one click.

Gold Power Hours Strategy📈 Gold Power Hours Trading Strategy
Trade XAUUSD (Gold) or XAUEUR during the most volatile hours of the New York session, using momentum and trend confirmation, with session-specific risk/reward profiles.
✅ Strategy Rules
🕒 Valid Trading Times ("Power Hours"):
Trades are only taken during high-probability time windows on Tuesdays, Wednesdays, and Thursdays , corresponding to key New York session activity:
Morning Session:
08:00 – 11:00 (NY time)
Afternoon Session:
12:30 – 16:00
19:00 – 22:00
These times align with institutional activity and economic news releases.
📊 Technical Indicators Used:
50-period Simple Moving Average (SMA50):
Identifies the dominant market trend.
14-period Relative Strength Index (RSI):
Measures market momentum with session-adjusted thresholds.
🟩 Buy Signal Criteria:
Price is above the 50-period SMA (bullish trend)
RSI is greater than:
60 during Morning Session
55 during Afternoon Session
Must be during a valid day (Tue–Thu) and Power Hour session
🟥 Sell Signal Criteria:
Price is below the 50-period SMA (bearish trend)
RSI is less than:
40 during Morning Session
45 during Afternoon Session
Must be during a valid day and Power Hour session
🎯 Trade Management Rules:
Morning Session (08:00–11:00)
Stop Loss (SL): 50 pips
Take Profit (TP): 150 pips
Risk–Reward Ratio: 1:3
Afternoon Session (12:30–16:00 & 19:00–22:00)
Stop Loss (SL): 50 pips
Take Profit (TP): up to 100 pips
Risk–Reward Ratio: up to 1:2
⚠️ TP is slightly reduced in the afternoon due to typically lower volatility compared to the morning session.
📺 Visuals & Alerts:
Buy signals: Green triangle plotted below the bar
Sell signals: Red triangle plotted above the bar
SMA50 line: Orange
Valid session background: Light pink
Alerts: Automatic alerts for buy/sell signals

Average Volume (Millions) On ChartThe indicator shows the average number Volume in the period of time of your decision

Volume Breakout SignalsScript by Hanssome
The Volume Breakout Signals indicator is a trading tool designed to identify potential entry points by pinpointing high-momentum price breakouts on your main chart. It operates on a simple but powerful principle: a true breakout should be supported by a significant increase in trading volume.
The indicator plots two primary visual elements on your price chart:
Pivot Highs and Lows: These are marked with green and red circles and represent the most recent significant swing points in the price. They act as dynamic support and resistance levels, and the script watches for the price to break past them.
BUY and SELL Labels: These signals appear directly on the chart to indicate a potential trading opportunity.
A signal is only generated when two specific conditions are met simultaneously:
Price Breakout: A BUY signal requires the price to cross decisively above the most recent pivot high. A SELL signal requires the price to cross below the most recent pivot low.
Volume Confirmation: This price breakout must be accompanied by a recent spike in trading volume. This confirmation suggests strong momentum and conviction behind the move, increasing the probability of a successful breakout.
All the parameters, such as the sensitivity of the pivot points and the definition of a volume spike, can be adjusted in the indicator's settings to fit your specific trading style and the asset you are viewing.

Volume VisualizerVolume by Hannsome
The Volume Visualizer is a simple yet effective tool designed to display trading volume in a dedicated panel below the main price chart. Its primary goal is to help you easily identify when trading activity is significantly higher than usual.
The indicator plots two key elements:
Volume Bars: These are standard volume bars showing the amount of trading activity for each period. To draw your attention to important moments, bars with unusually high volume are highlighted in a distinct color (yellow by default).
Average Volume Line: A moving average line (orange by default) is plotted over the volume bars. This line represents the recent average trading volume, giving you a clear baseline to compare the current volume against.
A "significant" volume spike is defined as any period where the volume exceeds the moving average by a certain multiplier. You can adjust both the moving average length and this multiplier in the indicator's settings to fine-tune its sensitivity to what you consider a significant spike in activity.

Delta Spike Detector [GSK-VIZAG-AP-INDIA]📌 Delta Spike Detector – Volume Imbalance Ratio
By GSK-VIZAG-AP-INDIA
📘 Overview
This indicator highlights aggressive buying or selling activity by analyzing the imbalance between estimated Buy and Sell volume per candle. It flags moments when one side dominates the other significantly — defined by user-selectable volume ratio thresholds (10x, 15x, 20x, 25x).
📊 How It Works
Buy/Sell Volume Estimation
Approximates buyer and seller participation using candle structure:
Buy Volume = Proximity of close to low
Sell Volume = Proximity of close to high
Delta & Delta Ratio
Delta = Buy Volume − Sell Volume
Delta Ratio = Ratio of dominant volume side to the weaker side
When this ratio exceeds a threshold, it’s classified as a spike.
Spike Labels
Labels are plotted on the chart:
10x B, 15x B, 20x B, 25x B → Buy Spike Labels (below candles)
10x S, 15x S, 20x S, 25x S → Sell Spike Labels (above candles)
The color of each label reflects the spike strength.
⚙️ User Inputs
Enable/Disable Buy or Sell Spikes
Set custom delta ratio thresholds (default: 10x, 15x, 20x, 25x)
🎯 Use Cases
Spotting sudden aggressive activity (e.g. smart money moves, traps, breakouts)
Identifying short-term market exhaustion or momentum bursts
Complementing other trend or volume-based tools
⚠️ Important Notes
The script uses approximated Buy/Sell Volume based on price position, not actual order flow.
This is not a buy/sell signal generator. It should be used in context with other confirmation indicators or market structure.
✍️ Credits
Developed by GSK-VIZAG-AP-INDIA
For educational and research use only.

Angular Volatility📘 Angular Volatility – Technical Indicator for Trend Intensity Analysis
Angular Volatility is an advanced technical analysis tool developed specifically for cryptocurrency markets on the Binance platform. Its primary objective is to detect structural shifts in price dynamics with greater precision by analyzing the combined behavior of market volume and the angular slope of a customizable moving average.
Unlike conventional indicators that operate directly over the price chart, this script displays all of its metrics within a dedicated secondary window, allowing a cleaner and more isolated view of critical movements such as acceleration, pause, or potential reversals. In addition, it includes a robust system for volatility intensity classification, automated alerts, and a live technical info table that summarizes key real-time values.
🎯 What does Angular Volatility analyze?
Angular Volatility measures the interaction between traded volume and the angle of a moving average selected by the user from six types (SMA, EMA, WMA, HMA, ALMA, and SWMA). From these variables, the system generates:
- Angular Volatility Index: A composite value representing the product of volume and angular slope, reflecting the true strength behind a move.
- Angular Oscillator: A standalone line that displays the directional angle (in degrees) of the selected moving average, limited between ±90°.
- Volatility Intensity Levels: Automatic classification of peaks into four levels—moderate, elevated, high, and extreme—displayed with distinct colors and geometric shapes.
- Technical Data Table: A real-time panel showing both the current angle of the moving average and the current value of the Angular Volatility Index in a compact, user-friendly format.
- Custom Alerts System: Five built-in alert conditions allow users to monitor key volatility events without needing to watch the chart constantly.
⚙️ Configuration Parameters
The script includes multiple configuration sections that allow users to fine-tune both its analytical precision and visual appearance:
- High Volume Detection: Adjustable historical depth and sensitivity to identify significant volume spikes.
- Initial Moving Average Settings: Selection of MA type, length, offset, and dynamic coloring based on slope angle.
- Volatility Index Options: Fully customizable visuals, synced with the angle values set in the moving average section.
- Volatile Intensity Styling: Choose which levels to display, customize their colors and icons, and optionally color the main chart candles for quick interpretation.
- Information Table: Options to show/hide the table, adjust size and position, and customize background/text colors.
🧠 Compatibility and Technical Recommendations
This indicator was developed to operate exclusively on Binance using the following timeframes only: 1m – 5m – 15m – 30m – 1h – 4h – 1D.
This restriction is deliberate, ensuring consistency in the mathematical model used to calculate angular data. Using this script on other platforms or timeframes may result in inaccurate readings or logic errors, as asset types like stocks, forex, or indices behave differently in terms of volume structure and slope normalization.
If applied to unsupported markets or timeframes, the script will automatically display a warning message without calculating or drawing technical values.
🔬 Practical Example
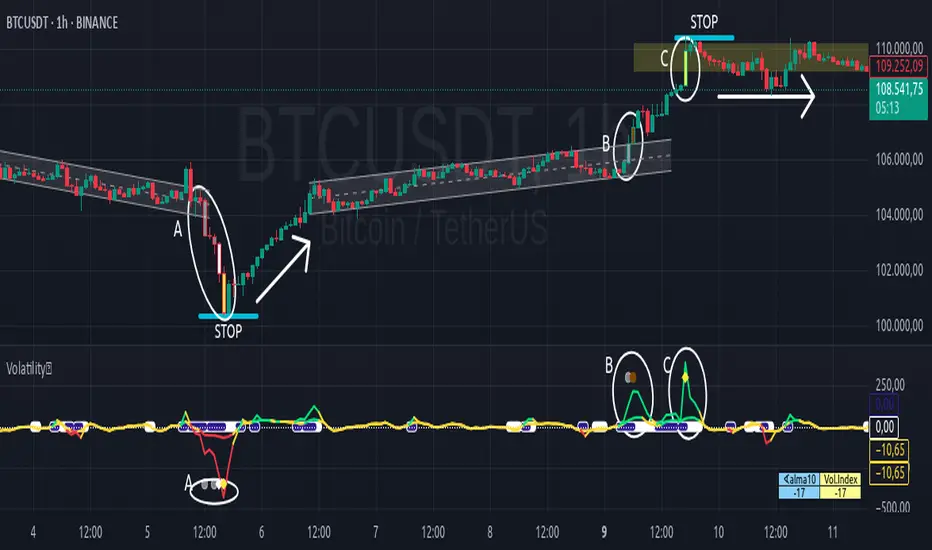
The following case study—applied to the BTC chart on a 1-hour timeframe—demonstrates how volatility intensity levels behave in structured scenarios such as channel breakdowns, rebound phases, false breakouts, and high-energy consolidation zones:
🔻 Letter A: Downward breakout and full intensity sequence
- The price was moving within a fairly uniform descending channel, which ends with a false breakout to the upside—quickly invalidated as a market trap.
- The true breakout occurs to the downside through a strong red candle, categorized by the system as moderate intensity (gray).
- This candle is followed by a Doji, then a smaller red candle also marked as moderate intensity, followed by a larger red candle showing high intensity (white), and finally a stronger red candle painted yellow, indicating extreme intensity.
- This full sequence (moderate → moderate → high → extreme) marks a technical climax, after which the price begins a progressive reversal.
- Although the drop unfolds over five red candles, the subsequent recovery takes place over 18 candles, mostly green and smaller in size, forming a “V” shape: sharp decline followed by a steady upward climb.
- This entire section is enclosed within an oval labeled A, with the four intensity levels clearly reflected on both the main chart and the Angular Volatility panel.
🔼 Letter B: Ascending channel and breakout with increasing bullish pressure
- After the rebound described in section A, the price begins forming a new ascending channel, marked with the letter B. This channel starts right where the previous range ends, with a very slight upward offset—nearly indistinguishable.
- In the final stage of this channel, a green candle classified as moderate intensity (gray) attempts a breakout. It is followed by a stronger green candle, painted brown, indicating elevated intensity and confirming bullish acceleration.
- Both candles and the corresponding peak on the Angular Volatility indicator are enclosed in an oval labeled B, representing a second wave of directional energy.
⛓️ Letter C: Resistance zone and consolidation following extreme volatility
- The upward movement continues until it reaches a resistance level, where a large green candle emerges, painted yellow to denote extreme intensity.
- Unlike the previous case in section A, this movement does not trigger a sharp reversal, but rather a technical pause followed by sideways consolidation, forming a horizontal range.
- This zone is marked on the chart with an oval labeled C, representing a classic case of stopping volume and range formation.
SKVolBal Pro v1.0SKVolBal Pro v1.0
Volume-RSI Fusion with Advanced Pattern Detection
This space-efficient indicator combines volume analysis, RSI, and candlestick pattern recognition in a single pane. Key features:
Volume-RSI Integration
Dual view modes: Stacked volume (Type 1) or separated buy/sell columns (Type 2)
RSI overlay with configurable levels (default 30/70)
Color-coded volume: Green = Buying pressure, Red = Selling pressure
Pattern Detection & Labels
Text labels indicate detected patterns with priority weighting:
C: Volume Climax
E: Engulfing Pattern
D: Divergence
H: Hammer
I: Inverted Hammer
S: Shooting Star
M: Hanging Man
B: Bearish Marubozu
G: Gravestone Doji
Label color indicates direction: Green = Bullish, Red = Bearish
Smart Signal Validation
Adaptive thresholds adjust to market volatility
Volume filters (vs SMA20) minimize false signals
Pattern weighting system prioritizes significant signals
Hover labels show all detected patterns with weights
Customization & Alerts
Adjust 15+ parameters including pattern sensitivity and volume allocation
Toggle individual patterns on/off with priority weighting
Built-in alerts for all 12 pattern types
Interpretation Guidance:
Strong signals: Labels appearing at RSI extremes (near 30/70) with high volume
Confirmation: Multiple patterns detected simultaneously (view via tooltip)
Caution: Isolated signals without volume/RSI confluence
Priority: Higher-weighted patterns override label display (weights 70-100)
*Optimized for efficiency with 500-label limit and 200-bar lookback. Color intensity reflects signal strength.*

FoundryFutures - Multi-Timeframe Vwap and Prior ValueMulti-Timeframe VWAP with Previous Session Volume Profile Value Areas
Overview
This indicator combines Volume Weighted Average Price (VWAP) analysis with previous session’s Volume Profile Value Areas, helping traders identify key institutional price levels and important market structure zones. It shows both the current period VWAP and the prior period’s value area levels, creating a robust framework for recognizing potential support and resistance.
🔑 Key Features
1. Multi-Timeframe VWAP
Calculates real-time VWAP for the current period across multiple timeframes: Hourly, 4-Hour, Daily, 2-Day, 3-Day, Weekly, Monthly, Quarterly, and Yearly.
Dynamic color-coding based on VWAP slope to visualize trend direction.
Displays the previous period’s closing VWAP as a static reference.
2. Standard Deviation Bands
Includes up to three customizable deviation levels for current VWAP.
Plots both current period bands and previous period’s closing deviation levels.
Optional fill between bands for enhanced visual context.
Upper band extensions available for deeper analysis.
3. Previous Session Volume Profile Value Areas
Plots previous session’s value areas on the current chart.
Includes Previous Value Area High (VAH), Value Area Low (VAL), and Point of Control (POC) — representing where the most volume traded.
Historical levels often act as key support or resistance in the current period.
Adjustable value area percentage (default is 70%).
4. Visual Enhancements
Color-coded fills show when price is above/below previous value areas.
Imbalance zones highlighted between current price and historical levels.
Flexible line styles, colors, and transparency options.
Optional labels with clear prefixes (e.g., PD- for Prior Day, PW- for Prior Week).
5. Alert Functionality
All previous session levels are available in the alerts menu.
Set alerts for price approaching or crossing prior value areas.
Monitor interactions with previous session POC or value edges.
📌 Use Cases
Gap Analysis: Spot overnight or weekend gaps relative to prior value areas. Watch for acceptance or rejection back into prior value zones.
Opening Range Trading: Assess strength/weakness at open vs. previous session’s levels. Trade breakouts or fades around previous VAH/VAL.
Continuation vs. Reversal: Holding above previous VAH suggests continuation; failure at VAL can imply reversal risk. POC often acts as a magnet.
Risk Management: Prior value edges provide logical stop/target zones. Use prior POC as a target for mean reversion strategies.
⚙️ How It Works
The script continuously calculates the current VWAP and overlays previous period’s volume profile levels:
Daily chart: Shows yesterday’s value area and POC.
Weekly chart: Shows last week’s value area and POC.
Monthly chart: Shows previous month’s levels.
This gives traders context on where the bulk of volume traded historically, helping assess real support/resistance built on actual activity.
🛠️ Settings Groups
VWAP Settings: Timeframe, deviation bands.
Color Settings: Full color and line style control.
Value Area Settings: Styling and extensions for prior levels.
Label Settings: Clear identification of levels with prefixes.
✅ Best Practices
Use previous daily levels for intraday trading.
Use previous weekly levels for swing setups.
Use previous monthly levels for longer-term positioning.
Look for confluence between multiple timeframe levels.
This indicator helps bridge real-time VWAP flows with historical volume profile zones — giving traders context for where institutional positioning may remain influential.
⚠️ Disclaimer
This script is provided as-is for educational and informational purposes only. Neither FoundryFutures nor the author(s) of this code accept any liability for financial losses or damages resulting from its use. Trading involves substantial risk and is not suitable for every investor. Always do your own research and consult a qualified financial advisor before making any trading decisions.

BskLAB - Money Flow X🧠 BskLAB – Money Flow X | Full Usage Guide & Description
BskLAB – Money Flow X is a professional-grade volume analysis tool featuring two core modes designed to detect market pressure, momentum, and divergence with precision. When used alongside BskLAB Signal Assistant, it provides powerful volume-based confirmation to enhance signal quality.
🔧 Preset Modes Overview
📊 Mode 1: Money Flow (WaveTrend + Divergence)
This mode uses a custom WaveTrend oscillator to reflect momentum from buying/selling pressure, along with automatic divergence detection. It starts by calculating the average price from and filters through the EMA and SMA to create WT1 and WT2.
Key Features:Dual WaveTrend lines (WT1 & WT2) with crossover signals
Visual display of overbought / oversold zones
Automatic divergence detection:
🟢 Green = Classic Bullish Divergence
🔴 Red = Classic Bearish Divergence
🔵 Blue = Hidden Bullish Divergence
🟠 Orange = Hidden Bearish Divergence
Best Used For:
Identifying early reversals and exhaustion zones during high or low volatility phases.
🚀 Mode 2: Volume Momentum (Dynamic Histogram)
This mode displays volume-driven pressure using histogram bars that expand or contract with momentum. It calculates PercentB (%B) from Bollinger Band behavior to reflect how far price stretches away from its recent average range.
Key Features:Histogram expands with growing momentum
Dynamic bar coloring:
🔴 Red = selling pressure emerges
⚪ White = buying pressure emerges
Uses %B from Bollinger Band for calculation
Best Used For:
Confirming strong directional moves or identifying momentum buildup or fade — especially when price moves far from the average.
🔬 Internal Logic Breakdown (Main WT & Money Flow)
✅ 1. WaveTrend System (WT1 & WT2)
WT1 = Fast line (short-term momentum)
WT2 = Trend filter (slower)
Derived from (H+L+C)/3 with EMA and SMA smoothing
Color Logic:
🔼 WT1 crosses above WT2 → Cyan (Bullish Momentum)
🔽 WT1 crosses below WT2 → White (Bearish Momentum)
Zero Line Behavior:
Above 0 = strong uptrend confirmation
Below 0 = strong downtrend confirmation
✅ 2. Money Flow Line (MF Line)
Measures volume pressure based on price vs. long-period EMA
Displayed as an area plot underneath
Color Logic:
🔵 Light Cyan = Buying pressure emerging
⚪ Light White = Selling pressure emerging
Color dynamically changes based on volume shifts
Signal Strategy:
WT1 crossover + Cyan MF = Buy Confirmation
WT1 crossover + White MF = Sell Confirmation
Mismatched signals = caution advised
🧩 Designed to Pair with BskLAB – Signal Assistant
BskLAB – Money Flow X works best when used alongside 👉 BskLAB – Signals Assistant
Both tools are designed to complement each other:
Signals Assistant provides structural and momentum-based trade entries
Money Flow X confirms whether real buy/sell volume supports those entries
✅ How to Use Together:
Wait for a Buy/Sell signal from Signal Assistant
Confirm with:
WT crossover + MF color (Money Flow mode)
Histogram color shift (Volume Momentum mode)
✅ Money Flow X acts as the official volume confirmation layer within the BskLAB system to reduce false signals and improve decision-making confidence.
⚙️ Customization Options
Volume Length (for Volume Momentum)
WT Smoothing (for Money Flow)
Toggle Classic / Hidden Divergences
🔶 CONCLUSION
BskLAB – Money Flow X isn’t just another indicator — it’s a decision-making support system designed to uncover the truth behind price movements.
It helps traders gain clarity during uncertainty, separate strong signals from noise, and develop a systematic approach to entries.
By combining oscillator-based momentum + volume behavior + divergences, this tool becomes essential for traders who prioritize execution accuracy in real-world conditions.
🔶 RISK DISCLAIMER
Trading involves high risk and is not suitable for everyone. All tools, scripts, and content provided by BskLAB are for educational purposes only and do not constitute financial advice.
Past results do not guarantee future performance — trade responsibly.

Wyckoff Trading Range AnalyzerA wyckoff indicator that relies on volume to analyze the chart to understand if it is long or short and tell you when to buy and sell

Funding Ratio BinanceThis advanced indicator is designed for perpetual futures traders looking for an edge by understanding market dynamics on Binance. It provides key insights into the Premium Rate and Estimated Funding Rate, helping you make informed decisions about your trades.
What does this indicator offer you?
Premium Rate (4H): Displays the real-time difference between the perpetual futures price and the spot price on Binance. A positive premium can indicate bullish demand from futures buyers, while a negative premium suggests bearish demand. This data updates every 4 hours.
Estimated Funding Rate (4H): Calculates an estimate of the upcoming funding rate to be applied on Binance. This rate is crucial, as it determines payments between long and short positions. A positive rate means longs pay shorts, and vice versa. Knowing this estimate can help you anticipate market movements and manage your positions.
Suggested Position: Based on the current Premium Rate, the indicator provides a suggested position ("Long", "Short", or "Neutral"). This is a helpful guide for evaluating the overall sentiment of the perpetual futures market relative to the spot price.
Key Features:
Real-time Data: Obtains information directly from Binance (via TradingView) to ensure maximum accuracy.
Fixed Timeframe: Premium and funding calculations are performed on a fixed 4-hour timeframe, regardless of your current chart's timeframe.
Configurable: You can adjust the fixed Binance interest rate used in the Estimated Funding Rate calculation, as well as clamping limits to fine-tune its relevance. You can also customize the table's position on your chart to suit your preferred layout.
Automatic Pair Detection: For the Premium Rate, the indicator automatically detects the cryptocurrency pair you are currently viewing, ensuring relevant data without extra configuration.

Multy Dynamic POCThis script displays up to 4 independent Point of Control (POC) levels based on volume profile logic.
📌 Each POC can be configured individually:
Period options: Daily (D), Weekly (W), Monthly (M), or BARS (rolling bar window).
Dynamic recalculation when the period changes (e.g., new day/week/month or custom bar count).
Price-anchored lines for each POC level that scale correctly with the chart.
Customizable line color and thickness.
🔍 How it works:
For each active POC line, the script builds a simple volume distribution based on the candle’s average price (hl2) and volume.
The price range is split into 100 buckets. The one with the highest accumulated volume is selected as the Point of Control (POC).
In BARS mode, POC is recalculated every N bars. In D/W/M modes, it resets exactly at the beginning of a new period (according to TradingView’s time() function).
✅ Useful for:
Traders applying volume profile analysis without needing the full built-in volume profile tool.
Spotting dynamic high-volume zones in trends or ranges.
Strategy development or confirmation around high-interest price levels.
_______________________________________________________________________________
Данный индикатор отображает до 4 независимых уровней Point of Control (POC), рассчитанных по объёмам.
📌 Каждый POC можно настраивать отдельно:
Периоды: День (D), Неделя (W), Месяц (M) или BARS (скользящее окно по количеству баров).
Автоматический пересчёт при смене периода (например, новый день, неделя или месяц).
Линии POC привязаны к цене и масштабируются вместе с графиком.
Настраиваемый цвет и толщина линий.
🔍 Как работает:
Для каждой активной линии POC создаётся объёмное распределение: берется средняя цена свечи (hl2) и объем.
Диапазон цен делится на 100 уровней. Тот, где накоплено больше всего объёма, и есть POC.
В режиме BARS уровень пересчитывается каждые N баров. В режимах D/W/M — строго в начале нового периода.
✅ Подходит для:
Трейдеров, использующих объёмный анализ, но не имеющих платной подписки на Volume Profile.
Поиска уровней интереса и подтверждения сигналов.
Разработки стратегий с опорой на объём.

Price Coil Expansion & Trap Detector✅ Title:
Price Coil Expansion & Trap Detector (PCE-TD)
⸻
✅ Updated Description:
The PCE-TD (Price Coil Expansion & Trap Detector) is a hybrid volatility and market structure indicator designed to identify three high-impact setups:
1. Price Coil Compression Zones
2. Breakout Buy/Sell Signals (Expansion Events)
3. False Breakout Traps (Bull/Bear Fakes)
⸻
🔍 Core Concepts & Signal Logic
✅ 1. Price Coil Detection (Compression Phase)
• Highlights tight-range zones where price volatility shrinks and candles display smaller bodies with larger wicks.
• Criteria used:
• Consecutive shrinking bodies (customizable)
• High average wick-to-body ratio
• Coil zone must be tighter than recent range average
• These zones are shaded in gray on the chart to signal potential buildup before explosive movement.
⸻
✅ 2. Breakout Expansion Signals
Triggered when price breaks out of the coil zone with strong body momentum, optional volume spike, and optional EMA filter.
🔺 Signal: Buy↑ (Green Triangle Up)
• Appears below bar
• Triggers when:
• Price breaks above coil high
• Candle body exceeds average × user-defined multiplier
• Volume spike (if enabled)
• Trend filter (optional EMA confirmation)
🔻 Signal: Sell↓ (Red Triangle Down)
• Appears above bar
• Triggers when:
• Price breaks below coil low
• Candle body exceeds threshold
• Optional volume and trend confirmation
💬 Alerts Triggered:
• PCE-TD: Coil breakout UP
• PCE-TD: Coil breakout DOWN
These will be sent via TradingView’s alert system if configured using alert conditions.
⸻
✅ 3. False Breakout Detector (Trap Finder)
Identifies fake breakouts that fail within the next X bars and re-enter the prior range.
❌ False Bullish Breakout:
• Printed as Red X (above bar)
• Also subtly highlights background red
❌ False Bearish Breakout:
• Printed as Green X (below bar)
• Background turns green
These help avoid chasing traps and improve timing accuracy after failed breakouts.
⸻
⚙️ Customization Parameters:
• Coil Window Length, Shrinking Body Count, Wick-to-Body Ratio
• Volume Spike Multiplier
• EMA Trend Filter
• Range Lookback and Trap Detection Window
• Enable/disable zones, signals, and trap markers
⸻
🧠 Designed For:
• Breakout traders
• Volatility compression pattern followers
• Traders avoiding fake breakouts
• Scalpers and swing traders alike

Pro MACD + RSI Confirm [Secured + Targets] Real-time signal processing
Background color + signal arrows
Alerts on bullish & bearish confirmation
Profit Target 1 = ATR × 2.0
Profit Target 2 = ATR × 4.0

Volumetric Compressed MAVCMA uses the compressor and weighted stdev functions originally translated to pine by @gorx1. Compressor is usually used in audio to avoid clipping of certain frequencies. The original idea is actually pretty simple:
ma(simple string smt, float src, simple int len) =>
switch smt
'RMA' => ta.rma(src, len)
'SMA' => ta.sma(src, len)
'EMA' => ta.ema(src, len)
'WMA' => ta.wma(src, len)
'HMA' => ta.hma(src, len)
'LSMA' => ta.linreg(src, len, 0)
=> na
compressor(float in_1, simple int len, simple int thresh_dn_m, simple int thresh_up_m) =>
data = math.log(math.abs(in_1))
loc = ta.wma(data, len)
dev = wstdev(data, len)
thresh_dn = loc + dev * thresh_dn_m
thresh_up = loc + dev * thresh_up_m
math.exp(math.min(math.max(data, thresh_up), thresh_dn)) - math.exp(thresh_up)
compressed_out = compressor(volume, len_window, up_thresh, down_thresh)
comp_ma = ma(ma_type, close * compressed_out, len_ml) / ma(ma_type, compressed_out, len_ml)
vwma = ma(ma_type, close, len_window)
We get the ratio of the compressed volume calculation and plot it with the base MA. Base MA's length is determined by window size input compared to ML length that is used for compressed version.
This provides us another possible confirmation indicator that can be used to take advantage of volume ranges. Autmated crossover alerts are also added. A reminder is that this kind of indicators should not be used on it's own for trading but rather should be used as a confirmation along with your trend detection and main entry indicators to provide additional confluence.

High Accuracy Volume Breakout StrategyHigh Accuracy Volume Breakout Strategy (EMA + RSI Filter)
🧠 Description:
This is a high-accuracy breakout strategy based on volume surges, trend confirmation, and momentum filtering, designed for intraday and short-term trading.
The strategy aims to capture strong directional moves triggered by sudden increases in volume, with entry filters to avoid low-quality or choppy signals.
✅ Entry Logic:
🔺 Buy Entry Conditions:
Current candle closes above previous high
Volume is greater than 1.5× the 20-period average
Price is above 50 EMA (uptrend confirmation)
RSI is below 70 (not overbought)
🔻 Sell Entry Conditions:
Current candle closes below previous low
Volume is greater than 1.5× the 20-period average
Price is below 50 EMA (downtrend confirmation)
RSI is above 30 (not oversold)
🎯 Exit Logic:
Stop Loss: 1.2 × ATR(14)
Take Profit: 2.0 × ATR(14)
🧪 Recommended Settings:
Parameter Value
Timeframe 5-minute, 15-minute
Markets Gold (XAUUSD), Nifty, BankNifty, BTC, NASDAQ
Risk/Reward ~1:1.6
Expected Accuracy ~65–75% in trending markets
📊 Features:
🔸 ATR-based dynamic stoploss and target
🔸 Volume spike confirmation to detect real breakouts
🔸 EMA 50 trend filter to reduce false signals
🔸 RSI filter to avoid extreme zones (overbought/oversold)
🔸 Plotted buy/sell arrows for clarity
⚠️ Disclaimer:
This strategy is for educational purposes only. Please backtest and paper trade before using in live markets. Performance may vary depending on asset and timefram
plot(ema50, color=color.orange)

MA Respect IndicatorThis indicator tells you how much a moving average is being respected.
Green = highly respected
Blue = watch out, transitioning
Red = not respected at all.
If you trade moving averages, you may find this very helpful with determining when and when not to trust a MA. This can be changed to look at a VWAP, and many other different MA calculation types.

GamePirer M1GamePirer M1 Strategy - Executive Summary (English)
Overview
The GamePirer M1 is a sophisticated intraday trading strategy specifically designed for gold (XAU/USD) trading on 1-minute timeframes. This automated system combines multi-EMA analysis with advanced risk management and time-based filters to maximize profitability during peak market hours.
Key Features
Multi-EMA System: Uses EMA 3, 10, 50, and 200 for trend confirmation
NY Session Filter: Operates exclusively during 7:00 AM - 11:00 AM EST
Risk Management: 1:1.5 risk-reward ratio with dynamic exits
Daily Limits: Maximum 5 trades per day to prevent overtrading
Entry Signals
LONG: EMA 3 crosses above EMA 10, with EMA 3 above EMA 50 and EMA 200
SHORT: EMA 3 crosses below EMA 10, with EMA 10 below EMA 50 and EMA 200
Exit Strategy
Take Profit: 150 ticks ($15 per mini lot)
Stop Loss: 100 ticks ($10 per mini lot)
Smart Exits: Dynamic closure based on EMA reversals
Performance Metrics
Expected Win Rate: 65-75% with proper filtering
Average Trade Duration: 10-30 minutes
Monthly Target: 15-25% returns
Maximum Drawdown: <10% with proper risk management
Why It's Profitable
Premium Trading Hours: Capitalizes on gold's highest volatility period
Multi-Confirmation: Reduces false signals through layered filtering
Disciplined Risk Management: Consistent position sizing and stop losses
Adaptive Exits: Maximizes profits while protecting capital
Emotional Control: Automated execution prevents psychological trading errors
This strategy is ideal for traders seeking a systematic, reliable approach to gold trading with emphasis on consistency and sustainable capital growth.
