The cycles of the S&P500 | PART 1The cycles of the S&P500 / PART 1
This post introduces a study I'm conducting with the main objective of understanding the cycles and sub-cycles that the S&P500 Index has.
Why am I studying the S&P500? Because it is the most relevant index in the world. There is not any other economy in the world that gets close to the returns of the US stock market as a whole, and also, we have a massive amount of data back from more than 100 years ago. So with all that said, let's start.
The fundamental view I have regarding the market is that the price has moved between periods of fear and optimism through history, on a cycle that never stops. There is either Fear or Optimism, in other way impulses and corrections. On this chart, we can go through periods of optimism and fear caused by multiple factors, different governments, different geopolitical situations, massive crises, changes in interest rate; you name it, all of them are on this chart, the dot com bubble, the subprime crisis, the missile crisis with Cuba, wars, oil crisis, 1929, etc.
The first conclusion I can make at first glance is that despite what was causing it, fear and optimism tend to have characteristics that we may be able to understand. This is a strong base for technical analysis as a discipline. Fear looks the same through several situations, and the same applies to optimism. That's why understanding the price is a powerful element to conclude where we are on the cycle. So what is the price telling us?
In this post, we will not only go through the big cycles, but also we want to understand the smaller ones. Now I will put my main conclusions regarding the information I have found.
THE BIG CYCLE:
--------------------
Impulse 1: 1877 - 1881 = 4 Years / 152% from bottom to top.
Correction 1: 1881 - 1897 = 16 Years / -41% from top to bottom.
--------------------
Impulse 2: 1897 - 1902 = 5 Years / 144% Fromb bottom to top.
Correction 2: 1902 - 1921 = 19 Years / -40% from top to bottom.
--------------------
Impulse 3: 1921 - 1929 = 8 Years / 400% from bottom to top.
Correction 3: 1929 - 1933 = 4 years / -84% from top to bottom.
--------------------
Here we can observe a clear change in behavior regarding impulses. Until 1933 we observe short impulsive periods and long corrective periods. From 1933 until now, this trend reversed, we have long impulsive periods and short corrective periods compared to the past.
--------------------
Impulse 4: 1933 - 1969 = 36 years / 2106% from bottom to top.
Correction 4: 1969 - 1974 = 5 years / -48% from top to bottom.
--------------------
Impulse 5: 1974 - 2000 = 26 years / 2500% from bottom to top.
Correction 5: 2000 - 2009 = 9 years / -58% from top to bottom.
--------------------
Impulse 6: 2009 - present = 13 years / 600% from bottom to top.
In PART 2 of this series of posts , I will go through the sub-cycles we observe from 1933 until now. My main objective is to understand the similarities between these impulsive situations (impulse 4,5 and 6)
Here I give you a snapshot of what will be coming:
Impulse 4 with sub impulses and corrections:
Impulse 5 with sub impulses and corrections:
Impulse 6 with sub impulses and corrections:
Here you can see the Days and % decline of each correction inside the impulses. Thanks for reading! I will be updating this soon.
Fractal

Market Structure: Basic TrendsHey! Hope you are well!
In this chart there is a display of a swing trend. In a downtrend, there is a characteristic lower low and lower high; however, the downtrend is not officially broken until the prior high is violated.
In this chart, there are three lower bottoms; the tops are confounded; the second top partially violates the first; then, the rest of the tops are in the range of the prior swing consummating with the large wick.
A similar micro example is found in this chart.
This is a five minute chart exemplifying the same characteristics.
Be well, and enjoy!
Suggested Reading:
Law of Vibration - Tony Plummer
Michael Jenkins - Geometry of Stock Market Profits, Chart Reading for Professional Traders, Complete Stock Market Forecasting Course
Scott M. Carney - The Harmonic Trader, Harmonic Trading Volume I, Harmonic Trading Volume II, Harmonic Trading Volume III
H.M. Gartley - Profits in the Stock Market
Bill Wiliams - Trading Chaos, New Trading Dimensions, Trading Chaos 2nd Edition
J.M. Hurst - The Profit Magic of Stock Transaction Timing, Cyclic Analysis: A Dynamic Approach
Fabio Dreste - Quantum Trading
Michael Jardine - New Frontiers in Fibonacci Trading
The Wave Principle, Nature's Law
Ralph Nelson Elliot
Technical Analysis of the Financial Markets
John J. Murphy
A Complete Guide to Volume Price Analysis
Anna Coulling
Mastering The Elliot Wave
Glenn Neely


🌊 ELLIOTT WAVES CHEAT SHEET 🌊10 Rules to 🏄♂️ them all! Hello, You may have never heard of Elliott Wave Theory before! Here is a cheat sheet for Elliott Waves for top 10 Rules, so you can master them all! print this out and keep on your desk.
How do you read Elliott waves?
The Elliott Wave Theory is interpreted as follows: Five waves move in the direction of the main trend, followed by three waves in a correction (totaling a 5-3 move). This 5-3 move then becomes two subdivisions of the next higher wave move (fractal).
The Elliott wave principle is a form of technical analysis that finance traders use to analyze financial market cycles and forecast market trends by identifying extremes in investor psychology, highs and lows in prices, and other collective factors. Ralph Nelson Elliott (1871–1948), a professional accountant, discovered the underlying social principles and developed the analytical tools in the 1930s. He proposed that market prices unfold in specific patterns, which practitioners today call Elliott waves , or simply waves. Elliott published his theory of market behavior in the book The Wave Principle in 1938, summarized it in a series of articles in Financial World magazine in 1939, and covered it most comprehensively in his final major work, Nature's Laws: The Secret of the Universe in 1946. Elliott stated that "because man is subject to rhythmical procedure, calculations having to do with his activities can be projected far into the future with a justification and certainty heretofore unattainable." The empirical validity of the Elliott wave principle remains the subject of debate.
OpenSea version in signature below

Trading Tip: Adjusted AxisStep 1: Find two swing pivots you would like to use
Step 2: Draw a parallel line along the axis of the pivot; draw a second line perpendicular to that axis of the pivot
Step 3: Done! Now you have an adjusted axis
What is an adjusted axis?
-
If looking at a coordinate plane, the normal axis goes perfectly vertical and horizontal at an offset of 0 degrees to the true zero point.
When looking at a coordinate plane, it may be noticed that sometimes the points on the plane do not follow the perfectly vertical and horizontal axis accurately; in such a case, creating an adjusted axis may shed some light.
-
In-exhaustive book list
Law of Vibration - Tony Plummer
Michael Jenkins - Geometry of Stock Market Profits, Chart Reading for Professional Traders, Complete Stock Market Forecasting Course
Scott M. Carney - The Harmonic Trader, Harmonic Trading Volume I, Harmonic Trading Volume II, Harmonic Trading Volume III
H.M. Gartley - Profits in the Stock Market
Bill Wiliams - Trading Chaos, New Trading Dimensions, Trading Chaos 2nd Edition
J.M. Hurst - The Profit Magic of Stock Transaction Timing, Cyclic Analysis: A Dynamic Approach
Disclaimer: Not financial advice, no recommendations to buy or sell, no warranties of merchantability, profitability, or probabilities.

Geometry: Angles, Cycles, and SymmetryThe harmonics of two are as such:
1, 2, 4, 8, 16, 32, 64
Cycles are merely sequences;
sequences can be arithmetic, geometry, or some other variation ( harmonic for example is 1/n).
is a sequence. If we are looking at the idea of cycles in terms of the time duration between highs, lows, highs to lows, or lows to highs, we could measure out the duration of a high to high using that as the base one unit.
is also a sequence; this is a geometric sequence with the factor being two; likewise as the above scenario, we could take the first measurement, and use it as a base unit.
Explore the different sequences, and explore the relationships of price and time: time from high to high; time from low to low; time from high to high to low to low to high; price from high to high; price from high to low; price from low to low.
Some sequences to start off are
1,2,3,5,8,13,21; n = (n-1) + (n-2)
1,1.414, 1.73, 2, 2.23; n = sqrt(n)
.236,.382,.618,1,1.618,2.618; n = 1.618n
In-exhaustive book list
Law of Vibration - Tony Plummer
Michael Jenkins - Geometry of Stock Market Profits, Chart Reading for Professional Traders, Complete Stock Market Forecasting Course
Scott M. Carney - The Harmonic Trader, Harmonic Trading Volume I, Harmonic Trading Volume II, Harmonic Trading Volume III
H.M. Gartley - Profits in the Stock Market
Bill Wiliams - Trading Chaos, New Trading Dimensions, Trading Chaos 2nd Edition
J.M. Hurst - The Profit Magic of Stock Transaction Timing, Cyclic Analysis: A Dynamic Approach
Disclaimer: Not financial advice, no warranties of merchantability, profitability, or probabilities.

Fractal example
its like extension of a simple base pattern spreadig by the rule of butterfly effects
with considering of crypto market atmosphere and 2 ex-waves "A" and "B", it would be easy to predict what's going to happen ...
zoom out to find out the orginal A ad B
you can read more about fractal and butterfly effect on my related tutorial

Supply and Demand - AUDJPYThis is a good example of the relationship between supply and demand, accumulation and distribution (see the 1m chart insert from Friday 17th September). Price is constantly fluxing between the two forces deciding who has control of the market. At the point where the recent high fails to break, this is a strong signal that sellers could be in control and shorts become the more likely play. Eventually we see that demand is over-powered and at that point, price gives way and bearish momentum kicks in.
Study price at the weekends when the market is closed and eventually you'll see this unfold live before your eyes

Smart Money CONCEPTS - Can you relate?Here is an overview of (to me) why support and resistance don't work (at a successful enough rate).
If you feel like this is the case be honest with yourself. And maybe try something new. please remember the 90 90 90 rule!!!
90% of traders
Lose 90% of their account
In the first 90days
Have a little think as to why?
For the majority of newbie traders that enter the market.. the first thing they are taught to understand?
Support and Resistance, Trendlines, Fibonacci (does work if used correctly)
So just be mindful of what the banks are doing and understand from their perspective that if they know the MAJORITY trade Support and Resistance... Don't you think they know where the majority of the people stop losses are going to be? ...
Any questions feel free to ask

Apple Market Cycle TOP!!My point of view for what it's worth..
--------------------------------------------------
TA= on the H1, H4, D at lower BB just holding on.
MACD= BEAR, worse on the weekly, daily.
Stoch= BEAR COSSED on the daily, about to on the Weekly.
BIG GAP AT 90$ needs to be filled. test lower weekly BB.
Market Cycle top in distribution phase. plateau
Logistic curve top.
do your on FA if you really don't understand.
I'll give you :
7nm(A13) EOL
CHIP SHORTAGE!!!
market saturation
dividend increases ..
just need the silver sparrow( unknown fundamentals) to really kick it off, but it will not take much now.
Adam

ETH weekly chart using silver ratio retracements & 0.4142Most of this is explaining why I like the silver ratio: 1+sqrt(2), or 1.4142. It may be a sort of analysis of ETH, but mostly I want to explain why I found the 0.4142 fib chart level so compelling as soon as I started using it (I tried several values and that one INSTANTLY had results, where all the others failed).
I was working on this when I saw the front page idea* with my fib chart retrace values! (note: i had to abandon my other account since this had my number attached so I could buy being able to look at two charts at once... x.x. so i am starting fresh, but I have been using sqrt(2) as a fib level since I was trying to figure out my own tweaks on the formulas. In fact, 1.4142 and 0.4142 are WEIRDLY good as fib levels. They are more accurate than 38.6. Because it's sqrt(2), it also fits nicely into the overall template of a fib chart that is mostly focused around ensuring the levels are being respected in general, so that once applied further, the same levels can be predicted in the same manner. I'm not being annoyed about that I would love to see 1.4142 used more often in fib charts; it's just a fantastic level. It's also related to a more complicated topic, enumerative combinatronics, which is quantifying possible patterns... which is perfect for pattern-heavy price action!
I initially was not very confident in TA. There are so many different techniques and it is very hard to figure out which are hopeful guesswork and which have an objective relation to the price. Learning incorrectly early on also harmed me, but it was an important lesson to learn. I am not a maths major so my explanations here are pretty minor.
www.youtube.com
Here's a numberphile video about the silver ratio.
sqrt(2) is a Pell number. More formally, {delta} = {delta}S = 1 + sqrt(2). I wish TV wouldn't get mad at me for using math symbols and think I'm not writing in English but okay tradingview.
If you were to replace the fib numbers and make a Pell chart instead, it would look like this:
nevermind I made it and it was terrible so I scrapped that idea. I will need to mess with the pell series more because that many irrational numbers (19601+13860sqrt(2) = 39201.99997... ok)
puu.sh Silver rectangle (as opposed to the so-called ~perfect~ Fibonacci ratio rectangles, I find this one to be more respectable!!)
I'm still pretty new and only have a few months with very scattered education regarding these topics so most of it ended up being pragmatically learned and backtested. It seems to work so well that I second guess myself so often I end up making bad trades while it just follows my prediction almost precisely. I just use the retracement because the actual uses are sorta irrelevant to me as long as the ratios and levels I want are on the chart in the way I want them to consistently be used for my own purposes.
What's that? I can toss this set of retracement levels and it just manages to fit better than the defaults with zero fitting required! usually
Indeed, 0.2 and 0.4142 were probably my favorite discoveries in January when I was experimenting with different mathematics. A runner up is 0.8, only because it usually nests the dip after the 1 (100% value) is reached. As a trading style, the point is to buy in either for a short term trade between 0 and 0.2 and then sell at the silver level (0.4142), or, anything below the silver level is a buy zone, and 0.618 would be the sell point if there is a "projected" chart, which I like doing. It is, and always will be, weirdly accurate in predicting reversals, but never when, only the price. When is the hard part to me.
puu.sh
example, this is my bitcoin chart from my prediction in march and then now. I was expecting this sort of move but getting it to the exact day and recognizing that last flash crash before it happened (because it was repeating a previous impulse, so is probably some fundamentals I don't know about, whether it's monthly miner sales or just... taxes or whatever).
So using presumptions of the asset's usual impulse distances (since, well, the same people are buying and selling, and unless the price changes significantly, the movement in prices tends to always be correlated to previous movements, with the exception of mean reversion inevitability if it's on a wrong side of an MA or vwap or something. Basically, trading probability and the averages. So far it was worked well as long as there is no flash power outage in China that messes everything up. But even then it seems to be priced into the chart levels.
My next study is to see if I can integrate Elliot wave theory and these levels into a combined impulse prediction tool that I can use for myself objectively so I can stay in a trade with more confidence. Mostly, I gotta stay off the 15m chart.. lol.
Likely fallacy pitfall explanations for the retracement fit:
1. seeing patterns where there are lots of possibilities for patterns to be formed; of course, everyone ends up ignoring the values that are not met or are blown past, since they fail to create any support or resistance. I like to use these levels that are previously unused to predict where a channel may form, because an unused channel is more appealing to price action than a used one, given the volatility a used one entails with so many orders and predictions being made for the same ones.
.4142 and .2 and .8 are all slightly off of the fib levels. They are just off enough that instead of being overlapped, they skirt the level. This looks and is a lot cleaner on the chart, but may well just be seeing what one wants to see in how important the levels are. This is why I chose to focus on the 0.4142 level so heavily. It falls just short of the halfway mark (a very important value in probability given it is the median of the range I am trying to predict), which more or less confirms a halfway point. If the trend is very bullish, you can use the 0.4142 level as the guideline to try and predict where the 1 value will end up in the future.
I spent some time adding some more predictions and using those levels as examples of their utility in future price projection, as well as how well it can backtest.
Here is a step-by-step in how I do this for a quick guesstimate of bullish impulse prices that I find a bit more adaptable than simply the golden ratio fetish, and unsurprisingly, other such irrational numbers work well when used for different purposes.
BTC
s3.tradingview.com 1
s3.tradingview.com 2
s3.tradingview.com 3
AAPL:
s3.tradingview.com ~base
~adjusted
~result
The final thing I have to say and want to express is that it's fantastic to learn how all these things work in the book, but the book doesn't matter if you don't have your own understanding and conceptual view of the technique you or I am using. Most of all, it should make sense to you, even if it doesn't make sense to anyone else. I've come to appreciate that with charting and the great variety of ideas and methods used by everyone, closer or further from the standard. It's worth noting the standards didn't have a high success rate anyway when tested in a vacuum; but this methodology is less for efficient autotrading, and more for having a plan and reasons for entering or exiting trades at certain points.
The most important element of charting, that I've come to identify, is that it cements the plan into a reference work that when changed becomes useless, so the plan must be stuck to unless price itself defies expectations beyond parameters.
Thank you! I'm happy to be able to shove this all in an article finally and sort of start to work out my ideas, as I have very little concrete documentation on it yet, as frankly it's still in the growing pains stages as I am but a bab in TA.
Sofie
*https://www.tradingview.com/chart/AMC/zjtSxXED-Using-the-Trend-Based-Fib-Extension-Tool/
My examples focus on an uptrend.


Fractals (Part 3 of 3/Definition & How To Use)Fractals Definition:
A Fractal is a graphical figure of technical analysis which is usually used by traders to find the most appropriate entry and exit point on the market. To make more accurate decisions, a fractal is used mostly in conjunction with other indicators and methods of technical analysis since it is seen as a lagging indicator. A fractal is made up of five candles, the average of which indicates either the maximum or minimum price in the time period.
As a rule of thumb, about 75-80% of the time, the foreign exchange market is in a state of consolidation. Only 20% of the time the price moves significantly in what could be considered a trending direction. How to determine the limits of consolidation and moments when the price moves from consolidation stage to trend stage? The fractal indicator can help you with this – one of five unique technical indicators of Bill Williams, that are rightfully revolutionary in the field of online trading and technical analysis. A description related to the specifics of the operation of the Fractals indicator can be found within this article.
Fractal indicator determines for us nothing more than local low and high, breakdowns of which are usually associated with local changes in trends, and it works without repainting. The fractal signal about formation of a new local low or high on the chart is two candles late. Since, according to the calculation formula of this technical indicator, to determine the highest of the five candles, the indicator analyzes the mutual construction of the first two, mid, and the last two candles. If middle candle is higher than four candles in this row, the fractal indicator “draws” an up arrow above it. If the middle candle is lower than the other four, a down arrow appears under it. When the fractal arrow appears above or below the candles, it is most likely too late to enter these signals, since price may have already moved far away from optimal level to enter the market. fractal indicators to determine the possible direction of price.
How to use fractals in Forex
Fractal links of exchange prices and the repeating structures have been confirmed by the results of computer modeling. The fractal (fr om Latin fractus) means a steady scalable design of irregular shape emerging on any data. The trade fractal in the financial market is the candle pattern formed by at least 5 (or more) candles, max/min of the central candle of which exceeds the extremes of the neighboring candles. Emergence of fractals means the beginning of a new price pyramid and is considered as a trading signal.
*Note: Look for trades with the five Forex energies aligned up with trade you want to take which are: trend, momentum, fractal, liquidity & volume.

Fractals (Part 2 of 3/Buying)Example of a buy fractal on Gbp/Nzd 15 minute:
Rules:
1) Enter after candlestick #5
2) Put stop below candlestick #3
3) Set exit or target of at least two times risk/reward. This example is 1:2 on chart.
Fractals can happen on any charts, if you scalp or day trade use them on 15 minute or 1 hour charts and maybe 4 hour charts might work.
What is the fractal analysis and what’s its value?
The aim of such analysis is «to notice» in time and correctly to treat fractal designs in conjunction with other market data regardless of whether they are fundamental and technical, volume and temporary. The set of the real fractals is very dynamic. It can vary depending on quantity and structure. For instance, emergence of max/min for a fractal need not be consecutive. The main thing is that one of the central bars has to show an obvious extreme. Therefore, non-standard combinations can also be used as fractals:
Remember that the best forex trades happen when the five energies are in alignment with trade: these are momentum, trend, fractal, volume and liquidity.
This is the main reason to trade during the time in between London open to London close- this is where the five energies are easily found to trade.
Good luck!!!

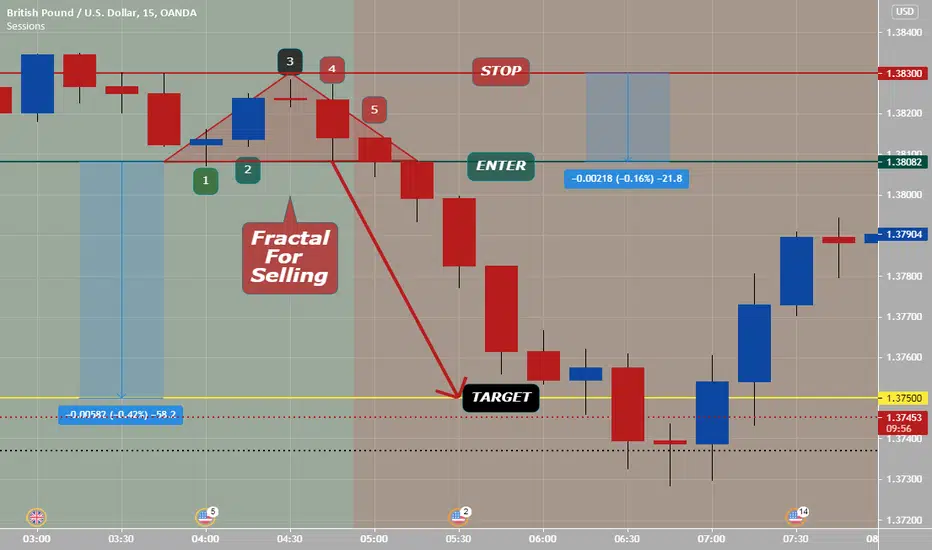
Fractals (Part 1 of 3/Selling)Trading with fractals is extensively used by the large market players and it is the best indicator of the fractals’ reliability. The combinations of fractals have such characteristics as self-similarity, scaling and memory of the «entry conditions», and, therefore, they can be used successfully for making price forecasts.
How to use fractals in Forex
Fractal links of exchange prices and the repeating structures have been confirmed by the results of computer modeling.
The fractal (fr om Latin fractus) means a steady scalable design of irregular shape emerging on any data. The trade fractal in the financial market is the candle pattern formed by at least 5 (or more) candles, max/min of the central candle of which exceeds the extremes of the neighboring candles.
Emergence of fractals means the beginning of a new price pyramid and is considered as a trading signal.
A fractal down (or a signal for position to sell) is reverse pattern made up by five (or more) consecutive candles.
Rules of a sell fractal setup:
1) Place stop above middle candlestick or #3
2) Place enter order at close of candlestick #5
3) Place target order at exit that is at your risk management level and strategy
4) Does sell fractal happen at a high volume and liquidity time? Chart is end of London and start of NY session, so YES.
* On Gbp/Usd noted 15 minute chart, there is a 1:3 risk reward set up. This trade had all five energies: momentum, trend, fractal, liquidity and volume
If any trade set up has all five energies- that is a great trade to take with a high win rate %. good luck and good trading.
This wave pattern is very close to reality, Here you can see how an extended flat elliot wave should be counted.
However there are multiple counts possible on current date,
Using different geometric tools and projections, we can pretty determine accuratly where the price currently is behaving.
Therefore I'm expecting at this moment a new wave up, which can be pretty str8 forward, since it is an ABC counting 2 impulse waves.
every A and C wave can be impulse or diagonal. So this complex corrective wave will not be easy for many traders to trade.
Here are some guidelines to help you identify the right trading spot for trading.
There are multiple tools to calculate the these elliot wave turning points on the forecast. It is not hard, however some studies you need to know on counting elliot wave and its fibonacci sequence correlation!
Try to avoid the B waves for trading,
Only trade the A and C wave, it is easier to do so in the bigger impulse 3 wave.
Fib sequences, Since it looks like this corrective C wave, is an diagonal.. We expect wave 5 to be projected around 44-46k. However, it really depends on the stretch of current A B C wave in wave 2.
once we completed this up leg. prepare for shorts, Ofcourse the C wave currently is an bearisch trend. So make sure you only trade the short moves, not the longs.
Only if you know how to calculate turning points within these trend, it is possible to benefit from it, as you can pretty accuratly predit where the price reversal zones exists.
I wish you all the best in Trading.
Please Share and like!

Trading Channel Fake-outs and Multi-Time Frame Analysis In this video I go over how to trade with channels and multi-time frame analsys for the best entries. I also show my way of trading fake outs on channels and building a logical and rational case for entering markets with confluence.

A Practical Guide to High Risk/Reward Trading in Forex. This will show my methodology and system for getting high risk to reward trading setups using whatever analysis that you choose that doesn't involve indiaotrs. Wyckoff, Smart Money Concepts, Price Action. But primarily this calls for an understanding of market structure.

BTC Parabolic Moves Left BTC Q2 2019 - Right BTC Q4 2020
Bitcoin almost always ends it's moves in a parabolic fashion
With $36.000 as a key strike for Derbit options we may have a powerful gamma squeeze in the making
Don't FOMO the top, every parabolic move is followed by a correction

x10 again anyone?No point waiting for some. Will that LO hold? Also is x 10 random coincidence?
NOT ADVICE DYOR

ENCOURAGING NEWS - Black Spinning TopNOT ADVICE. DYOR.
Enjoy!
View all past occurrences here ( 8 Gorgeous Charts):

Only 5 Set-ups like this mon-shot since 2012 - How to trade ?All Charts To Same Scale For Comparison.
See Can Spot A better Way To Trade It
NOT ADVICE. DYOR

Efficient vs Inefficient Price ActionWhatsup traders! In this video I will be talking about the difference between efficient and inefficient price action. Once you understand this concept, you can incorporate it into your trading and utilize it to find targets and setups!
