J-DXY

Bitcoin to the MooooooooooooooooooooooooooooooooooooooooooooooonWill Parabolic SAR pattern repeat. NOT ADVICE. DYOR.

How to compare various instruments in one chartIt is good idea to compare instruments to get a deeper insight into potential big moves. In this 3 min tutorial I show how to create four scales on the right of the chart for four instruments.
To add instruments you use the compare button.
Then us a drop down arrow on the instrument at top left to find Pin to scale.

Bitcoin Gold SPX DAX NI225 SHCOMP What's Cooking ?DXY Down (Good) TNX Up (Good) IRAN Not Suicidal (Good) USA No Fat Finger Missiles (Good)


DXY study using ParabolicSAR can make trading the SPX look easyDXY study using Parabolic SAR can make trading the SPX (S&P 500) look easy NOT ADVICE DYOR

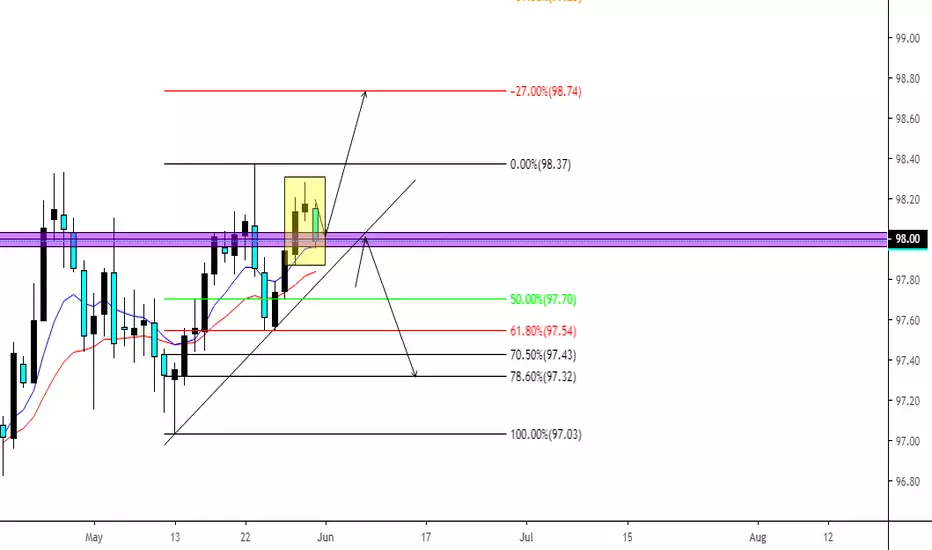
DXY (US DOLLAR INDEX) LONG BIASIf Dollar Index Weakens XXX/USD goes up. If Dollar Index Strengthens XXX/USD does down.
Looking at DXY I can see a Reversal Pattern form inside the box with a Pin Bar, Doji and what looks to be a Bearish Engulfing Candle. However, the market is uptrending & this could easily be a retest on 98.00 for a continuation upwards to fulfill the -0.27% extension.
Plan A:
We have got a fair bit of USD news coming out in 5 hours following this week will be NFP and Client Sentiments show that the vast majority of Retail-Traders are Shorting the USD and Longing XXX/USD, So I choose to observe the masses and do the opposite which is have a long Bias on USD...Also I dislike going against the trend of the market;)
Plan B:
I will not be looking to Short the USD unless there is a clear break of the Counter-Trend line.
Targets at -0.27%
Noob Lectures: stores of value & safe havensNoob Lectures
Lectures for noobs by noobs!
Old Chart with Bitcoin & Dollar Index comparison

DXY - Daily - Multi-Timeframe Analysis Series 1The DXY being weighted as follows:
EUR - 57.6%
JPY - 13.6 %
GBP - 11.9%
CAD - 9.1%
SEK - 4.2%
CHF - 3.6%
As you may imagine, there's a lot more interest in using the DXY for a correlation / confluence tool when trading the EURUSD . The EURO equates to over half of the overall weight of the index, meaning there's a majority interest in the EUR vs USD.
We can use this to our advantage, alongside the USDOLLAR INDEX, to add positive or negative trade factors when considering positions across USD pairs and commodities .
Comments
I've let the Daily remain zoomed out to show the potential for a consolidation formation. It looks closer matched to an Ascending Triangle (potential to break to the upside or downside) rather than a Rising Wedge (strictly reversal pattern).
If the Monthly is looking prime for a sell-off, I must favour the Ascending Triangle breaking to the downside. Only time will tell, but I won't be counting on massive Dollar Strength beyond 97.50 unless we see a big Weekly close above this key level.
Unless this starts to break down below the 96.00 handle, it's still bullish for me moving into next week.
Key Note
Look at how price isn't respecting the EMA's as well as it has done in the past. This is an indication of consolidation occurring on this timeframe.

DXY - Weekly - Multi-Timeframe Analysis Series 1Continuing with another episode of Multi-Timeframe Analysis Series 1, I'd like to break down the DXY.
The DXY being weighted as follows:
EUR - 57.6%
JPY - 13.6 %
GBP - 11.9%
CAD - 9.1%
SEK - 4.2%
CHF - 3.6%
As you may imagine, there's a lot more interest in using the DXY for a correlation / confluence tool when trading the EURUSD. The EURO equates to over half of the overall weight of the index, meaning there's a majority interest in the EUR vs USD.
We can use this to our advantage, alongside the USDOLLAR INDEX, to add positive or negative trade factors when considering positions across USD pairs and commodities.
Comments
Looking at the Weekly timeframe gives us a different picture to that on the Monthly. We a low-test candle printing into the 20/50 EMA wave, this indicates a possible continuation to the near-term levels of 97.40 region. If we did see this push to the upside, it's change the formation on the current Monthly candle (and potentially the overall outlook shared within the Monthly breakdown). Thinking in terms of the longer time horizon, if we see a break of 97.80 I think it's possible to reach the realms of 100.
Key Note
The Weekly and Monthly are conflicting, which can often be a sign of the overall bias changing from beneath the surface. The smaller timeframes turn quicker, and when they align, this can change the direction gradually on the higher timeframes.

DXY - Monthly - Multi-Timeframe Analysis Series 1Continuing with another episode of Multi-Timeframe Analysis Series 1, I'd like to break down the DXY.
The DXY being weighted as follows:
EUR - 57.6%
JPY - 13.6 %
GBP - 11.9%
CAD - 9.1%
SEK - 4.2%
CHF - 3.6%
As you may imagine, there's a lot more interest in using the DXY for a correlation / confluence tool when trading the EURUSD. The EURO equates to over half of the overall weight of the index, meaning there's a majority interest in the EUR vs USD.
We can use this to our advantage, alongside the USDOLLAR INDEX, to add positive or negative trade factors when considering positions across USD pairs and commodities.
Comments
Looking at the Monthly timeframe we appear to be stalling between the 61.8% retracement of A>B as indicated on the chart. Price is showing high test candles at this level, as well as a potential rolling double top (continuation formation). Given the circumstances of this in its current form, 94.00 could easily be on the cards as we move into the second quarter of 2019.
Key Note
At time of writing this, it's the current monthly candle cannot be considered an indication of direction just yet as it hasn't fully formed (being the 24th of the month).

DXY Self Analysis Price Insights from Technical Point of ViewDaily candlestick failed to break and close above previous 3-months high. Daily bullish candle close around 97.5 price area may lead the price to go low around 96.75 price area and previous daily low during NFP later this night.
Analysis solely based on technical, no fundamental involved.


DXY - 8/2/19The Dollar Index has broken and retested the trendline, I would like to see it weaken. Meaning XXXUSD pairs will buy and USDXXX pairs will sell.

Dollar Index (DXY). Global strength of USD could be underwayDXY couldn't break below former valley of 95.03 and now we are heading to break the former top above 96.68.
This could make valid the unfolding of 5 waves up in larger wave (5) (green) to touch the big top of 103.82.
On a bigger time frames (see related) we can go even higher.

Atomic #79. Let's go on a journey...It was the summer of 1997 in Des Moines, Iowa (my old hometown). Des Moines is a smaller city in the center of Iowa surrounded by corn fields, barns, cows, horses, pigs and baseball fields. Life was good and simple. I was 16 years old. AOL dial up was around for a few years and all you could really do was email, which was too slow and cumbersome at the time. I drove a 1980 4-door Honda Accord pushing 95 horse power that was in flawless condition with automatic windows, air-conditioning and an 8 track CD changer. It was a real panty dropper. It was the year I had my first taste of alcohol and hated it. I had my first kiss and loved that. It was the year I fell in love and then fell out. I was a successful track and field athlete at the state and national level. Most households still had multiple landlines. There was usually a common phone in the house and then my sister and parents had their own lines in their bedrooms. My friends and I would spy on my sister's phone conversations by finding an open phone in the house and ever so carefully lifting it off the jack. The key word here is carefully you see so that the person on the phone thought they were having a private conversation. If you lifted too quickly it would make a clicking noise and then.... busted!!! There was no such thing as speaker phone so you'd need to do a football huddle to hear what was being said. We still had huge phone books that would be delivered every year and yes, people actually used them. This was our version of Google at the time. I wasn't a huge gamer, but I still had my original Nintendo with Mike Tyson Punch Out, Contra and etc. High Definition didn't exist so people still looked good without make up on television. I was a huge Chicago Bulls fan and Michael Jordan, Scottie Pippen, Phil Jackson, Dennis Rodman, etc. was around. I believe this is the year they were going for their 5th NBA Championship. We had a computer in our house, but it was more like one of those bulky old television sets that came with a keyboard and mouse. I would use it to type my book reports for school, print it off and that's all it was useful for. Essentially an upgraded typewriter. I still remember the weird noise it would make when I would have to save a document to a floppy disk and the process took several minutes. Yes - for a 10-page report.
Gold's element symbol is Au and atomic number 79. These were my atomic #79 moments growing up as a kid. Life was simple. No Wi-Fi. No Facebook, Instagram or Twitter. No real worries about privacy because big data wasn't really a thing back then. Life for me was about being in nature, running, hanging out with friends and pondering what we wanted to be when we grew up. You never know you’re living in a golden moment until you’re not. I’m grateful for the life I have right now, but there is a side of me that longs to be naïve again. To think the world is a good place. People are good. Governments are good. Old people (in their 30’s) who actually have jobs are smart and inspired about what they do. You can be anything and everything you want to be in life if you just work hard enough. To drive a 1980 Honda Accord and still have girls look at you. That's Atomic #79 bro.
Gold is forged from the greatest energy events in the universe. Supernovas, the death event of a collapsing star, where the energy explosion is so powerful that our scientific instruments can detect these gravitational waves billions of light years away. It is thought earth obtained most of its elements from these supernova events during its formation 4 Billion years ago. The amount of Gold that has ever been mined in the history of mankind could fit in an Olympic size swimming pool. People who say Gold is just a shiny piece of metal that only has value because we HUMANS say it has value. How arrogant and narrow minded can we be? Gold has a power that is unlike any other material. It has a certain energy about it. If you’ve ever held a gold bar of material size and weight you’ll quickly realize you aren’t dealing with anything normal. You feel it’s intrinsic value. There’s a particular respect between your human senses and that of the gold you are handling. Almost like we're intertwined with it on some molecular way. The ancient people felt the power of gold way before advanced technology.
The US Dollar has the world’s respect as it’s the global reserve currency. Many assets and commodities are priced in USD worldwide. But it’s the making of mankind with a century old history. We print as much or as little as we want to “control” the markets greed and fear. Gold is literally the making of the universe with a 14-Billion-year-old history. The value of a $20 million-dollar Picasso painting isn’t just wrapped into the art piece you are buying. When you buy a Picasso, you’re buying into the history of Picasso. You’re buying into his legacy, his personal faults and his triumphs of what made him a creative genius. But like the US Dollar it can disappear. Gold will never disappear. It can't be destroyed.
Gold will always have power over Bitcoin because of this history. Cryptography and math were invented by man. Not by the Gods. Bitcoin or something like Bitcoin is better money. Math is more objective while man is more emotional. But money is just a unit of value created by man. But like Bitcoin if you don’t actually possess the gold…you don’t really own Gold. You own the idea of Gold via a certificate or ETF. That is a huge difference.
When you look back on the life you lived, the chances you didn’t take, the wins, the losses, the regrets you’ll quickly realize one thing. All we are and ever will be is history. Our intrinsic value comes from the history we create. The blockchain is the first time in HUMAN history we can say the Truth is the absolute Truth. That’s an undeniable fact. However, Gold has never had this problem. Its history goes back to the beginning of time. When the first star died billions upon billions of years ago and spewed its guts to create an element that gave us our first and original blockchain.
So, when you consider the trading chart above remember it’s mankind’s Greed and Fear that creates this inverse relationship between Gold and the US Dollar. If you’re a crypto-maniac like me you’ll realize gold is the longest immutable and censorship resistant blockchain created, not Bitcoin. But it goes beyond any doubt technically or fundamentally that both blockchains are way undervalued! We have for the first time an invention by man that can record history as absolute truth. And when you think of our lives or mankind's lives, it's this truth in history that we all every value and fight for.
If you're a speculator be patient and wait for interesting prices. When thinking about going into a trade calculate first how much money you could lose vs. make.
Best Regards,
Bobby
-Don't hate the hair, hate the game.

US Dollar: Mind the scallopsScallops are broad patterns as shown in the chart. Whilst de-dollarisation is happening at a slow macroeconomic pace, coming from Russia, China and Japan (largely), it doesn't mean that the US Dollar will simply roll over.
The pattern of the scallops is quite visible. Now the US-Dollar is at a critical point and making attempts to do another scallop. I don't assume that each scallop will be less prominent than the previous. Overall the trend from April 2018 seems to be weakening but I make no assumptions that in the short term (next few weeks) the US-Dollar will not bounce north.
US-Dollar strength is broadly inversely correlated with commodities, metals and US-stock-markets - whilst affecting the strength of other currencies indirectly.
The pattern is useful in terms of assessing other positions in the markets both on Stock Markets and Forex.

[DXY] Correlation with other pairsHi guys !
This is an other simple chart to explain the correlation between DXY and other pairs. As you know, the best exemple is with EURUSD. When EURUSD goes up, DXY goes down, and when DXY goes up, EURUSD goes down. This is because in the DXY (Dollar Index), there is more than 50 % EURUSD.
The U.S. Dollar Index is calculated with this formula:
USDX = 50.14348112 × EURUSD ^(-0.576) × USDJPY ^(0.136) × GBPUSD ^(-0.119) × USDCAD ^(0.091) × USDSEK ^(0.042) × USDCHF ^(0.036)
Thanks for your time guys !

[DXY] How to use Fibonacci IndicatorHi guys !
This a simple chart with a explicit Fibonacci Indicator. Many people asking me how to use it, it's easy, have a look.
Story : Fibonacci was an Italian mathematician (1175 - 1250). He discovered this number sequence like this: Each numbers is calculated by adding the two previous numbers, for exemple : 1, 1, 2, 3, 5, 8, 13, 21, 34, 55, 89...
The special thing in this sequence is that every numbers is 1.618 of previous and 0,618 of next one. And as you know, 1,618 is the "Gold number" .
(Hope my english is not too bad haha)
1 - Choose a higher and lower price (downtrend) or lower and higher price (uptrend)
2 - Fibonacci will retrace different line at 23.6, 38.2, 50, 61.8, 78.6 and 100 %
3 - Theses line will be the next supports / resistances in the correction / bounce
You can use it to place the best order (BUY or SELL) and make more profit.
Ask me for any questions !
Thanks for your time.

DXY EDUCATIONKey support @89.29 with the break off the bottom of the flag can have a high possibility of the reversal to the bull markets.
If you re looking for more confirmation wait for the break of the resistance level.
Key resistance is @90.98 witch is where back in September of 2017 the low was at.
***THIS IS AN EDUCATIONAL POST***

RV Simplifed - Krümel’s VoodooRV Simplified:
I get this question all the time, and even though the concept is simple, many people have a hard time getting their heads around it.
Here is snapshot of above at time of publish. Sept 19, 2018, 7:30am ET.
As the above LIVE chart will not last more than a day.. accurately.
——————-
Q- When DXY falls, WTI follows right?
A- No.. they fall and rise at different rates, on some Timeframes they will be inverted (say 10min) while on 4hr they will both trend in same direction.
I look at the value of oil in Dollar , as well as other currencies. But oil is priced in dollars.. so it will always gravitate to that level. This is based on the amount of volumes being traded in other currencies. (I believe) .
Q- So having a weaker pound, yen and eur will equate to oil price going up as we get more dollars? right?
A- Sure.. and vice verse..
Let’s say nobody trades oil for 1 hr. But during that time the Doller dropped by 10%! Those wanting to buy oil from you in EUR, would need to pay 10% more to keep you even, or you would need to sell at 10% loss. BUT -If I’m buying from you and in dollar. Price doesn’t change as we are both using dollars. - Extreme example.
So the price of oil is based on what buyer is willing to pay.. if those in U.K. (above example) are willing to pay the 10%, but most of the buyers are in US. The price will only go up buy the amount of volume those U.K. buyers represent.
Now do that for EUR, YEN, GBP, and Doller.. that’s RV!
Lastly - I treat SPX like a currency (normalized to dollar) SPX is a great scale on daily movement. Not always coupled but use 2 day range to set scale. I think this has to do with the ETFs and truly they are the volume in PaperOil.

A Lesson On Reading Risk Profiles (Must Watch)In the following video, Ivan Delgado, Head of Market Research at Global Prime, walks us through the different scenarios that can exist when trading risk.
Ivan simplifies the reading of the environment as a trader one can encounter by combining the price behavior of the SP500, US 30-yr bond yield, US Dollar index, and to a lesser extent, Gold, as it's become more a function of DXY performance.
A must watch for all forex traders, especially those trading risk-sensitive crosses such as JPY, CHF.

DXY (Neutral) - - Wednesday FOMC mtg min releaseWhats up Guys -
See explanation on the chart -
We are going to be looking for opportunities (today and tomorrow) to be preapred to both Long or Short the USD based on the release of the minutes. This post is mostly to give an idea of the thinking that I go through as an active trader.
Ten Likes / Comments / Dislikes and I will update the chart
Let me know how you feel
Intelligent disagreement is always welcome
Good Luck - See you on the trading floors
#Crypto #BTC #cryptocurrency #forex #DXY #usd
-Nix
