NDOG & NWOG Indicatorndicator automatically identifies and displays New Day Opening Gaps (NDOG) and New Week Opening Gaps (NWOG) directly on your chart. It focuses on gaps based on specific session times in the New York (NY) timezone.
Key Features:
NDOG: Identifies the gap between the NY 4:59 PM (daily close) and the NY 6:00 PM (daily open).
NWOG: Identifies the gap between the Friday NY 4:59 PM (weekly close) and the Sunday NY 6:00 PM (weekly open).
Draws customizable lines for the high and low levels of each gap.
Option to show an additional mid-level line for each gap.
Includes options for line colors, styles, and width.
Allows filtering gaps by a minimum size.
Control the maximum number of recent NDOGs and NWOGs displayed.
Optionally shows text labels on the lines and a summary table on the chart.
This tool can help traders visualize potential areas of interest related to these specific opening gaps.
Note: Calculations are based on the "America/New_York" timezone.
Disclaimer: Trading involves risk and may not be suitable for all investors. This indicator is provided for informational and educational purposes only and does not constitute financial advice or a recommendation to trade. Use at your own risk.
Candlestick analysis

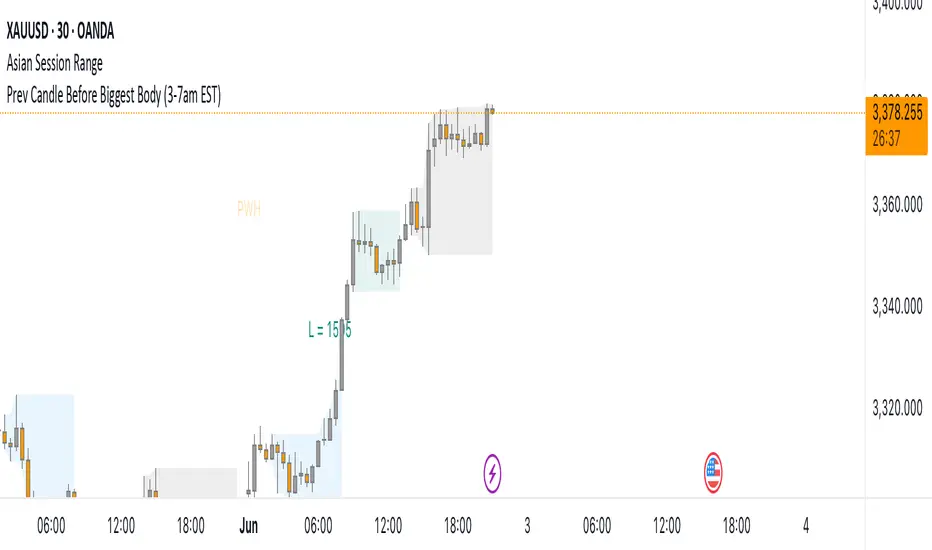
Prev Candle Before Biggest Body (3-7am EST)This indicator automatically identifies and marks, for each trading day, the candle immediately preceding the largest open-to-close movement (in pips) during the key London session window from 3:00am to 7:00am EST (New York time). The largest candle is determined by the absolute difference between its open and close prices, measured in pips. The candle just before this “biggest” move is highlighted with a distinctive pink flag above the bar. This tool is especially useful for traders seeking to analyze pre-breakout price action or to identify key levels and setups that occur right before significant volatility during the early London session.
3 Bar Reversal3 Bar Reversal
This pattern is described in John Carter's "Mastering the Trade"
The 3 Bar Reversal indicator is a simple but effective price action tool designed to highlight potential short-term reversals in market direction. It monitors consecutive bar behavior and identifies turning points based on a three-bar pattern. This tool can assist traders in spotting trend exhaustion or early signs of a reversal, particularly in scalping or short-term trading strategies.
How It Works
This indicator analyzes the relationship between consecutive bar closes:
It counts how many bars have passed since the price closed higher than the previous close (barssince(close >= close )) — referred to as an "up streak".
It also counts how many bars have passed since the price closed lower than the previous close (barssince(close <= close )) — known as a "down streak".
A reversal condition is met when:
There have been exactly 3 bars in a row moving in one direction (up or down), and
The 4th bar closes in the opposite direction.
When this condition is detected, the script performs two actions:
Plots a triangle on the chart to signal the potential reversal:
A green triangle below the bar for a possible long (buy) opportunity.
A red triangle above the bar for a possible short (sell) opportunity.
Triggers an alert condition so users can set notifications for when a reversal is detected.
Interpretation
Long Signal: The market has printed 3 consecutive lower closes, followed by a higher close — suggesting bullish momentum may be emerging.
Short Signal: The market has printed 3 consecutive higher closes, followed by a lower close — indicating possible bearish momentum.
These patterns are common in market retracements and can act as confirmation signals when used with other indicators such as RSI, MACD, support/resistance, or volume analysis.
Usage Examples
Scalping: Use the reversal signal to quickly enter short-term trades after a short-term exhaustion move.
Swing Trading: Combine this with trend indicators (e.g., moving averages) to time pullbacks within larger trends.
Confirmation Tool: Use this indicator alongside candlestick patterns or support/resistance zones to validate entry or exit points.
Alert Setup: Enable alerts based on the built-in alertcondition to receive instant notifications for potential trade setups.
Limitations
The 3-bar reversal logic does not guarantee a trend change; it signals potential reversals, which may need confirmation.
Best used in conjunction with broader context such as trend direction, market structure, or other technical indicators.

VIDYA (Chande)This script brings you VIDYA – the Variable Index Dynamic Average, developed by Tushar Chande. It’s not your typical moving average. Unlike the standard SMA or EMA, VIDYA adapts its speed and smoothness based on real-time market momentum using the Chande Momentum Oscillator (CMO).
Think of it like a moving average that gets faster during strong trends and slows down during sideways or choppy markets — just like how a smart trader would!
🧠 What Makes VIDYA Different?
Traditional moving averages use fixed smoothing, so they lag more during big moves or chop during weak trends.
VIDYA fixes that by adapting its behavior dynamically:
When momentum is strong → VIDYA reacts faster 🚀
When momentum is weak → VIDYA smooths out the noise 🧘
⚙️ How It Works (Explained Simply):
1️⃣ CMO Calculation (Chande Momentum Oscillator):
We look at the past cmoLength candles (default 9) and:
i) Add up all the positive price changes (gains)
ii) Add up all the negative price changes (losses)
iii) Use those to compute a normalized momentum score between -100 and +100
📌 CMO = (Gains - Losses) / (Gains + Losses)
• This gives us a momentum reading that powers the next step.
2️⃣ Dynamic Alpha Smoothing:
• We convert the absolute value of the CMO into an alpha — this is the "speed" of the VIDYA.
📌 Higher momentum = higher alpha → faster response
📌 Lower momentum = lower alpha → smoother behavior
3️⃣ VIDYA Formula:
• Finally, we apply the smoothing:
📌 VIDYA = α × Price + (1 - α) × Previous VIDYA
• This equation continuously adapts to market behavior — trending or ranging.
📊 What’s Plotted?
🟠 The VIDYA Line:
A smooth, responsive line plotted on your price chart that adjusts in real-time with price momentum.
🔎 How to Use It:
✅ Use it like a moving average, but smarter:
• Price > VIDYA and rising → Trend is likely up
• Price < VIDYA and falling → Trend is likely down
• Flat VIDYA = Possible consolidation or sideways market
✅ Combine with:
• Breakout strategies (VIDYA confirms momentum)
• Reversal entries (look for price crossing VIDYA)
• Volatility filters (ignore signals when VIDYA flattens)
🧪 Bonus Tip:
Pair this with a volume indicator (like my Volume Confirmation Bars or Volume Strength Highlight) to confirm whether momentum is backed by real participation or just a fakeout.
📩 Want alerts, dual-timeframe overlays, or VIDYA with other base inputs (like typical price or HLC3)? Let me know — happy to expand this for your setup!
Stay adaptive, not reactive — trade smarter with VIDYA! 🧠📉📈

Volume Strength HighlightThis simple script helps you quickly see when volume is strong or weak on the chart — it highlights the candles based on how the current volume compares to the recent average 📊
🔍 Here's what it does:
Calculates a 20-bar average volume
Marks candles green or red if volume is much higher than average (more than 1.5x)
Marks candles gray if volume is very low (less than 0.5x the average)
Normal candles stay unchanged
You can also turn on a basic volume plot in a separate panel if you want to compare visually (just toggle it in settings).
⚠️ It’s not a buy/sell signal — just a helper to see when the market is waking up or going quiet.
Not perfect but works well with other indicators! Let me know if you like it or have ideas to add more 💡

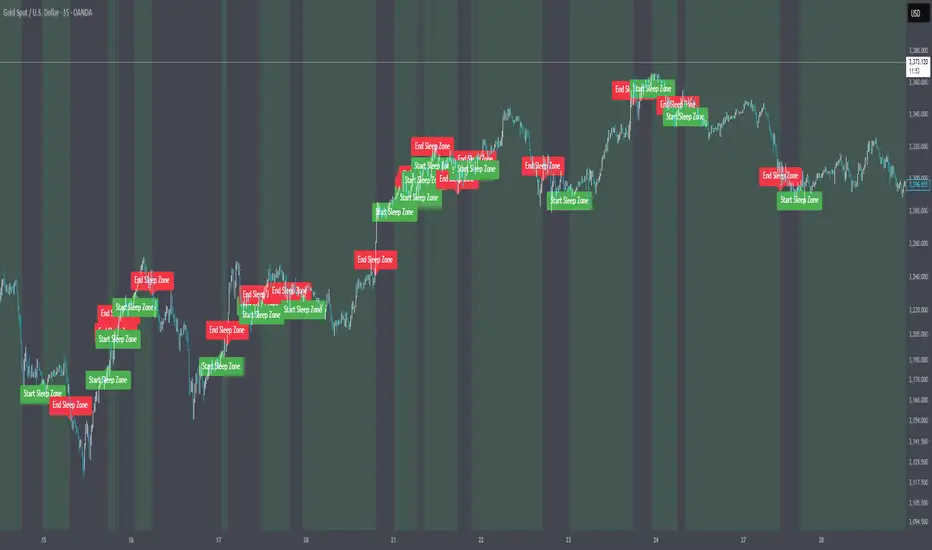
Market Sleep ZonesHey traders 👋
This script shows when the market is in a "sleeping" or low volatility phase. I call it Market Sleep Zones 😴
It looks at the average price movement over a window (default 20 bars), and if the price changes are small (under a % threshold you set), it highlights that area on the chart with a soft green background.
💡 This can help spot moments when the market is quiet — maybe before a breakout or just moving sideways.
It also places labels to mark where these zones start and end, so it's easy to track.
You can change:
The window size (how many bars to look back)
The breath depth (how much price is allowed to move before it’s "not sleeping" anymore)
Not perfect, but helpful if you want to avoid getting chopped in low-volatility zones or want to prepare for when the market "wakes up" 😄
Let me know if you find it useful or have ideas to improve it!
ATR Display ShorcutATR Value Display - On-Chart Volatility Monitor
Clean ATR display directly on your price chart - no extra panels needed!
This indicator displays the current Average True Range (ATR) value as a clean table overlay on your price chart, eliminating the need for a separate indicator panel below your main chart.
✨ Key Features:
On-chart display: ATR value shown directly on price chart
Customizable positioning: Choose from 4 corner positions
Clean design: Minimal, non-intrusive table format
Real-time updates: Always shows the latest ATR value
Adjustable period: Default 14-period, fully customizable
🎯 Perfect For:
Position sizing calculations
Stop-loss placement (1x, 1.5x, 2x ATR)
Volatility assessment at a glance
Clean chart setups without extra panels
Quick reference during live trading
📊 How to Use:
Add to chart
Select your preferred table position
Adjust ATR period if needed (default: 14)
The current ATR value displays automatically
💡 Pro Tip:
Use this ATR value to:
Set stop-losses at 1.5x or 2x ATR distance
Determine position size based on account risk
Compare current volatility to historical levels
Clean charts, clear data, better trading decisions.
Compatible with all timeframes and instruments. Pine Script v6.
Feel free to adjust this description to match your style or add any specific features you want to highlight!

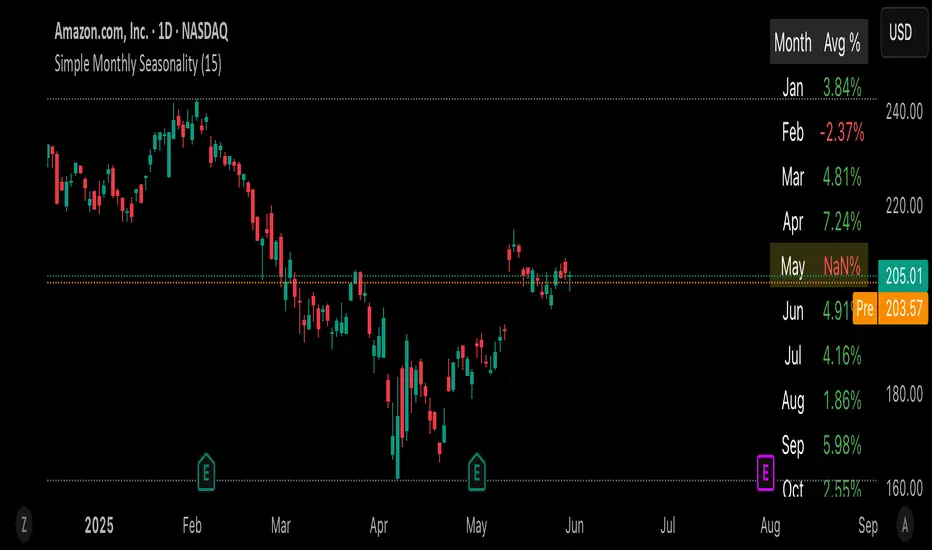
Simple Monthly SeasonalityThis script helps traders quickly visualize how an asset performs month by month over a customizable historical period.
🔍 What it does:
• Calculates average monthly returns over the past N years (default: 15).
• Highlights the current month for quick context.
• Displays results in a clean 2-column table (Month | Avg % Return).
💡 Features:
• Works on any timeframe – internally pulls monthly data.
• Color-coded performance (green for positive, red for negative).
• Dynamic highlights – the current month is softly emphasized.
• Fully customizable lookback period (1–50 years).
📈 Use cases:
• Spot seasonal market trends.
• Time entries/exits based on recurring historical strength/weakness.
• Build the foundation for more advanced seasonality or macro scripts.
Just load it on any chart and see which months historically outshine the rest.
⸻
FX Fix with Adjustable TimezoneFX Fix Time Highlighter
This indicator visually highlights candlesticks at a user-defined time and timezone to help traders easily identify when the FX fix occurs. Simply set your preferred timezone and the exact time you want to mark on the chart, and the indicator will automatically highlight the corresponding candlesticks.
Ideal for forex traders who want a clear visual reference of the FX fix window, aiding in analysis of price behavior during this key market event.
Features:
Customizable timezone selection
Adjustable highlight time (hour and minute)
Automatic candlestick highlighting at the chosen time
Supports all timeframes
Use this tool to better understand market dynamics around the FX fix and improve your trading decisions.

5 AM NY 4H Candle High/LowThis indicator identifies the 4-hour candle that starts at 5:00 AM New York time (NYT) and automatically plots its high and low on intraday charts (e.g., 15m, 30m, 1H).
It helps traders:
Highlight a key session window often associated with increased market activity.
Use the 5AM–9AM NYT range for breakout, reversal, or liquidity zone strategies.
See clean horizontal levels that can act as support or resistance throughout the trading day.
🧠 Key Features:
Works on any timeframe below 4H.
Automatically detects and updates daily.
Optional labels to mark the range visually.

Hide Current Bara lightweight overlay indicator designed to hide the color of the active (unconfirmed) candle on the chart.
Key Features:
Purpose: Hide the color of the currently forming bar (i.e., the active candle) on the price chart.
Psychological Benefit of Hiding the Active Candle’s Color
Hiding the color of the active candle can have notable psychological benefits for traders:
Reduction of Bias: The color of a forming candle often fluctuates as prices move up and down during its formation. This can trigger emotional responses such as fear or greed. By removing the color, traders avoid overreacting to incomplete information and are less likely to jump to conclusions based on transient price moves.
Focus on Confirmed Data: Since only completed candles are relevant for most technical analysis, hiding the color of the active candle encourages traders to make decisions based on fully formed and reliable data rather than noise.
Improved Discipline: By not seeing the color of the active candle, traders are less tempted to enter or exit trades impulsively in reaction to price flickers. This promotes a more systematic and disciplined approach.
Minimized Overtrading: Visual cues like bright green or red candles can prompt hasty trades, particularly in fast-moving markets. A transparent active candle helps reduce the temptation to trade every minor tick, fostering patience.
In summary, by hiding the color of the active candle, this script helps traders maintain emotional neutrality and focus on confirmed price action, leading to better, more rational trading decisions.

9:15 Range with 0.09% BufferThis strategy is based on the first 9:15 AM candle for Nifty, which is considered a key reference point (also called the "GAN level entry"). It defines a range around the high and low of the 9:15 candle with a 0.09% buffer on both sides.
The upper buffer level acts as a potential resistance.
The lower buffer level acts as a potential support.
When the price crosses above the upper buffer, it signals a possible entry for a Call option (CE) or a long position.
When the price crosses below the lower buffer, it signals a possible entry for a Put option (PE) or a short position.
This approach helps traders identify early breakout opportunities based on the opening candle range, aiming to capture momentum moves in either direction during the trading session.

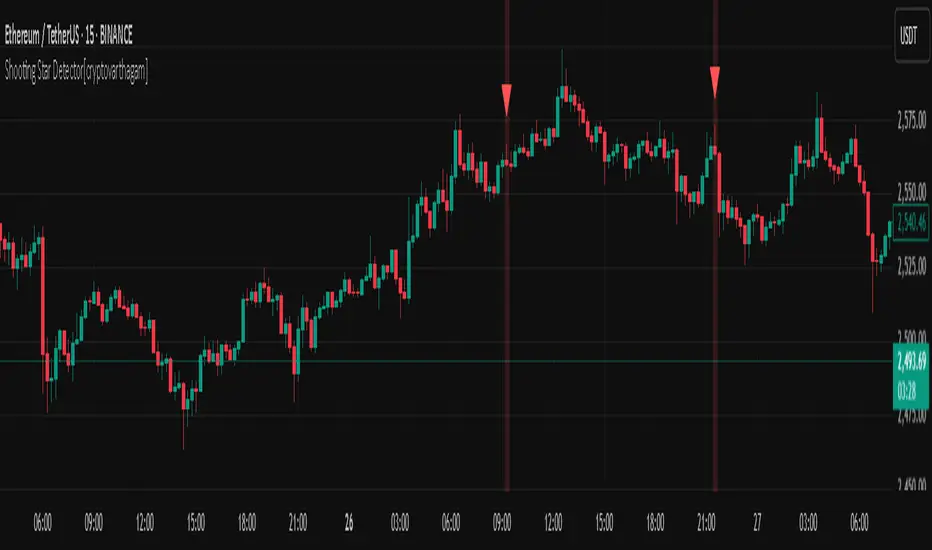
Shooting Star Detector[cryptovarthagam]🌠 Shooting Star Detector
The Shooting Star Detector is a powerful price action tool that automatically identifies potential bearish reversal signals using the well-known Shooting Star candlestick pattern.
Ideal for traders who rely on candlestick psychology to spot high-probability short setups, this script works across all markets and timeframes.
🔍 What is a Shooting Star?
A Shooting Star is a single-candle pattern that typically forms at the top of an uptrend or resistance zone. It’s characterized by:
A small body near the candle's low,
A long upper wick, and
Little or no lower wick.
This pattern suggests that buyers pushed price higher but lost control by the close, hinting at potential bearish momentum ahead.
✅ Indicator Features:
🔴 Accurately detects Shooting Star candles in real-time
🔺 Plots a red triangle above every valid signal candle
🖼️ Optional background highlight for visual clarity
🕵️♂️ Strict ratio-based detection using:
Wick-to-body comparisons
Upper wick dominance
Optional bearish candle confirmation
⚙️ Detection Logic (Rules Used):
Upper wick > 60% of total candle range
Body < 20% of total candle
Lower wick < 15% of candle range
Bearish candle (optional but included for accuracy)
These rules ensure high-quality signals that filter out false positives.
📌 Best Use Cases:
Spotting trend reversals at swing highs
Confirming entries near resistance zones
Enhancing price action or supply/demand strategies
Works on: Crypto, Forex, Stocks, Commodities
🧠 Trading Tip:
Pair this detector with volume confirmation, resistance zones, or bearish divergence for higher-probability entries.
📉 Clean, minimal, and non-repainting — designed for traders who value accuracy over noise.
Created with ❤️ by Cryptovarthagam
Follow for more real-time price action tools!
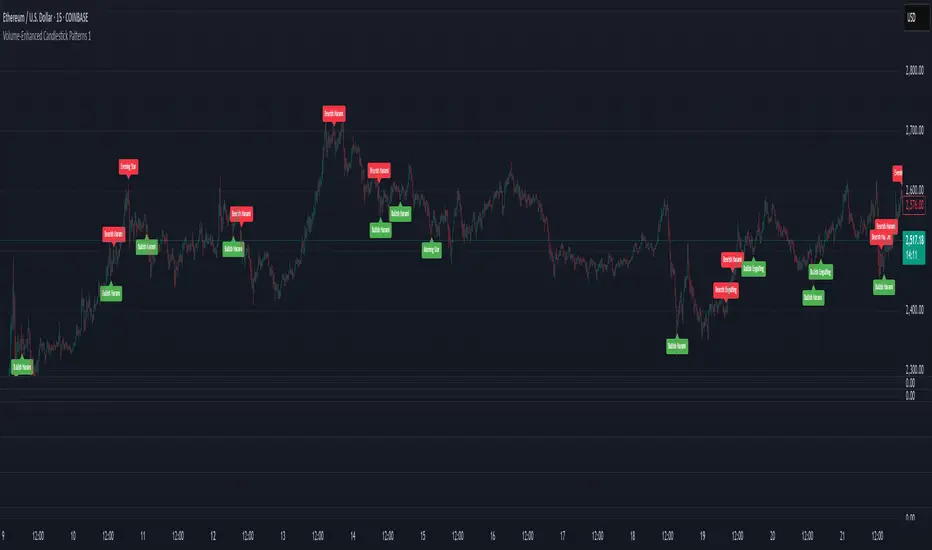
Volume-Enhanced Candlestick Patterns 1
Overview
Scans for four major candlestick reversal patterns:
Harami
Engulfing
Morning/Evening Star
Piercing Line/Dark Cloud Cover
Underlying logic assumes that, at a turning point, the dominant side (bulls or bears) often delivers a “final” push—either a last surge of buying or selling—before the reversal truly takes hold.
Pattern Toggles
Each individual pattern can be turned on or off in the inputs.
Enable only the patterns you want to monitor to reduce chart clutter and speed up performance.
Volume Filter Toggle
On: Requires volume-based exhaustion or climax to confirm each pattern.
Off: Relies purely on price-action candlestick logic (no volume checks).
Grouped Labels & Confluence
When one or more patterns trigger on the same bar close, a single label is drawn:
Grouping multiple confirmed patterns on one bar increases confluence and signal strength.
Climax Volume × Multiplier
Adjusting this input affects signal frequency and conviction:
Higher multiplier → fewer signals but with stronger volume confirmation
Lower multiplier → more signals, each with a looser volume requirement
Alerts
Built-in alert condition for each individual pattern (bullish/bearish Harami, Engulfing, Star, Piercing, Dark Cloud Cover), so you can receive real-time notifications whenever a confirmation occurs.
Follow for Weekly Scripts
If you find this helpful, please hit Follow and 🚀button —I release a new scripts every week.
Disclaimer
Not Financial Advice. This script is for educational and research purposes only.
Use as Part of a Larger System. It should not be used in isolation; combine it with your own risk management rules, additional indicators, and broader market analysis.
No Guarantees. Candlestick patterns and volume filters can improve signal quality, but they do not guarantee profitable trades. Always perform your own due diligence before entering any position.
Liquidity Sweep Candlestick Pattern with MA Filter📌 Liquidity Sweep Candlestick Pattern with MA Filter
This custom indicator detects liquidity sweep candlestick patterns—price action events where the market briefly breaks a previous candle’s high or low to trap traders—paired with optional filters such as moving averages, color change candles, and strictness rules for better signal accuracy.
🔍 What is a Liquidity Sweep?
A liquidity sweep occurs when the price briefly breaks the high or low of a previous candle and then reverses direction. These events often occur around key support/resistance zones and are used by institutional traders to trap retail positions before moving the price in the intended direction.
🟢 Bullish Liquidity Sweep Criteria
The current candle is bullish (closes above its open).
The low of the current candle breaks the low of the previous candle.
The candle closes above the previous candle’s open.
Optionally, in Strict mode, it must also close above the previous candle’s high.
Optionally, it can be filtered to only show if the candle changed color from the previous one (e.g., red to green).
Can be filtered to only show when the price is above or below a moving average (if MA filter is enabled).
🔴 Bearish Liquidity Sweep Criteria
The current candle is bearish (closes below its open).
The high of the current candle breaks the high of the previous candle.
The candle closes below the previous candle’s open.
Optionally, in Strict mode, it must also close below the previous candle’s low.
Optionally, it can be filtered to only show if the candle changed color from the previous one (e.g., green to red).
Can be filtered to only show when the price is above or below a moving average (if MA filter is enabled).
⚙️ Features & Customization
✅ Signal Strictness
Choose between:
Less Strict (default): Basic wick break and close conditions.
Strict: Must close beyond the wick of the previous candle.
✅ Color Change Candles Only
Enable this to only show patterns when the candle color changes (e.g., from red to green or green to red). Helps filter fake-outs.
✅ Moving Average Filter (optional)
Supports several types of MAs: SMA, EMA, WMA, VWMA, RMA, HMA
Choose whether signals should only appear above or below the selected moving average.
✅ Custom Visuals
Show short (BS) or full (Bull Sweep / Bear Sweep) labels
Plot triangles or arrows to represent bullish and bearish sweeps
Customize label and shape colors
Optionally show/hide the moving average line
✅ Alerts
Includes alert options for:
Bullish sweep
Bearish sweep
Any sweep
📈 How to Use
Add the indicator to your chart.
Configure the strictness, color change, or MA filters based on your strategy.
Observe signals where price is likely to reverse after taking out liquidity.
Use with key support/resistance levels, order blocks, or volume zones for confluence.
⚠️ Note
This tool is for educational and strategy-building purposes. Always confirm signals with other indicators, context, and sound risk management.

Canuck Trading Projection IndicatorCanuck Trading Projection Indicator
Overview
The Canuck Trading Projection Indicator is a powerful PineScript v6 tool designed for TradingView to project potential bullish and bearish price trajectories based on historical price and volume movements. It provides traders with actionable insights by estimating future price targets and assigning confidence levels to each outlook, helping to identify probable market directions across any timeframe. Ideal for both short-term and long-term traders, this indicator combines momentum analysis, RSI filtering, support/resistance detection, and time-weighted trend analysis to deliver robust projections.
Features
Bullish and Bearish Projections: Forecasts price targets for upward (bullish) and downward (bearish) movements over a user-defined projection period (default 20 bars).
Confidence Levels: Assigns percentage confidence scores to each outlook, reflecting the likelihood of the projected price based on historical trends, volatility, and volume.
RSI Filter: Incorporates a 14-period Relative Strength Index (RSI) to validate trends, requiring RSI > 50 for bullish and RSI < 50 for bearish signals.
Support/Resistance Detection: Adjusts confidence levels when projections are near key swing highs/lows (within 2% of average price), boosting confidence by 5% for alignments.
Time-Based Weighting: Prioritizes recent price movements in trend analysis, giving more weight to newer bars for improved relevance.
Customizable Inputs: Allows users to tailor lookback period, projection bars, RSI period, confidence threshold, colors, and label positioning.
Forced Label Spacing: Prevents overlap of bullish and bearish text labels, even for tight projections, using fixed vertical slots when price differences are small (<2% of average price).
Timeframe Flexibility: Works seamlessly across all TradingView timeframes (e.g., 30-minute, hourly, daily, weekly, monthly), adapting projections to the chart’s resolution.
Clean Visualization: Displays projections as green (bullish) and red (bearish) dashed lines, with non-overlapping text labels at the projection endpoints showing price targets and confidence levels.
How It Works
The indicator analyzes historical price and volume data over a user-defined lookback period (default 50 bars) to calculate:
Momentum: Combines price changes and volume to assess trend strength, using a weighted moving average (WMA) for directional bias.
Trend Analysis: Counts bullish (price up, volume above average, RSI > 50) and bearish (price down, volume above average, RSI < 50) trends, weighting recent bars more heavily.
Projections:
Bullish Slope: Positive or flat when momentum is upward, scaled by price change and momentum intensity.
Bearish Slope: Negative or flat when momentum is downward, amplified by bearish confidence for stronger projections.
Projects prices forward by 20 bars (default) using current close plus slope times projection bars.
Confidence Levels:
Base confidence derived from the proportion of bullish/bearish trends, with a 5% minimum to avoid zero confidence.
Adjusted by volatility (lower volatility increases confidence), volume trends, and proximity to support/resistance levels.
Visualization:
Draws projection lines from the current close to the 20-bar future target.
Places text labels at line endpoints, showing price targets and confidence percentages, with forced spacing for readability.
Input Parameters
Lookback Period (default: 50): Number of bars for historical analysis (minimum 10).
Projection Bars (default: 20): Number of bars to project forward (minimum 5).
Confidence Threshold (default: 0.6): Minimum confidence for strong trend indication (0.1 to 1.0).
Bullish Projection Line Color (default: Green): Color for bullish projection line and label.
Bearish Projection Line Color (default: Red): Color for bearish projection line and label.
RSI Period (default: 14): Period for RSI momentum filter (minimum 5).
Label Vertical Offset (%) (default: 1.0): Base offset for labels as a percentage of price range (0.1% to 5.0%).
Minimum Label Spacing (%) (default: 2.0): Minimum vertical spacing between labels for tight projections (0.5% to 10.0%).
Usage Instructions
Add to Chart: Copy the script into TradingView’s Pine Editor, save, and add the indicator to your chart.
Select Timeframe: Apply to any timeframe (e.g., 30-minute, hourly, daily, weekly, monthly) to match your trading strategy.
Interpret Outputs:
Green Line/Label: Bullish price target and confidence (e.g., "Bullish: 414.37, Confidence: 35%").
Red Line/Label: Bearish price target and confidence (e.g., "Bearish: 279.08, Confidence: 41.3%").
Higher confidence indicates a stronger likelihood of the projected outcome.
Adjust Inputs:
Modify Lookback Period to focus on shorter/longer historical trends (e.g., 20 for short-term, 100 for long-term).
Change Projection Bars to adjust forecast horizon (e.g., 10 for shorter, 50 for longer).
Tweak RSI Period or Confidence Threshold for sensitivity to momentum or trend strength.
Customize Colors for visual preference.
Increase Minimum Label Spacing if labels overlap in volatile markets.
Combine with Analysis: Use alongside other indicators (e.g., moving averages, Bollinger Bands) or fundamental analysis to confirm signals, as projections are probabilistic.
Example: TSLA Across Timeframes
Using live TSLA data (close ~346.46 USD, May 31, 2025), the indicator produces:
30-Minute: Bullish 341.93 (13.3%), Bearish 327.96 (86.7%) – Strong bearish sentiment due to intraday volatility.
1-Hour: Bullish 342.00 (33.9%), Bearish 327.50 (62.3%) – Bearish but less intense, reflecting hourly swings.
4-Hour: Bullish 345.52 (73.4%), Bearish 344.44 (19.0%) – Flat outlook, indicating consolidation.
Daily: Bullish 391.26 (68.8%), Bearish 302.22 (31.2%) – Bullish bias from recent uptrend, bearish tempered by longer lookback.
Weekly: Bullish 414.37 (35.0%), Bearish 279.08 (41.3%) – Wide range, reflecting annual volatility.
Monthly: Bullish 396.70 (54.9%), Bearish 296.93 (10.2%) – Long-term bullish optimism.
These results align with market dynamics: short-term intervals capture volatility, while longer intervals smooth trends, providing balanced outlooks.
Notes
Accuracy: Projections are estimates based on historical data and should be used with other analysis tools. Confidence levels indicate likelihood, not certainty.
Timeframe Sensitivity: Short-term intervals (e.g., 30-minute) show larger price swings and higher confidence due to volatility, while longer intervals (e.g., monthly) are more stable.
Customization: Adjust inputs to match your trading style (e.g., shorter lookback for day trading, longer for swing trading).
Performance: Tested on volatile stocks like TSLA, NVIDIA, and others, ensuring robust performance across markets.
Limitations: May produce conservative bearish projections in strong uptrends due to momentum weighting. Adjust lookback or projection_bars for sensitivity.
Feedback
If you encounter issues (e.g., label overlap, projection mismatches), please share your timeframe, settings, or a screenshot. Suggestions for enhancements (e.g., additional filters, visual tweaks) are welcome!
Disclaimer
The Canuck Trading Projection Indicator is provided for educational and informational purposes only. It is not financial advice. Trading involves significant risks, and past performance is not indicative of future results. Always perform your own due diligence and consult a qualified financial advisor before making trading decisions.

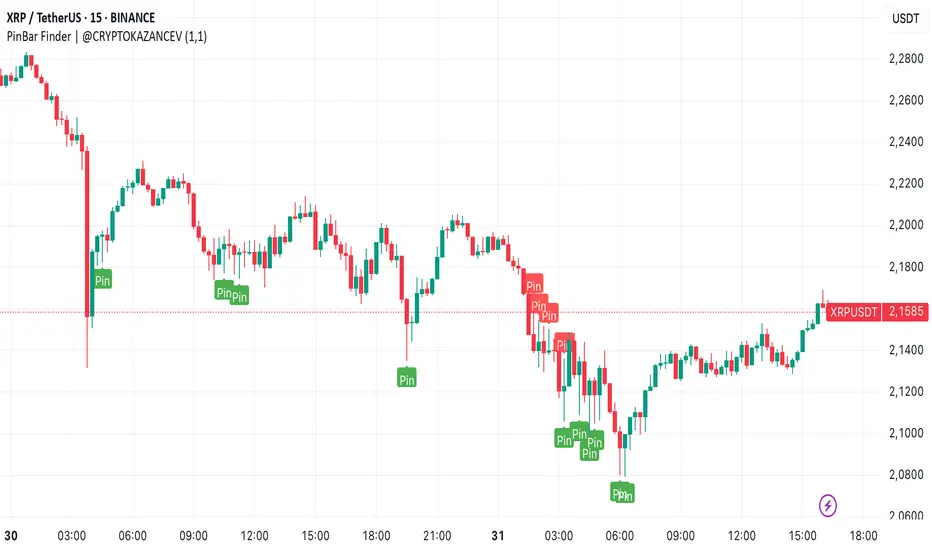
PinBar Finder | @CRYPTOKAZANCEVPinBar Finder | @CRYPTOKAZANCEV
This script helps traders identify high-probability reversal points based on price action, specifically Pin Bars — a well-known candlestick pattern used in technical analysis.
What does the indicator do?
It detects bullish and bearish Pin Bars using a custom method for wick-to-body ratio and filters based on historical volatility (pseudo-ATR). A label appears on the chart with detailed info on wick and body size when a valid signal is found.
How does it work?
- The indicator calculates a pseudo-ATR based on the percentage range of the last 1000 candles.
- It then multiplies this value by a user-defined factor (default: 1.1) to set a dynamic threshold for wick size.
- Bullish Pin Bars are detected when the lower wick is at least 1.1 times the body and greater than the dynamic ATR.
- Bearish Pin Bars are detected when the upper wick meets similar conditions.
- Signals are shown using chart labels with exact wick/body percentages.
- Alerts are included for automation or integration with trading bots.
How to use it?
- Add the indicator to any timeframe and asset.
- Use the alerts to notify you when a Pin Bar appears.
- Ideal for traders who use candlestick reversal strategies or combine price action with other confluence tools.
- You can adjust the wick length multiplier to fit the volatility of the instrument.
What makes it original?
Unlike many public scripts that use fixed ratios, this script adapts wick length detection based on recent volatility (pseudo-ATR logic). This makes it more dynamic and suitable for different markets and timeframes.
Developed by: @ZeeZeeMon
Original author name on chart: @CRYPTOKAZANCEV
This script is open-source and educational. Use at your own discretion.
PinBar Finder | @CRYPTOKAZANCEV
Этот скрипт помогает трейдерам находить точки потенциального разворота на основе прайс-экшена, а именно — свечного паттерна «Пин-бар». Индикатор автоматически определяет бычьи и медвежьи пин-бары с учетом адаптивных параметров волатильности.
Что делает индикатор?
Скрипт ищет свечи, у которых тень в несколько раз превышает тело (пин-бары), и отображает на графике точную информацию о длине тела и тени. Это полезно для трейдеров, использующих свечные сигналы на разворот.
Как работает?
- Рассчитывается псевдо-ATR по 1000 последним свечам на основе процентного диапазона high-low.
- Этот ATR умножается на заданный множитель (по умолчанию: 1.1), чтобы динамически задать минимальную длину тени.
- Бычий пин-бар определяется, когда нижняя тень больше тела в 1.1 раза и превышает ATR.
- Медвежий пин-бар — аналогично, но для верхней тени.
- Индикатор отображает лейблы с точными значениями тела и тени.
- Реализованы условия для оповещений (alerts).
Как использовать?
- Добавьте индикатор на нужный график и таймфрейм.
- Настройте alerts, чтобы не пропустить сигналы.
- Особенно полезен для трейдеров, работающих со свечным анализом, стратегиями разворота, а также в сочетании с другими индикаторами.
В чем оригинальность?
В отличие от многих скриптов, использующих фиксированные параметры, здесь используется динамический расчет длины тени на основе волатильности. Это делает скрипт адаптивным к рынку и таймфрейму.
Разработчик: @ZeeZeeMon
Оригинальное имя автора на графике: @CRYPTOKAZANCEV
Скрипт является открытым и предназначен для образовательных целей. Используйте на своё усмотрение.
X OROverview
Designed to plot hourly opening ranges (ORs) on an intraday chart. It primarily serves as a trading tool for assessing market direction and potential trading opportunities by analyzing price action relative to key OHLC (Open, High, Low, Close) levels within each hourly range.
The code provided is for each hour sessions from 2:00 AM to 3:00 PM for a complete session-based framework. In addition there is the RTH open range
Purpose
The core purpose of this indicator is to:
✅ Define each hourly range (based on the session’s opening bar) by recording the high and low of that range.
✅ Extend this range into the following bars for visual reference — serving as dynamic support and resistance zones.
✅ Monitor price action relative to each hourly OR, helping traders evaluate market direction and structure trades using concepts like:
Breakouts above/below the OR high/low.
Rejections or consolidations within the OR.
Continuation or reversal signals tied to each OR.
Key Features
The script marks the first bar of the session as the OR session start.
During this bar, it initializes:
Opening price
Session high
Session low
These levels form the initial range.
🔹 Dynamic Range Tracking
Throughout the one-minute OR session:
The highest and lowest prices are updated in real time, capturing intra-hour volatility.
A visual background box is drawn to highlight the OR range on the chart.
🔹 Range Extension
The script defines an extended session period after the initial OR (e.g., 2:00 AM-2:45 AM for the 2:00 AM session).
During this extension period:
The box persists on the chart, providing a contextual zone that traders can use as a dynamic support/resistance area.
🔹 Visual Representation
Transparent colored boxes highlight each session’s OR visually on the chart.
These boxes help traders easily identify whether price is trading:
Inside the OR
Breaking above the high (potential bullish continuation)
Breaking below the low (potential bearish continuation)
Application in Trading
🔍 Trading the Opening Range Breakout
Traders often use the OR high and low as breakout triggers. For example:
A price break above the OR high may signal bullish momentum.
A break below the OR low may signal bearish momentum.
⚖️ Support and Resistance
Even if breakouts fail, the OR can act as a pivot zone — offering areas for:
Stop placements
Target levels
Entry confirmations for fade trades or mean reversion strategies.
🕒 Session Awareness
By defining each hour’s OR individually (from 2:00 AM to 3:00 PM), traders can:
Analyze price behavior within each session.
Recognize when liquidity or volatility increases (e.g. around overlapping sessions like London open or New York open).
Summary
This Pine Script indicator provides a powerful framework for visualizing and trading hourly opening ranges. It enhances intraday analysis by:
Structuring price action within hourly boxes.
Highlighting key price levels relative to OHLC concepts.
Helping traders make more informed decisions by assessing price behavior around these critical ranges.

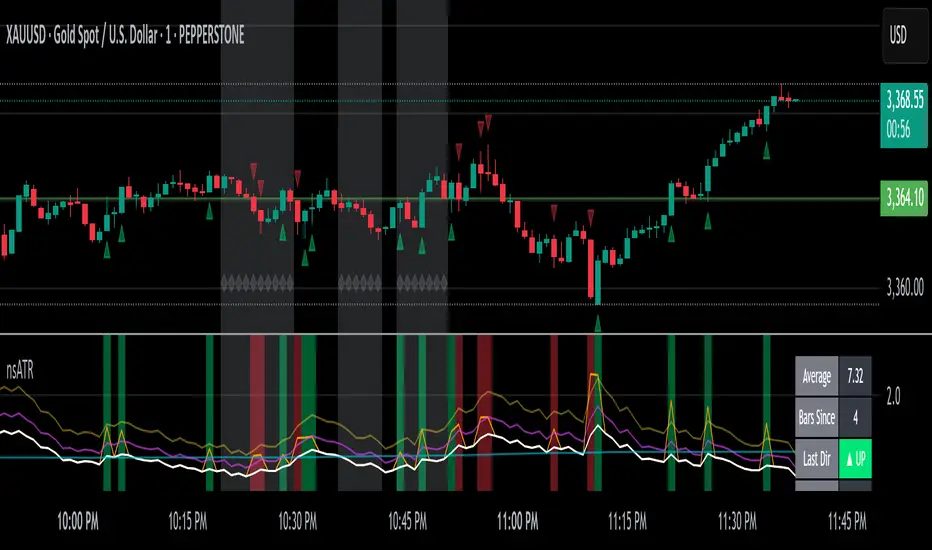
Not-So-Average True Range (nsATR)Not-So-Average True Range (nsATR)
*By Sherlock_MacGyver*
---
Long Story Short
The nsATR is a complete overhaul of traditional ATR analysis. It was designed to solve the fundamental issues with standard ATR, such as lag, lack of contextual awareness, and equal treatment of all volatility events.
Key innovations include:
* A smarter ATR that reacts dynamically when price movement exceeds normal expectations.
* Envelope zones that distinguish between moderate and extreme volatility conditions.
* A long-term ATR baseline that adds historical context to current readings.
* A compression detection system that flags when the market is coiled and ready to break out.
This indicator is designed for traders who want to see volatility the way it actually behaves — contextually, asymmetrically, and with predictive power.
---
What Is This Thing?
Standard ATR (Average True Range) has limitations:
* It smooths too slowly (using Wilder's RMA), which delays detection of meaningful moves.
* It lacks context — no way to know if current volatility is high or low relative to history.
* It treats all volatility equally, regardless of scale or significance.
nsATR** was built from scratch to overcome these weaknesses by applying:
* Amplification of large True Range spikes.
* Visual envelope zones for detecting volatility regimes.
* A long-term context line to anchor current readings.
* Multi-factor compression analysis to anticipate breakouts.
---
Core Features
1. Breach Detection with Amplification
When True Range exceeds a user-defined threshold (e.g., ATR × 1.2), it is amplified using a power function to reflect nonlinear volatility. This amplified value is then smoothed and cascades into future ATR values, affecting the indicator beyond a single bar.
2. Direction Tagging
Volatility spikes are tagged as upward or downward based on basic price momentum (close vs previous close). This provides visual context for how volatility is behaving in real-time.
3. Envelope Zones
Two adaptive envelopes highlight the current volatility regime:
* Stage 1: Moderate volatility (default: ATR × 1.5)
* Stage 2: Extreme volatility (default: ATR × 2.0)
Breaching these zones signals meaningful expansion in volatility.
4. Long-Term Context Baseline
A 200-period simple moving average of the classic ATR establishes whether current readings are above or below long-term volatility expectations.
5. Multi-Signal Compression Detection
Flags potential breakout conditions when:
* ATR is below its long-term baseline
* Price Bollinger Bands are compressed
* RSI Bollinger Bands are also compressed
All three signals must align to plot a "Volatility Confluence Dot" — an early warning of potential expansion.
---
Chart Outputs
In the Indicator Pane:
* Breach Amplified ATR (Orange line)
* Classic ATR baseline (White line)
* Long-Term context baseline (Cyan line)
* Stage 1 and Stage 2 Envelopes (Purple and Yellow lines)
On the Price Chart:
* Triangles for breach direction (green/red)
* Diamonds for compression zones
* Optional background coloring for visual clarity
---
Alerts
Built-in alert conditions:
1. ATR breach detected
2. Stage 1 envelope breached
3. Stage 2 envelope breached
4. Compression zone detected
---
Customization
All components are modular. Traders can adjust:
* Display toggles for each visual layer
* Colors and line widths
* Breach threshold and amplification power
* Envelope sensitivity
* Compression sensitivity and lookback windows
Some options are disabled by default to reduce clutter but can be turned on for more aggressive signal detection.
---
Real-Time Behavior (Non-Repainting Clarification)
The indicator updates in real time on the current bar as new data comes in. This is expected behavior for live trading tools. Once a bar closes, values do not change. In other words, the indicator *does not repaint history* — but the current bar can update dynamically until it closes.
---
Use Cases
* Day traders: Use compression zones to anticipate volatility surges.
* Swing traders: Use envelope breaches for regime awareness.
* System developers: Replace standard ATR in your logic for better responsiveness.
* Risk managers: Use directional volatility signals to better model exposure.
---
About the Developer
Sherlock_MacGyver develops original trading systems that question default assumptions and solve real trader problems.
HTF Candle Breakout Fibonacci LevelsThis indicator automatically plots Fibonacci retracement levels on a lower timeframe (LTF) after detecting a breakout candle on a selected higher timeframe (HTF).
🔍 How It Works
When a candle on your selected HTF closes beyond the high or low of the previous candle, the indicator automatically draws Fibonacci levels on the LTF.
These levels remain visible until the next HTF candle is formed — allowing you to trade retracements with contextual precision.
⸻
⚙️ Customization Options
From the indicator settings, you can modify:
• The HTF candle timeframe (default is 1D)
• Fibonacci levels and colors
• Enable or disable “Show Only the Latest Levels” — ideal for live trading to keep the chart clean and focused.
⸻
🟪 HTF Candles Preview
After applying the indicator, you’ll see 3 vertical bars on the right edge of your LTF chart. These represent a live preview of the last three HTF candles and update in real-time.
If you prefer a cleaner chart, disable this feature via the “Show HTF Candles” toggle in the settings.
⸻
Feel free to reach out if you have any questions.

Schmit Trading LiquidityDescription
Schmit Trading Liquidity Marker automatically spots and labels open liquidity sweep levels by detecting classic stop-run patterns (Bull→Bear for highs, Bear→Bull for lows) across multiple timeframes. Lines are drawn exactly at the wick of the triggering candle and removed as soon as price “sweeps” through them, keeping your chart clean and focused on live levels only.
How It Works
1. Pattern Detection
• Liquidity High: When a bullish candle is immediately followed by a bearish candle (Bull→Bear), the script records the higher of the two wicks.
• Liquidity Low: When a bearish candle is immediately followed by a bullish candle (Bear→Bull), the script records the lower of the two wicks.
2. Multi-Timeframe Support
• Choose up to six timeframes (5 min, 15 min, 30 min, 1 h, 4 h, daily) via checkboxes.
• Each timeframe is evaluated independently, and liquidity levels are drawn on your current chart.
3. Precision Wick Placement
• Lines start at bar_index – 1 so they align exactly with the wick of the signal candle, regardless of your chart’s timeframe.
4. Automatic Cleanup
• As soon as price closes beyond a drawn line (sweep), that line is deleted automatically.
Inputs
Input Name Description
Show 5 min. Enable liquidity detection on the 5-minute timeframe.
Show 15 min. Enable liquidity detection on the 15-minute timeframe.
Show 30 min. Enable liquidity detection on the 30-minute timeframe.
Show 1 h. Enable liquidity detection on the 1-hour timeframe.
Show 4 h. Enable liquidity detection on the 4-hour timeframe.
Show 1 D. Enable liquidity detection on the daily timeframe.
High Line Color. Color of Bull→Bear (liquidity high) lines (default: red).
Low Line Color. Color of Bear→Bull (liquidity low) lines (default: blue).
Line Length. How many bars each liquidity line extends to the right.
Usage Tips
• Focus on Live Zones: Combine with volume or order-flow tools to confirm genuine
liquidity sweeps.
• Multiple TFs: Enable higher timeframes for major liquidity clusters; lower timeframes
for fine‐tuning entries.
• Chart Cleanliness: Lines self‐delete on sweep, ensuring no manual cleanup is needed.
⸻
Disclosure & License
This indicator is Open-Source under the Mozilla Public License 2.0. Feel free to review, adapt, and improve the code. No performance guarantees—use responsibly and backtest any strategy before trading live.

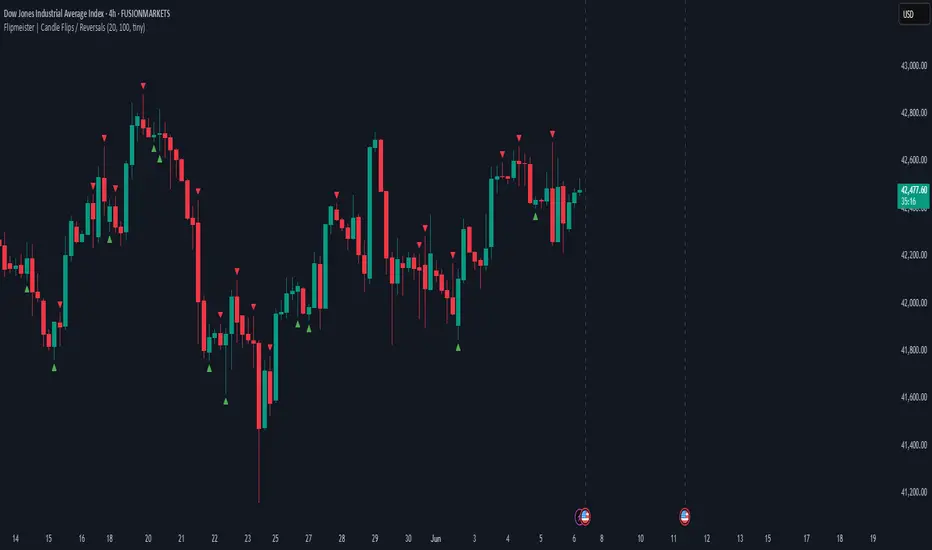
Flipmeister | Candle Flips / ReversalsOpinionated way to highlight important candle flips and can lead to trading opportunities.
- Green to Red flip needs to break previous candle's high and flip to qualify
- Red to Green flip needs to break previous candle's low and flip to qualify
You can configure:
- Min Wick Size for marker to be shown
- Max lookback in bars to limit the amount of markers on the chart
Alerts! You can setup alert conditions for any flip and it's going to notify you when it happens.
Create alert -> Condition: Flipmeister -> Function: Any Flip (or any other available condition).
Candle Volume Profile Marker# 📊 Candle Volume Profile Marker (CVPM)
**Transform your chart analysis with precision volume profile levels on every candle!**
The Candle Volume Profile Marker displays key volume profile levels (POC, VAH, VAL) for individual candles, giving you granular insights into price acceptance and rejection zones at the micro level.
## 🎯 **Key Features**
### **Core Levels**
- **POC (Point of Control)** - The price level with highest volume concentration
- **VAH (Value Area High)** - Upper boundary of the value area
- **VAL (Value Area Low)** - Lower boundary of the value area
- **Customizable Value Area** - Adjust percentage from 50% to 90%
### **Flexible Display Options**
- **Current Candle Only** or **Historical Lookback** (1-50 candles)
- **Multiple Visual Styles** - Lines, dots, crosses, triangles, squares, diamonds
- **Smart Line Extensions** - Right only, both sides, or left only
- **4 Line Length Modes** - Normal, Short, Ultra Short, Micro (for ultra-clean charts)
- **Full Color Customization** - Colors, opacity, line width
- **Adjustable Marker Sizes** - Tiny to Large
### **Advanced Calculation Methods**
Choose your POC calculation:
- **Weighted** - Smart estimation based on volume distribution (default)
- **Close** - Uses closing price
- **Middle** - High-Low midpoint
- **VWAP** - Volume weighted average price
### **Professional Tools**
- **Real-time Info Table** - Current levels display
- **Smart Alerts** - POC crosses and Value Area breakouts
- **Highlight Current Candle** - Extended dotted lines for current levels
- **Developing Levels** - Real-time updates for active candle
## 🚀 **Why Use CVPM?**
### **Precision Trading**
- Identify exact support/resistance on each candle
- Spot volume acceptance/rejection zones
- Plan entries and exits with micro-level precision
### **Clean & Customizable**
- Lines extend only right (eliminates confusion)
- Ultra-short line options for minimal chart clutter
- Professional appearance with full customization
### **Multiple Timeframes**
- Works on any timeframe from 1-minute to monthly
- Historical analysis with adjustable lookback
- Real-time developing levels
## 📈 **Perfect For**
- **Day Traders** - Micro-level entry/exit points
- **Swing Traders** - Key levels for position management
- **Volume Analysis** - Understanding price acceptance zones
- **Support/Resistance Trading** - Precise level identification
- **Breakout Trading** - Value area breakout alerts
## ⚙️ **Easy Setup**
1. Add indicator to your chart
2. Choose your preferred visual style (lines/dots)
3. Select line extension (right-only recommended)
4. Adjust line length (try "Ultra Short" for clean charts)
5. Customize colors and enable alerts
## 🎨 **Customization Groups**
- **Display Options** - What to show and how many candles
- **Calculation** - POC method and value area percentage
- **POC Visual** - Style, color, width, length for Point of Control
- **Value Area Visual** - Style, color, width, length for VAH/VAL
- **Line Settings** - Extension direction and length modes
- **Size** - Marker sizes and opacity
## 🔔 **Built-in Alerts**
- Price crosses above/below POC
- Value Area breakouts (up/down)
- Fully customizable alert messages
## 💡 **Pro Tips**
- Use "Right Only" extension to avoid confusion about which candle owns the levels
- Try "Ultra Short" or "Micro" line modes for cleaner charts
- Enable "Highlight Current Candle" for extended reference lines
- Combine with volume indicators for enhanced analysis
- Use different colors for easy POC/VAH/VAL identification
---
**Transform your volume analysis today with the most flexible and customizable candle-level volume profile indicator available!**
*Perfect for traders who demand precision and clean, professional charts.*
