MABB55 Full-CrossIndicates when the MABB55 crosses the:
MABB13
MABB21
EMA8
When a full crossover happens, where the long-term average (MABB 55) moves above or below the faster ones (EMA 8, MABB 13, and 21) it means the trend has shifted so strongly and consistently that it overcomes short-term price movement. That kind of shift usually signals a trend reversal.
Bullish reversals with the MABB55 crossing from above, indicated by a green arrowl.
Bearish reversals with the MABB55 crossing from below, indicated by a red arrow.
Candlestick analysis

Day of Week HighlighterThis Indicator Helps Indian Traders or Any Traders to see Charts Days Highlights in their Charts..

Saty ATR Levels// Saty ATR Levels
// Copyright (C) 2022 Saty Mahajan
// Author is not responsible for your trading using this script.
// Data provided in this script is not financial advice.
//
// Features:
// - Day, Multiday, Swing, Position, Long-term, Keltner trading modes
// - Range against ATR for each period
// - Put and call trigger idea levels
// - Intermediate levels
// - Full-range levels
// - Extension levels
// - Trend label based on the 8-21-34 Pivot Ribbon
//
// Special thanks to Gabriel Viana.
// Based on my own ideas and ideas from Ripster, drippy2hard,
// Adam Sliver, and others.
//@version=5
indicator('Saty ATR Levels', shorttitle='Saty ATR Levels', overlay=true)
// Options
day_trading = 'Day'
multiday_trading = 'Multiday'
swing_trading = 'Swing'
position_trading = 'Position'
longterm_trading = 'Long-term'
trading_type = input.string(day_trading, 'Trading Type', options= )
use_options_labels = input(true, 'Use Options Labels')
atr_length = input(14, 'ATR Length')
trigger_percentage = input(0.236, 'Trigger Percentage')
previous_close_level_color = input(color.white, 'Previous Close Level Color')
lower_trigger_level_color = input(color.yellow, 'Lower Trigger Level Color')
upper_trigger_level_color = input(color.aqua, 'Upper Trigger Level Color')
key_target_level_color = input(color.silver, 'Key Target Level Color')
atr_target_level_color = input(color.white, 'ATR Target Level Color')
intermediate_target_level_color = input(color.gray, 'Intermediate Target Level Color')
show_all_fibonacci_levels = input(true, 'Show All Fibonacci Levels')
show_extensions = input(false, 'Show Extensions')
level_size = input(2, 'Level Size')
show_info = input(true, 'Show Info Label')
use_current_close = input(false, 'Use Current Close')
fast_ema = input(8, 'Fast EMA')
pivot_ema = input(21, 'Pivot EMA')
slow_ema = input(34, 'Slow EMA')
// Set the appropriate timeframe based on trading mode
timeframe_func() =>
timeframe = 'D'
if trading_type == day_trading
timeframe := 'D'
else if trading_type == multiday_trading
timeframe := 'W'
else if trading_type == swing_trading
timeframe := 'M'
else if trading_type == position_trading
timeframe := '3M'
else if trading_type == longterm_trading
timeframe := '12M'
else
timeframe := 'D'
// Trend
price = close
fast_ema_value = ta.ema(price, fast_ema)
pivot_ema_value = ta.ema(price, pivot_ema)
slow_ema_value = ta.ema(price, slow_ema)
bullish = price >= fast_ema_value and fast_ema_value >= pivot_ema_value and pivot_ema_value >= slow_ema_value
bearish = price <= fast_ema_value and fast_ema_value <= pivot_ema_value and pivot_ema_value <= slow_ema_value
// Data
period_index = use_current_close ? 0 : 1
ticker = ticker.new(syminfo.prefix, syminfo.ticker, session=session.extended)
previous_close = request.security(ticker, timeframe_func(), close , gaps=barmerge.gaps_off, lookahead=barmerge.lookahead_on)
atr = request.security(ticker, timeframe_func(), ta.atr(atr_length) , gaps=barmerge.gaps_off, lookahead=barmerge.lookahead_on)
period_high = request.security(ticker, timeframe_func(), high, gaps=barmerge.gaps_off, lookahead=barmerge.lookahead_on)
period_low = request.security(ticker, timeframe_func(), low, gaps=barmerge.gaps_off, lookahead=barmerge.lookahead_on)
range_1 = period_high - period_low
tr_percent_of_atr = range_1 / atr * 100
lower_trigger = previous_close - trigger_percentage * atr
upper_trigger = previous_close + trigger_percentage * atr
lower_0382 = previous_close - atr * 0.382
upper_0382 = previous_close + atr * 0.382
lower_0500 = previous_close - atr * 0.5
upper_0500 = previous_close + atr * 0.5
lower_0618 = previous_close - atr * 0.618
upper_0618 = previous_close + atr * 0.618
lower_0786 = previous_close - atr * 0.786
upper_0786 = previous_close + atr * 0.786
lower_1000 = previous_close - atr
upper_1000 = previous_close + atr
lower_1236 = lower_1000 - atr * 0.236
upper_1236 = upper_1000 + atr * 0.236
lower_1382 = lower_1000 - atr * 0.382
upper_1382 = upper_1000 + atr * 0.382
lower_1500 = lower_1000 - atr * 0.5
upper_1500 = upper_1000 + atr * 0.5
lower_1618 = lower_1000 - atr * 0.618
upper_1618 = upper_1000 + atr * 0.618
lower_1786 = lower_1000 - atr * 0.786
upper_1786 = upper_1000 + atr * 0.786
lower_2000 = lower_1000 - atr
upper_2000 = upper_1000 + atr
lower_2236 = lower_2000 - atr * 0.236
upper_2236 = upper_2000 + atr * 0.236
lower_2382 = lower_2000 - atr * 0.382
upper_2382 = upper_2000 + atr * 0.382
lower_2500 = lower_2000 - atr * 0.5
upper_2500 = upper_2000 + atr * 0.5
lower_2618 = lower_2000 - atr * 0.618
upper_2618 = upper_2000 + atr * 0.618
lower_2786 = lower_2000 - atr * 0.786
upper_2786 = upper_2000 + atr * 0.786
lower_3000 = lower_2000 - atr
upper_3000 = upper_2000 + atr
// Add Labels
tr_vs_atr_color = color.green
if tr_percent_of_atr <= 70
tr_vs_atr_color := color.green
else if tr_percent_of_atr >= 90
tr_vs_atr_color := color.red
else
tr_vs_atr_color := color.orange
trading_mode = 'Day'
if trading_type == day_trading
trading_mode := 'Day'
else if trading_type == multiday_trading
trading_mode := 'Multiday'
else if trading_type == swing_trading
trading_mode := 'Swing'
else if trading_type == position_trading
trading_mode := 'Position'
else if trading_type == longterm_trading
trading_mode := 'Long-term'
else
trading_mode := ''
long_label = ''
short_label = ''
if use_options_labels
long_label := 'Calls'
short_label := 'Puts'
else
long_label := 'Long'
short_label := 'Short'
trend_color = color.orange
if bullish
trend_color := color.green
else if bearish
trend_color := color.red
else
trend_color := color.orange
var tbl = table.new(position.top_right, 1, 4)
if barstate.islast and show_info
table.cell(tbl, 0, 0, 'Saty ATR Levels', bgcolor=trend_color)
table.cell(tbl, 0, 1, trading_mode + ' Range ($' + str.tostring(range_1, '#.##') + ') is ' + str.tostring(tr_percent_of_atr, '#.#') + '% of ATR ($' + str.tostring(atr, '#.##') + ')', bgcolor=tr_vs_atr_color)
table.cell(tbl, 0, 2, long_label + ' > $' + str.tostring(upper_trigger, '#.##') + ' | +1 ATR $' + str.tostring(upper_1000, '#.##'), bgcolor=upper_trigger_level_color)
table.cell(tbl, 0, 3, short_label + ' < $' + str.tostring(lower_trigger, '#.##') + ' | -1 ATR: $' + str.tostring(lower_1000, '#.##'), bgcolor=lower_trigger_level_color)
// Add levels
plot(show_extensions ? lower_3000 : na, color=color.new(atr_target_level_color, 40), linewidth=level_size, title='-300.0%', style=plot.style_stepline)
//plot(show_all_fibonacci_levels and show_extensions ? lower_2786 : na, color=color.new(intermediate_target_level_color, 40), linewidth=level_size, title='-278.6%', style=plot.style_stepline)
plot(show_extensions ? lower_2618 : na, color=color.new(key_target_level_color, 40), linewidth=level_size, title='-261.8%', style=plot.style_stepline)
//plot(show_all_fibonacci_levels and show_extensions ? lower_2500 : na, color=color.new(intermediate_target_level_color, 40), linewidth=level_size, title='-250.0%', style=plot.style_stepline)
//plot(show_all_fibonacci_levels and show_extensions ? lower_2382 : na, color=color.new(intermediate_target_level_color, 40), linewidth=level_size, title='-238.2%', style=plot.style_stepline)
plot(show_extensions ? lower_2236 : na, color=color.new(key_target_level_color, 40), linewidth=level_size, title='-223.6%', style=plot.style_stepline)
plot(show_extensions ? lower_2000 : na, color=color.new(atr_target_level_color, 40), linewidth=level_size, title='-200.0%', style=plot.style_stepline)
plot(show_all_fibonacci_levels and show_extensions ? lower_1786 : na, color=color.new(intermediate_target_level_color, 40), linewidth=level_size, title='-178.6%', style=plot.style_stepline)
plot(show_extensions ? lower_1618 : na, color=color.new(key_target_level_color, 40), linewidth=level_size, title='-161.8%', style=plot.style_stepline)
plot(show_all_fibonacci_levels and show_extensions ? lower_1500 : na, color=color.new(intermediate_target_level_color, 40), linewidth=level_size, title='-150.0%', style=plot.style_stepline)
plot(show_all_fibonacci_levels and show_extensions ? lower_1382 : na, color=color.new(intermediate_target_level_color, 40), linewidth=level_size, title='-138.2%', style=plot.style_stepline)
plot(show_extensions ? lower_1236 : na, color=color.new(key_target_level_color, 40), linewidth=level_size, title='-123.6%', style=plot.style_stepline)
plot(lower_1000, color=color.new(atr_target_level_color, 40), linewidth=level_size, title='-100%', style=plot.style_stepline)
plot(show_all_fibonacci_levels ? lower_0786 : na, color=color.new(intermediate_target_level_color, 40), linewidth=level_size, title='-78.6%', style=plot.style_stepline)
plot(lower_0618, color=color.new(key_target_level_color, 40), linewidth=level_size, title='-61.8%', style=plot.style_stepline)
plot(show_all_fibonacci_levels ? lower_0500 : na, color=color.new(intermediate_target_level_color, 40), linewidth=level_size, title='-50.0%', style=plot.style_stepline)
plot(show_all_fibonacci_levels ? lower_0382 : na, color=color.new(intermediate_target_level_color, 40), linewidth=level_size, title='-38.2%', style=plot.style_stepline)
plot(lower_trigger, color=color.new(lower_trigger_level_color, 40), linewidth=level_size, title='Lower Trigger', style=plot.style_stepline)
plot(previous_close, color=color.new(previous_close_level_color, 40), linewidth=level_size, title='Previous Close', style=plot.style_stepline)
plot(upper_trigger, color=color.new(upper_trigger_level_color, 40), linewidth=level_size, title='Upper Trigger', style=plot.style_stepline)
plot(show_all_fibonacci_levels ? upper_0382 : na, color=color.new(intermediate_target_level_color, 40), linewidth=level_size, title='38.2%', style=plot.style_stepline)
plot(show_all_fibonacci_levels ? upper_0500 : na, color=color.new(intermediate_target_level_color, 40), linewidth=level_size, title='50.0%', style=plot.style_stepline)
plot(upper_0618, color=color.new(key_target_level_color, 40), linewidth=level_size, title='61.8%', style=plot.style_stepline)
plot(show_all_fibonacci_levels ? upper_0786 : na, color=color.new(intermediate_target_level_color, 40), linewidth=level_size, title='78.6%', style=plot.style_stepline)
plot(upper_1000, color=color.new(atr_target_level_color, 40), linewidth=level_size, title='100%', style=plot.style_stepline)
plot(show_extensions ? upper_1236 : na, color=color.new(key_target_level_color, 40), linewidth=level_size, title='123.6%', style=plot.style_stepline)
plot(show_all_fibonacci_levels and show_extensions ? upper_1382 : na, color=color.new(intermediate_target_level_color, 40), linewidth=level_size, title='138.2%', style=plot.style_stepline)
plot(show_all_fibonacci_levels and show_extensions ? upper_1500 : na, color=color.new(intermediate_target_level_color, 40), linewidth=level_size, title='150.0%', style=plot.style_stepline)
plot(show_extensions ? upper_1618 : na, color=color.new(key_target_level_color, 40), linewidth=level_size, title='161.8%', style=plot.style_stepline)
plot(show_all_fibonacci_levels and show_extensions ? upper_1786 : na, color=color.new(intermediate_target_level_color, 40), linewidth=level_size, title='178.6%', style=plot.style_stepline)
plot(show_extensions ? upper_2000 : na, color=color.new(atr_target_level_color, 40), linewidth=level_size, title='200.0%', style=plot.style_stepline)
plot(show_extensions ? upper_2236 : na, color=color.new(key_target_level_color, 40), linewidth=level_size, title='223.6%', style=plot.style_stepline)
//plot(show_all_fibonacci_levels and show_extensions ? upper_2382 : na, color=color.new(intermediate_target_level_color, 40), linewidth=level_size, title='238.2%', style=plot.style_stepline)
//plot(show_all_fibonacci_levels and show_extensions ? upper_2500 : na, color=color.new(intermediate_target_level_color, 40), linewidth=level_size, title='250.0%', style=plot.style_stepline)
plot(show_extensions ? upper_2618 : na, color=color.new(key_target_level_color, 40), linewidth=level_size, title='261.8%', style=plot.style_stepline)
//plot(show_all_fibonacci_levels and show_extensions ? upper_2786 : na, color=color.new(intermediate_target_level_color, 40), linewidth=level_size, title='278.6%', style=plot.style_stepline)
plot(show_extensions ? upper_3000 : na, color=color.new(atr_target_level_color, 40), linewidth=level_size, title='300%', style=plot.style_stepline)

Break Previous Low AlertAlert for previous price bar low. When price creates a new low you will get an alert.

🟢 Clean BUY/SELL Signal (All Filters Hidden)fgchavsbmn,cakhscb kals dcaljks cjas ckjasclkasnd.ask dfhg asdhj askgd hjaksdmvhagsbjdkn abs dnljasd

Trading Tools🎯 Trading Tools – Your All-in-One Market Analysis Solution
Developed by Marcelo Ulisses Sobreiro Ribeiro, Trading Tools is a powerful, multi-functional indicator that combines essential trading features into a single, streamlined tool. Perfect for traders who want clear, precise market opportunities across any asset or timeframe.
🔥 Key Features:
📊 Smart Moving Averages
Customizable setup for up to 5 MAs (EMA, SMA, WMA).
Color-coded fills between MAs to highlight trends (bullish/bearish).
Dynamic 20-period MA (color shifts with trend).
Alerts for crossovers and trend changes.
🕒 Killzones (High-Liquidity Sessions)
Visual highlights for key trading sessions: Asia, London, NY AM, NY Lunch, and NY PM.
Customizable colors and transparency.
Drawing limit to avoid chart clutter.
📅 Time-Based Markers
Day-of-week labels (option to hide weekends).
Day separators (customizable style).
🎨 Rule-Based Candle Coloring
Expanded True Range (large candles).
Inside Bars.
123 Pattern (Mark Crisp).
Bullish/Bearish Engulfing.
Price of Closing Reversal (PFR).
Market Strength.
Overbought/Oversold (RSI & Stochastic).
⚖️ Imbalance Detector (FVG, OG, VI)
Fair Value Gaps (FVG).
Opening Gaps (OG).
Volume Imbalance (VI).
🔄 Stochastic Cross & Valid Pullbacks
Stochastic crossover signals (up/down arrows).
Valid pullback alerts.
📈 Dynamic Support & Resistance
Previous day’s high/low (PDH/PDL).
Automatic pivot detection (significant highs/lows).
⚙️ Full Customization
Adjust timeframe limits, timezone, label size, and colors.
Control how many drawings are kept on the chart.
🚨 Built-in Alerts
Alerts for 20-period MA, PFR, Pullbacks, and more!
📌 Why Use Trading Tools?
All-in-one solution: No need for multiple indicators.
Intuitive visuals: Colors and markers simplify setup identification.
Adaptable: Works on any asset (forex, stocks, crypto).
🔹 Perfect for traders who want efficiency and clarity in their analysis!

lucio_😎必勝StrategyThe reversal after the RCI reaches the upper and lower bounds is used as the trigger for entry and settlement.
In order to follow the trend, record the highs and lows of the last 4 hours (adjustable) and aim for long above the center line and short below the center line.
MACD divergence alerts and plots are possible.
SMA (15m.1h.4h) tilted and colored, default display.
In the case of margin trading, it is possible to display a table showing whether there is a bias toward long or short lots for margin with the above high and low as the settlement line.

Custom EMA Inputs (20, 40, 100, 200)This script plots four customizable Exponential Moving Averages (EMAs) on the chart—specifically the 20, 40, 100, and 200-period EMAs. Each EMA length and color can be adjusted by the user, allowing for greater flexibility in trend analysis and multi-timeframe confirmation. The script supports offsetting plots, enabling visual tweaks for alignment with other indicators or price action setups.
Ideal for traders seeking dynamic control over their moving average strategies, this tool provides a clean, adaptable foundation for both trend following and crossover systems.

Multi-Timeframe Close Alert with Toggleyou can create alerts with this indicator for when a time frame closes

Closed Market / Back-Test Filter x 'Bull_Trap_9'Hello TradingView Traders!
This is a very valuable tool that I believe all traders will find useful.
This indicator / filter is '1 of 2'. I prefer it as a filter because it is not meant for live trade analysis. It is designed to make a trader aware of their individual trade sessions and to help aid in static chart candlestick back-testing.
Also, look for my indicator / filter, '2 of 2': 'Red Report Filter'
There are two functions to this filter.
Primary use: It allows a trader to set a session window: Open / Close.
During a trade session, like YM, I only trade 9:30 - 15:00. Without the filter, many times I have traded past my cutoff because I was focused on the chart and not the time.
With this filter on as close nears with an open trade and the filter starts to apply, I know I am at session close with no more trades upon exit. Otherwise, I know the session is done with no further trades.
It is also nice to have the filter on during the session open as a demarcation boundary.
Secondary use: It is used as a chart back-test tool.
When applied to a traders back-test chart, the trader can control their trade session envelopes for easier and more precise evaluation. The filter will allow only the candles per session that the trader wants to focus on and will filter all other non-session candles.
I can easily compare a whole week of 30m session data, concentrating solely on the filtered trade windows.
Please Note: The filter will be active as far back as the historic data prints.
Thanks for viewing!

High Power CandlesThis indicator provides information about the strength of the candles in favor of the trend, following the logical meaning: green (rising force), yellow (little force), red (downward force)

Rapid Candle PATTERNS V2.0Indicator Title: Rapid Candle Patterns - High-Probability Signals
Description
Tired of noisy charts filled with weak and ambiguous candlestick patterns? The Rapid Candle Patterns indicator is engineered to solve this problem by moving beyond simple textbook definitions. It identifies only high-probability reversal and continuation signals by focusing on the underlying market dynamics: momentum, liquidity, and confirmation.
This is not just another pattern indicator; it's a professional-grade tool designed to help you spot truly significant price action events.
How The Logic Works & Why It's More Accurate
Each pattern in this script has been enhanced with stricter, more intelligent rules to filter out noise and reduce false signals. Here’s what makes our logic superior:
1. The Liquidity Grab Hammer & Inverted Hammer
Standard Logic: A simple hammer shows a long lower wick, suggesting buyers pushed the price back up.
Our Enhanced Logic: We don't just look for a hammer shape. Our signal is only valid if the hammer’s low takes out the low of the previous candle (a "liquidity grab" or "stop hunt").
Why It's More Accurate: This sequence is incredibly powerful. It shows that sellers attempted to push the market lower, triggered stop-loss orders below the prior low, and then were decisively overpowered by buyers who reversed the price. This isn't just a reversal; it's a failed breakdown, often trapping sellers and fueling a stronger move in the opposite direction.
2. The "True" Bullish & Bearish Harami
Standard Logic: A small candle forms within the high-low range of the previous candle. This can often be misleading if the prior candle has long wicks and a tiny body.
Our Enhanced Logic: We enforce a "dual containment" rule. For a Harami to be valid, its body must be contained within the body of the previous candle. We also ensure the Harami candle itself is not a Doji, meaning it must show some conviction.
Why It's More Accurate: This ensures you are seeing a genuine and significant contraction in momentum. It filters out scenarios where a large-bodied candle forms inside the wicks of a doji-like candle, which is not a true Harami. Our logic captures the "pregnant" pattern as it was intended—a moment of quiet consolidation before a potential new move.
3. The "Power" Bullish & Bearish Engulfing
Standard Logic: A candle's body engulfs the body of the previous candle. This is a common signal, but it often lacks follow-through.
Our Enhanced Logic: Our "Power Engulfing" requires two conditions: (1) The body must engulf the prior candle's body, AND (2) the candle must close beyond the entire high/low range of the prior candle.
Why It's More Accurate: This is the ultimate sign of confirmation. It doesn't just show that one side has won the battle for the session; it proves they had enough force to break the entire structure of the previous candle. This signifies immense momentum and dramatically increases the probability that the trend will continue in the direction of the engulfing candle.
4. The Quantified Doji
Our Logic: Instead of being a subjective pattern, a Doji is defined quantitatively. It's a candle whose body is less than or equal to a user-defined percentage (default 9%) of its total range.
Why It's More Accurate: It provides a consistent and objective measure of market indecision. Furthermore, any candle identified as a Doji is automatically disqualified from being a Hammer, ensuring clear and distinct signals.
User Customization
Toggle Patterns On/Off: Declutter your chart by only showing the patterns you want to see.
Fine-Tune Logic: Use the "Pattern Logic" settings to adjust the sensitivity of the Doji and Harami detectors to perfectly match your trading style, asset, and timeframe.
Disclaimer: This indicator is a powerful tool for identifying high-probability price action. However, no single indicator is a complete trading system. Always use these signals as part of a comprehensive strategy, combined with analysis of market structure, support/resistance levels, and other forms of confluence.

Previous Day/Week/Month - High/Lows + Open/Close (RC) 1.0it is an indicator for Previous Day, Week, Month's, Open-High-Low-Close

Engulfing CandlesDetects Engulfing Candles with tha addition of an extra condition so that the volume of the engulfing candle is greater than the volume of the last four candles

Previous Day/Week/Month - High/Lows + Open/Close (RC)Its an indicator for previous day, week, month's OPEN HIGH LOW CLOSE

Perfect MA Touch – Full Setup 1,3,5,7,8,9This indicator helps you track a precise candle countdown from a moving average touch, labeling key bars (1, 3, 5, 7, 8, 9) for timing entries and momentum setups — with optional coloring, alerts, and full customization.
What It Detects
1. MA Touch Trigger
The sequence starts when any selected moving average (up to 6 MAs, customizable) is touched by the candle's high/low range.
This "perfect touch" initiates the count and labels that candle as "1".
2. Candle Number Labels
After a perfect MA touch:
Candle 1 = the bar that touches the MA
Candle 3 = two bars after Candle 1
Candle 5 = the fifth bar after the touch
Candle 7 = third bar after Candle 5
Candle 8 = fourth bar after Candle 5
Candle 9 = fifth bar after Candle 5
It creates a time-based sequence you can use to anticipate reactions or momentum shifts.
3. Customization
You can:
Choose between EMA or SMA for each MA (6 total)
Set custom lengths for each MA (9, 20, 50, 100, 150, 200)
Choose which candle numbers (1, 3, 5, 7, 8, 9) to highlight
Pick font size and label color
4. Highlighting and Alerts
Highlight candles (with color) when certain bars (like 3, 5, 7) print
Alerts are available for all tracked bars (1, 3, 5, 7, 8, 9)
Use Case Example
Let’s say you want to enter trades on the 3rd candle after a perfect MA touch:
You set the script to highlight candle 3.
When a candle hits your chosen MA (say EMA 9), it’s labeled “1”.
Two bars later, bar 3 appears — giving you a timed signal to enter if price behavior aligns.
This method is especially useful when paired with:
Volume confirmation
Breakout or reversal patterns
Support/resistance or order block zones

cd_secret_candlestick_patterns_CxHi traders,
With this indicator, we aim to uncover secret candlestick formations that even advanced traders may miss—especially those that can't be detected by classic pattern indicators, unless you're a true master of candlestick patterns or candle math.
________________________________________
General Idea:
We'll try to identify candlestick patterns by regrouping candles into custom-sized segments that you define.
You might ask: “Why do I need this? I can just look at different timeframes and spot the structure anyway.” But it’s not the same.
For example, if you're using a 1-minute chart and add a higher-timeframe candle overlay (like 5-minute), the candles you see start at fixed timestamps like 0, 5, 10, etc.
However, in this indicator, we redraw new candles by grouping them from the current candle backward in batches of five.
These candles won't match the standard view—only when aligned with exact time multiples (e.g., 0 and 5 minutes) will they look the same.
In classic charts:
• You see 5-minute candles that begin every 0 and 5 minutes.
In this tool:
• You see a continuously updating set of 5 merged 1-minute candles redrawn every minute.
What about the structures forming in between those fixed timeframes?
That’s exactly what we’ll be able to detect—while also making the lower timeframe chart more readable.
________________________________________
Candle Merging:
Let’s continue with an example.
Assume we choose to merge 5 candles. Then the new candle will be formed using:
open = open
close = close
high = math.max(high , high , high , high , high)
low = math.min(low , low , low , low , low)
This logic continues backward on the chart, creating merged candles in groups of 5.
Since the selected patterns are made up of 3, 4, or 5 candles, we redraw 5 such merged candles to analyze.
________________________________________
Which Patterns Are Included?
A total of 18 bullish and bearish patterns are included.
You’ll find both widely known formations and a few personal ones I use, marked as (MeReT).
You can find the pattern list and visual reference here:
________________________________________
Entry and Filtering Suggestions:
Let me say this clearly:
Entering a trade every time a pattern forms will not make you profitable in the long run.
You need a clear trade plan and should only act when you can answer questions like:
• Where did the pattern appear?
• When and under what conditions?
It’s more effective to trade in the direction of the trend and look for setups around support/resistance, supply/demand zones, key levels, or areas confirmed by other indicators.
Whether you enter immediately after the pattern or wait for a retest is a personal choice—but risk management is non-negotiable.
One of the optional filters I’ve included is a Higher Timeframe (HTF) condition, which is my personal preference:
When enabled, the highest or lowest price among the pattern candles must match the high or low of the current HTF candle.
You can see in the image below the decrease in the number of detected patterns on the 1-minute chart when using no filter (blue labels) compared to when the 1-hour timeframe filter is applied (red labels).
Additionally, I’ve added a “protected” condition for engulfing patterns to help filter out weak classic engulf patterns.
________________________________________
Settings:
From the menu, you can configure:
• Number of candles for regrouping
• Distance between the last candle and newly drawn candles
• Show/hide options
• HTF filter toggle and timeframe selection
• Color, label placement, and text customization
• Pattern list (select which to display or trigger alerts for)
My preferred setup:
While trading on the 1-minute chart, I typically set the higher timeframe to 15m or 1H, and switch the candle count between 2 and 3 depending on the situation.
⚠️ Important note:
The “Show” and “Alert” options are controlled by a single command.
Alerts are automatically created for any pattern you choose to display.
________________________________________
What’s Next?
In future updates, I plan to add:
• Pattern success rate statistics
• Multi-broker confirmation for pattern validation
Lastly, keep in mind:
The more candles a pattern is based on, the more reliable it may be.
I'd love to hear your feedback and suggestions.
Cheerful trading! 🕊️📈

Opening Range BoxOpening Range plots the price range of the first candle from a selected timeframe within a defined trading session. It highlights key intraday levels and visually extends that range across the session, helping traders spot breakout or reversal setups.

Last Candle RangeCalculates the size of the last candle on whatever timeframe you are watching (high - low)

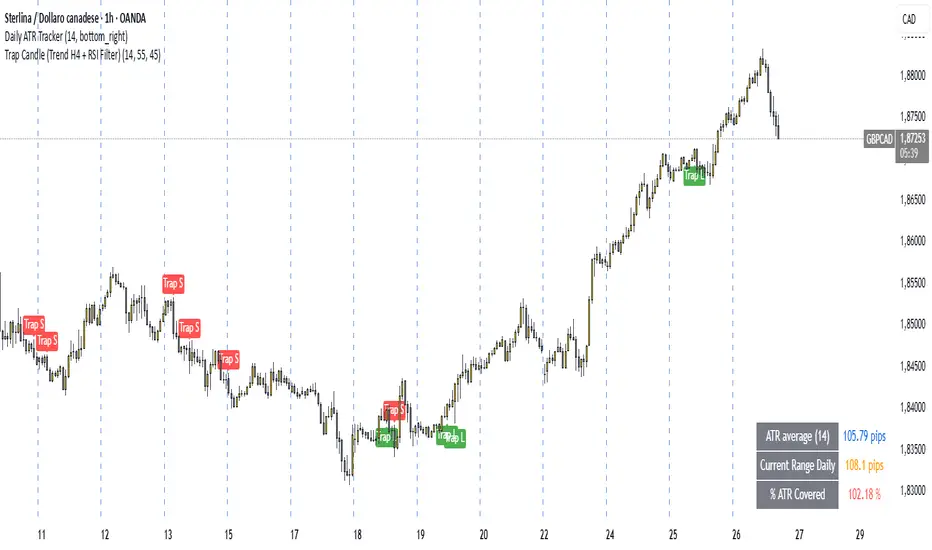
Trap Candle (Trend H4 + RSI Filter)🔍 Trap Candle (Trend H4 + RSI Filter)
Description:
The Trap Candle indicator is designed to identify a specific and powerful two-candle price action pattern that often signals a false breakout followed by a strong reversal. It combines pure price action with two objective filters to increase signal quality and trend alignment.
📊 Pattern Logic:
Bullish Trap: The current candle breaks the previous candle’s low, but closes above its high (and is bullish).
Bearish Trap: The current candle breaks the previous candle’s high, but closes below its low (and is bearish).
This pattern often reveals institutional traps or stop hunts before directional movement.
🧠 Trend Filter (H4):
Ensures long signals occur only when the H4 close is higher than the previous H4 close (uptrend).
Ensures short signals occur only in a H4 downtrend.
Designed to align intraday entries (M15, H1) with higher timeframe momentum.
💪 RSI Confirmation:
Includes a configurable RSI filter on the current timeframe.
Only long signals are shown when RSI is above a user-defined threshold (e.g. 55).
Only short signals are shown when RSI is below a user-defined threshold (e.g. 45).
⚙️ Key Features:
Full customization of RSI period and thresholds.
Clean, visual signal plotting on the chart (with “Trap L” or “Trap S” labels).
Built-in alerts for both long and short trap candle setups.
Perfect for traders who want to trade smart reversals with trend and momentum confirmation.
✅ Recommended Timeframes:
M15 and H1 (entry)
Uses H4 for trend bias
If you’re looking to filter out noise and spot only the highest quality reversal setups, the Trap Candle (Trend H4 + RSI Filter) is a solid tool for any price action-based strategy.
First Candle🕯️ First Candle Indicator (First 5-Minute Candle High/Low)
The First Candle indicator automatically marks the high and low of the first 5-minute candle of the U.S. trading session . These levels can act as key intraday support and resistance zones, often used in breakout, scalping, or opening-range trading strategies.
📌 Key Features:
Automatic detection of the first candle of the U.S. session based on the selected timeframe (default is 5 minutes).
Horizontal lines are plotted at the high and low of that candle, with fully customizable colors and thickness.
Labels show the exact level and timeframe used for the high and low.
Resets daily, removing previous session data at the start of a new session.
Displays a visual marker (blue triangle) when the first candle is detected.
Allows users to select different timeframes for defining the "first candle" (e.g., 1, 5, 15 minutes).
⚙️ Customizable Inputs:
Show First Candle Lines: toggle the display of high/low lines.
Timeframe for Marking: choose the timeframe to detect the first candle (e.g., 5 minutes).
High Line Color / Low Line Color: set the color of each level line.
Line Thickness: adjust the width of the lines (1 to 5 pixels).
🧠 Strategic Applications:
Identify breakout zones right after the market opens.
Define opening range for pullback or continuation setups.
Set clear reference levels for intraday trading decisions.


RSI, EMA, and SMAit is a script that will add EMA RSI and SMA for you .
its helpful if you don't have a plan .
Thankyou :)
