HalfTrend cross 2.0 LcfxCore Functionality
HalfTrend Baseline
Plots a dynamic trend-following line that alternates between blue (bullish) and red (bearish)
Uses amplitude and channel deviation settings to adapt to market volatility
Shows ATR-based channels around the trend line (optional)
Key Signals:
Reversal Signals: Traditional arrows at trend reversal points
Cross Signals: Basic "B"/"S" labels when price crosses the HalfTrend line
Re-Cross Signals: Special "RB"/"RS" labels for strategic re-entry opportunities
Unique Re-Cross Logic
Bullish Trend:
Triggers RB (Re-Cross Buy) only when:
Price first crosses BELOW HalfTrend (bearish cross)
Then crosses BACK ABOVE HalfTrend
Only the FIRST such occurrence in current bullish trend
Bright green "RB" label
Bearish Trend:
Triggers RS (Re-Cross Sell) only when:
Price first crosses ABOVE HalfTrend (bullish cross)
Then crosses BACK BELOW HalfTrend
Only the FIRST such occurrence in current bearish trend
Orange "RS" label
Smart Signal Management
Prevents signal spam by allowing only one re-cross signal per trend phase
Automatically resets signals when trend reverses
Dedicated alerts for all signal types
Customizable visual elements (colors, channels, arrows)
Practical Use Case
Identifies high-probability continuation entries:
RB signals: Potential add-to-position points in uptrends after minor pullbacks
RS signals: Shorting opportunities in downtrends after dead-cat bounces
This enhanced version reduces noise while highlighting strategic trade setups where price temporarily violates the trend line but quickly reconfirms the dominant trend direction.
Candlestick analysis


Red Report FilterHello Traders,
This script will make your everyday trading sessions a lot less stressful if you're having to watch for 'Red' restricted reports.
You can set up to five reports for the day, with a selector for either: 'Red' / 'Orange'
Super simple to update manually, usually less than 15s. You do need to pull the information from ForexFactory.com or your required feed daily.
No need to worry about audio fails; the alarm background visually updates as price candles start to sweep thru the preset time window.
Default window settings are for Red Reports, '15m Before' / '6m After', for a 5m x 5m window.
I like the '15m Before' because it gives me a buffer to react to if I'm managing an open trade.
Click the tool-tip for more details.
PLEASE NOTE: Time-Zone is hard-coded UTC -4. Make the appropriate adjustment to a different zone if necessary.
Let me know how it works for you.
Thx!

Cumulative Volume Delta with MAdelta scirpt with single ma , good on 5 minute for single ma and higher time framess

Volume bar range# Volume Bar Range (VBR) Indicator
## Overview
The Volume Bar Range indicator identifies key support and resistance levels based on high-volume price bars. It creates a visual range that represents significant price levels where the market has shown strong interest through volume confirmation.
## Features
### Visual Range Display
- **Blue/Aqua Area**: Shows the price range of the highest volume bar within the lookback period
- **Dynamic Color**: The fill color changes to indicate whether the range is stable (aqua) or newly updated (white)
- **Boundary Lines**: Invisible white lines mark the upper and lower boundaries of the range
### Trading Signals
- **BUY Signal**: Blue upward arrow appears when price breaks above the resistance level with volume confirmation
- **SELL Signal**: Black downward arrow appears when price breaks below the support level with volume confirmation
## How to Use
### Setup
1. Apply the indicator to any chart
2. The indicator automatically identifies the highest volume bar in the last 55 periods
3. The price range of this high-volume bar becomes your support/resistance zone
### Trading Strategy
- **Range Trading**: Trade within the identified support/resistance range
- **Breakout Trading**: Enter positions when price breaks above resistance (BUY) or below support (SELL)
- **Volume Confirmation**: Only take signals when current volume exceeds the 21-period average
### Signal Interpretation
- **BUY Signal**: Price closes above the resistance level with above-average volume
- **SELL Signal**: Price closes below the support level with above-average volume
- **No Signal**: Price remains within the range or volume is insufficient
## Key Parameters
- **Lookback Period**: 55 bars (automatically identifies the highest volume bar)
- **Volume MA**: 21-period simple moving average for volume confirmation
- **Signal Size**: Tiny markers to avoid chart clutter
## Best Practices
- Use on multiple timeframes for confirmation
- Combine with other technical indicators for stronger signals
- Pay attention to the color changes in the range area
- Consider market context and overall trend direction
## Ideal Markets
- Works well on liquid markets with consistent volume patterns
- Effective on stocks, forex, and crypto markets
- Best suited for swing trading and medium-term analysis
This indicator is particularly useful for traders who rely on volume analysis and want to identify key price levels where the market has shown significant interest.

All SMAs Bullish/Bearish ScreenerTitle: All SMAs Bullish/Bearish Screener: Uncover Powerful Trend Alignment
Description:
Are you tired of sifting through countless charts, desperately trying to find stocks that are truly trending? Do you seek clear, unequivocal signals that scream "Buy!" or "Sell!" based on robust price action? Look no further. Introducing the "All SMAs Bullish/Bearish Screener," a powerful yet elegantly simple Pine Script indicator designed to pinpoint stocks where the current price is in absolute harmony (or discord) with a comprehensive suite of Simple Moving Averages.
The Power of Confluence: Why This Indicator Matters
In the dynamic world of trading, strong trends are often characterized by significant alignment across multiple timeframes. This indicator is built on the profound principle of Moving Average Confluence. Instead of just looking at one or two moving averages, this screener meticulously analyzes the relationship between the current closing price and six critical Simple Moving Averages (SMAs): the 5, 10, 20, 50, 100, and 200-period SMAs.
When the price is trading above ALL these moving averages – from the shortest-term (5-period) to the longest-term (200-period) – it's a powerful declaration of unwavering bullish momentum. This often signifies strong institutional buying, a clear accumulation phase, and a robust uptrend across all market horizons. Imagine easily identifying stocks like the one pictured (SAIL), where price confidently rides above every key average, signaling a prime opportunity.
Conversely, when the price is trading below ALL these moving averages, it indicates a severe and widespread bearish bias. This is a warning sign, often preceding further declines, suggesting strong distribution, and a downtrend that impacts every time horizon.
What This Script Delivers:
Unambiguous Trend Identification: Quickly identify stocks exhibiting exceptionally strong bullish or bearish trends. No more guessing – the alignment of all SMAs provides undeniable clarity.
Customizable SMA Lengths: Tailor the moving average periods to your specific trading style and preferred timeframes. Whether you prefer slightly different short, medium, or long-term averages, you have full control via user-friendly input settings.
Instant Visual Cues: The indicator visually highlights these rare and significant conditions directly on your chart:
A green triangle-up signal appears below the bar when all SMAs are bullish.
A red triangle-down signal appears above the bar when all SMAs are bearish.
The chart background color will subtly shift to lime green for bullish alignment and red for bearish alignment, providing immediate visual feedback at a glance.
Real-time Screener Capability (via TradingView Alerts): This is where the true power of this script shines for efficient trading. Set up custom alerts on TradingView for "All SMAs Bullish" or "All SMAs Bearish" conditions. Receive instant notifications (email, mobile, webhook) on any stock in your watchlist that meets these stringent criteria, allowing you to react swiftly to high-probability setups without constant chart monitoring. The alert message even tells you the ticker!
On-Chart Status Display: A clear, concise status message is displayed directly on your chart, indicating "Current Price is ABOVE ALL SMAs (Bullish)", "Current Price is BELOW ALL SMAs (Bearish)", or "SMAs are Mixed," ensuring you're always aware of the prevailing condition.
Who is This For?
This indicator is invaluable for:
Trend Followers: Identify robust trends early and ride them for significant gains.
Swing Traders: Spot strong directional momentum for intermediate-term trades.
Long-Term Investors: Confirm the health and direction of fundamental trends.
Screener Enthusiasts: Automate your market scanning to find the cleanest setups.
Stop wasting time on ambiguous charts. Leverage the "All SMAs Bullish/Bearish Screener" to gain an edge, simplify your analysis, and focus only on the highest conviction trend opportunities. Add it to your favorites today and transform your trading workflow!
#PineScript #TradingView #SMA #MovingAverage #TrendFollowing #StockScreener #TechnicalAnalysis #Bullish #Bearish #MarketScanner

BTC vs 美元指数(DXY) 强度指标1. Introduction
一、 指标简介
In the grand game of macroeconomics, the relationship between Bitcoin (BTC) and the US Dollar Index (DXY) is a key barometer for market risk appetite versus risk-aversion.
在宏观经济的大棋局中,比特币(BTC)与美元指数(DXY)的强弱关系,是衡量市场风险偏好与避险情绪的核心风向标。
It is often said that "BTC is a hedge against a falling dollar." This indicator is built upon this classic logic, providing you with a quantitative and intuitive analytical tool.
交易员们常说「BTC 是抗美元下跌的工具」,本指标正是基于这一经典逻辑,为您提供一个量化、直观的分析工具。
The BTC vs. DXY Strength Index helps you gain insight into critical questions by calculating the relative performance spread between the two assets, combined with statistical tools (Bollinger Bands) and significant historical macro signals (DXY weekly death cross):
BTC vs 美元指数(DXY) 强度指标 通过计算两者的相对表现差异,并结合统计学工具(布林带)和重要的历史宏观信号(DXY周线死叉),帮助您洞察以下关键问题:
Is the current market dominated by BTC (risk-on) or the Dollar (risk-off)?
当前市场由 BTC 主导(风险偏好),还是由美元主导(避险情绪)?
Has the strength relationship between them reached an extreme level where a reversal is possible?
两者之间的强弱关系是否达到了可能逆转的极端水平?
Has a major macro reversal signal, which has historically triggered significant market shifts, appeared?
是否出现了历史上曾多次引发市场巨变的宏观反转信号?
2. Features & Interpretation
二、 核心功能与解读
2.1. Performance Spread Histogram
1. 强度差柱状图
The core of the indicator is a histogram extending from the zero line, representing the performance spread of BTC relative to DXY.
指标的核心是一系列从 0 轴延伸的柱状图,它代表了 BTC 相对于 DXY 的表现强度差。
Green Bars (Positive Value): Indicates that BTC has outperformed the DXY over the period. The taller the green bar, the stronger BTC's momentum and the higher the market's risk appetite.
绿色柱 (正值): 代表在该周期内,BTC 的表现优于美元指数。绿色柱越高,说明 BTC 越强势,市场风险偏好情绪越高。
Red Bars (Negative Value): Indicates that the DXY has outperformed BTC. The deeper the red bar, the stronger the Dollar and the more prevalent the risk-off sentiment.
红色柱 (负值): 代表在该周期内,美元指数的表现优于 BTC。红色柱越深,说明美元越强势,市场避险情绪越浓。
2.2. Bollinger Bands Extreme Signal
2. 布林带极端信号
The indicator calculates Bollinger Bands for the "performance spread" in the background. When the histogram breaks above or below the bands, an alert is triggered.
指标在后台对「强度差」计算布林带。当柱状图突破上下轨时,会触发警报。
Breakout Above Upper Band: BTC's strength relative to DXY has reached a statistical extreme, signaling caution for a potential mean reversion (e.g., a BTC pullback or DXY strengthening).
向上突破: BTC 相对于 DXY 的强势达到了统计上的极端,警惕短期关系回归(例如 BTC 回调或 DXY 走强)。
Breakdown Below Lower Band: BTC's weakness relative to DXY has reached a statistical extreme, signaling a potential opportunity for a bounce (e.g., BTC strengthening or DXY pulling back).
向下突破: BTC 相对于 DXY 的弱势达到了统计上的极端,关注潜在的反弹机会(例如 BTC 走强或 DXY 回调)。
2.3. DXY Historical Anomaly Signal
3. DXY 历史规律信号
This is the essence of this indicator. Based on research from Coindesk analysts, the "Death Cross" (50-week MA crossing below the 200-week MA) on the DXY weekly chart has often acted as a contrarian indicator—a "bear trap"—since 2009.
这是本指标的精髓所在。根据 Coindesk 分析师的研究,自 2009 年以来,美元指数(DXY)周线级别的「死亡交叉」(50周均线下穿200周均线)往往是一个反向指标,即「空头陷阱」。
Instead of preceding a bear market for the dollar, it has repeatedly marked major cyclical bottoms for the DXY.
它非但没有引发美元的熊市,反而屡次成为美元阶段性大底的标志。
Blue Background Highlight: When the indicator detects a "Death Cross" on the DXY weekly chart, the background will turn blue, and a high-priority alert will be triggered. This is designed to warn you that, based on historical patterns, the US Dollar may be about to bottom and strengthen, posing a significant potential bearish risk for BTC.
蓝色背景高亮: 当指标检测到 DXY 周线图上形成「死亡交叉」时,指标背景会变为蓝色,并触发最高优先级的警报。这旨在提醒您:根据历史规律,美元可能即将见底走强,这对 BTC 构成潜在的重大利空风险,需高度警惕!
3. Settings
三、 主要功能与设定
Customizable symbols for BTC and DXY.
可自定义 BTC 和 DXY 的交易对。
Freely adjustable periods for performance calculation and Bollinger Bands.
可自由调整表现计算周期、布林带参数。
Configurable MA periods for the DXY Death Cross detection, with the ability to toggle this signal on or off.
可配置 DXY 死亡交叉的均线周期,并自由开关此信号的显示。
Includes a comprehensive info panel and alert system.
包含功能全面的信息面板与警报系统。
Disclaimer: This indicator is a tool for supplementary macro analysis and is intended to provide a reference for market sentiment. It does not constitute any investment advice. All trading decisions should be based on your own research and risk assessment. Happy trading!
免责声明: 本指标是辅助宏观分析的工具,旨在提供市场情绪的参考,不构成任何投资建议。所有交易决策都应基于您自己的研究和风险判断。祝您交易顺利!

Dynamic Candle Strength Color + SL Zones (Clean)Shows Sl levels and candles that are larger than your SL

15-Min ORB Indicator with Breakout Targets **What this indicator does:**
The 15-Min ORB (Opening Range Breakout) Indicator helps traders spot breakout trades by automatically detecting the high and low of the first 15 minutes after a session opens. It then monitors for breakouts above or below this range and plots dynamic take-profit levels based on your chosen multipliers.
**How it works:**
You set the start time for your session (hour and minute) in the settings.
The indicator marks the high and low during the first 15 minutes after your chosen open time, drawing lines on the chart and, if enabled, labels for these levels.
If price breaks above the 15-min high, a potential long breakout is identified; if it breaks below the low, a potential short breakout is detected.
Upon a breakout, the script calculates the distance from the entry (breakout) to the opposite side of the 15-min range and uses your input multipliers to project two take-profit levels (TP1/TP2).
All lines and labels (for the range and targets) can be individually toggled on or off in the settings.
Both the 15-min range and the targets can be styled (color, line style, label position).
**How to use it:**
Add the indicator to your chart.
Set the session start hour and minute to match your instrument’s open (e.g., 9:30 for US stocks or futures).
Use the settings to customize which levels and labels are shown, their appearance, and the target expansion multiples.
When price breaks out above or below the opening range, the script will plot TP1 and TP2 lines at your chosen risk/reward multiples, and label them if desired.
You can use the visual levels for trade entries, profit taking, or alerts.
**What makes it unique and useful:** >
Unlike many basic ORB indicators, this script not only marks the opening range but also tracks breakouts, auto-plots your profit targets based on range expansion, and gives you full control over display (styles, toggles, and label positions).
The TP targets are dynamic and can be set to any multiples, adapting to your risk/reward plan and breakout style.
Everything is customizable for your own session times, instrument, or trading approach.
**Typical uses:**
Intraday traders looking for clear breakout setups around the session open.
Automated R-multiple target planning for both long and short trades.
Visualizing volatility and measuring early price expansion.

Vector CandlesSimple buy and sell alert on vectors. Works well on 4h. Standard settings are 70% candle must be body, with min 1.5 vol on the candle on 20 ma loopback.


AZ Dynamic Trend Indicator with Heikin-Ashi### Dynamic Trend Indicator with Heikin-Ashi (v2.7)
**Effortlessly identify trends and reversals** with this versatile tool combining multi-timeframe analysis, adaptive moving averages, and Heikin-Ashi smoothing. Here's what it offers:
#### 🔍 **Core Features**
1. **Dual Timeframe Analysis**:
- Track trends on higher timeframes (e.g., 1H/D) while viewing signals on your current chart.
- Toggle between **Heikin-Ashi** or standard candles for cleaner trend visualization.
2. **8 Customizable MAs**:
- Choose from **ALMA, HMA, SMA, SWMA, VWMA, WMA, ZLEMA, or EMA** with adjustable periods.
- Unique "Trend Strength" metric: `(MA_Close - MA_Open) / (MA_High - MA_Low)` highlights momentum direction.
3. **Smart Signals**:
- **Entry/Exit**: Triangles mark crossovers between MA Close/Open.
- **Reversal Alerts**: Detects counter-trend moves within a user-defined window (default: 3 bars) after signals.
- Color-coded plots: Bullish (🟢), Bearish (🔴), Reversal Bull (🔵), Reversal Bear (🟠).
#### 🎨 **Visual Customization**
- Toggle **High/Low MA lines**, **Close line**, and **fill colors**.
- Adjust colors for all elements to match your chart theme.
- Hide signals or reversal markers as needed.
#### ⚙️ **Practical Use**
- **Trend Following**: Use the MA Close/Open crossover with trend fill colors to confirm direction.
- **Reversal Trading**: Capitalize on pullbacks with reversal signals (e.g., after a bearish signal, watch for Bull Reversal markers).
- **Multi-Timeframe Confirmation**: Avoid false signals by aligning higher-timeframe trends with your entries.
*Ideal for swing traders and trend riders!*
**Note**: Adjust `MA Period`, `Reversal Window`, and `Trend Timeframe` for your strategy. Disable Heikin-Ashi in choppy markets for faster reactions.
---
*Code v2.7 updates: Optimized reversal logic, added ALMA/ZLEMA support, and enhanced visual controls.*

محدد الأوقات المطور جداً v6
Determine the candle times at any hour you want. If the strategy you are working on is CRT, specify the 4-hour frame and choose the time 1-5-9.

Candle Pattern Detector By Prashanth
Bullish Signal (🟢 below candle):
Plotted when any of the following occur:
✅ Bullish Engulfing
✅ Bullish Three-Line Strike
✅ Bottom wick ≥ % threshold (default: 80%)
Bearish Signal (🔴 above candle):
Plotted when any of the following occur:
❌ Bearish Engulfing
❌ Bearish Three-Line Strike
❌ Top wick ≥ % threshold (default: 80%)
Only one signal per candle (🟢 or 🔴)
If both bullish and bearish conditions happen on same candle → no signal
Helps simplify visual clutter while scanning for strong candle patterns


First 15 Min High/Low//@version=5
indicator("First 15 Min High/Low", overlay=true)
// Define the session start time (adjust according to your market)
startHour = 9
startMinute = 30
endMinute = startMinute + 15
// Track the first 15 minutes of the day
isFirst15 = (hour == startHour and minute >= startMinute and minute < endMinute)
// New day logic
newDay = ta.change(time("D"))
// Hold values
var float first15High = na
var float first15Low = na
var bool isLocked = false
// Capture high/low during first 15 min
if newDay
first15High := na
first15Low := na
isLocked := false
if isFirst15 and not isLocked
first15High := na(first15High) ? high : math.max(high, first15High)
first15Low := na(first15Low) ? low : math.min(low, first15Low)
if not isFirst15 and not isLocked and not na(first15High) and not na(first15Low)
isLocked := true
// Plot
plot(isLocked ? first15High : na, title="First 15 Min High", color=color.green, linewidth=2, style=plot.style_line)
plot(isLocked ? first15Low : na, title="First 15 Min Low", color=color.red, linewidth=2, style=plot.style_line)

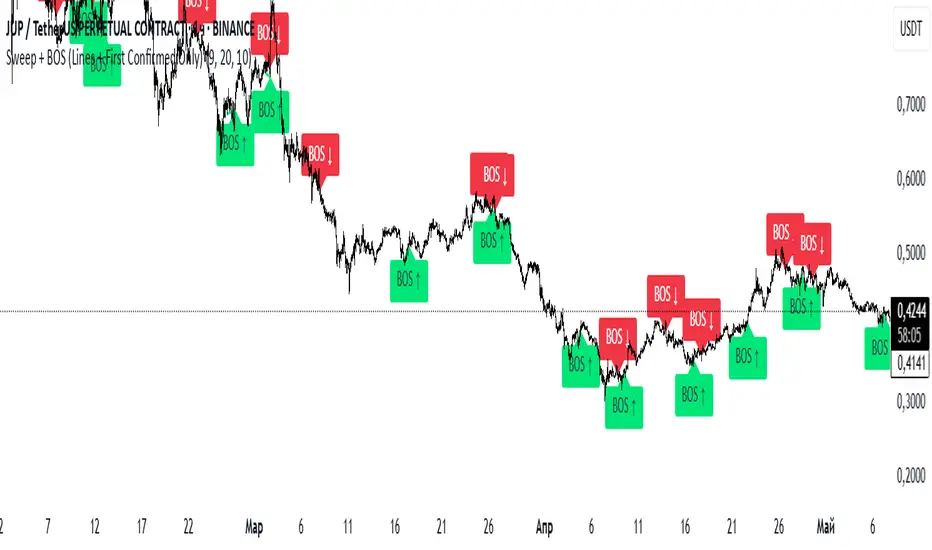
Sweep + BOS (Lines + First Confirmed Only)🔍 Indicator: Sweep + BOS (Break of Structure with Visual Lines)
🧠 Overview
This indicator combines Swing detection, Liquidity Sweeps, and Break of Structure (BOS) logic, with:
Customizable swing length,
BOS signals only after confirmed sweeps,
BOS shown only once per sweep,
Visual labels and connecting lines to highlight structure breaks clearly.
⚙️ Inputs
Swing Length:
Defines how many candles to use to identify a swing high/low. Must be an odd number (e.g., 3, 5, 7...).
Sweep Lookback Window:
Sets how far back the script checks for a sweep (false breakout over a swing).
BOS Validity After Sweep:
Number of bars within which a BOS can be considered valid after a sweep.
Toggle Options:
Show/hide:
Swing Labels
Sweep Labels
BOS Labels
BOS Connecting Lines
📌 Logic Breakdown
✅ Swings
Swing High: A candle’s high is greater than the highs of all N candles on both sides.
Swing Low: A candle’s low is lower than the lows of all N candles on both sides.
💧 Liquidity Sweeps
Sweep High:
Price spikes above a previous Swing High,
Then closes back below it (false breakout).
Sweep Low:
Price drops below a previous Swing Low,
Then closes back above it.
🔁 Break of Structure (BOS)
A BOS is only shown if:
It occurs after a valid sweep (within X bars),
It hasn’t been already plotted for that sweep,
BOS ↑ is only possible after Sweep Low,
BOS ↓ is only possible after Sweep High,
Opposite BOS type resets the last BOS state.
BOS ↑ (Bullish):
Confirmed when price closes above previous Swing High after Sweep Low.
Label appears at the candle low.
A line is drawn from the Swing Low to the BOS candle.
BOS ↓ (Bearish):
Confirmed when price closes below previous Swing Low after Sweep High.
Label appears at the candle high.
A line is drawn from the Swing High to the BOS candle.
Swing High/Low with Liquidity Sweeps🧠 Overview
This indicator identifies swing highs and swing lows based on user-defined candle lengths and checks for liquidity sweeps—situations where the price breaks a previous swing level but then closes back inside, indicating a potential false breakout or stop hunt. It also supports visual labeling and alerts for these events.
⚙️ Inputs
Swing Length (must be odd number ≥ 3):
Determines how many candles are used to identify swing highs/lows. The central candle must be higher or lower than all neighbors within the range.
Example: If swingLength = 5, the central candle must be higher/lower than the 2 candles on both sides.
Sweep Lookback (bars):
Defines how many bars to look back for possible liquidity sweeps.
Show Swing Labels (checkbox):
Optionally display labels on the chart when a swing high or low is detected.
Show Sweep Labels (checkbox):
Optionally display labels on the chart when a liquidity sweep occurs.
🕯️ Swing Detection Logic
A Swing High is detected when the high of the central candle is greater than the highs of all candles around it (as per the defined length).
A Swing Low is detected when the low of the central candle is lower than the lows of surrounding candles.
Swing labels are placed slightly above (for highs) or below (for lows) the candle.
💧 Liquidity Sweep Logic
A Sweep High is triggered if:
The current high breaks above a previously detected swing high,
And then the candle closes below that swing high,
Within the configured lookback window.
A Sweep Low is triggered if:
The current low breaks below a previous swing low,
And then closes above it,
Within the lookback window.
These are often seen as stop hunts or fake breakouts.
🔔 Alerts
Sweep High Alert: Triggered when a sweep above a swing high occurs.
Sweep Low Alert: Triggered when a sweep below a swing low occurs.
You can use these to set up TradingView alerts to notify you of potential liquidity grabs.
📊 Use Cases
Identifying market structure shifts.
Spotting fake breakouts and potential reversals.
Assisting in smart money concepts and liquidity-based trading.
Supporting entry timing in trend continuation or reversal strategies.

Simple Bollinger BandsBollinger Bands are a popular technical analysis indicator used to measure market volatility and identify potential overbought or oversold conditions.
This script plots:
A middle band (20-period Simple Moving Average)
An upper band (SMA + 2 standard deviations)
A lower band (SMA – 2 standard deviations)

Alt Market Index (Halving-Adjusted BTC Supply, EMA)
암호화폐 알트코인 시총 상위 125개를 모아서
나스닥 기반의 계산식을 활용한 알트코인지수125를 만들었습니다.
반감기에 따른 비트코인 하루 채굴량 갯수 추가까지 포함한 버전입니다.
일봉이 기준이 됩니다.
I created the Altcoin Index 125 by compiling the top 125 altcoins by market capitalization in the cryptocurrency market, using a calculation method based on the Nasdaq index.
This version also includes adjustments for Bitcoin’s halving events, reflecting changes in daily mining output. The index is based on daily candles.

Dynamic Sniper ProDynamic Sniper Pro - Binary Options Signal
Description:
Dynamic Sniper Pro is a powerful Pine Script v6 indicator designed for binary options trading. It combines Exponential Moving Averages (EMAs), Relative Strength Index (RSI), and an optional ATR filter to generate precise buy and sell signals. Ideal for short-term charts like 1-minute, this indicator helps traders spot trend reversals and breakouts with clear visual arrows. Tested on CAD/JPY, it recently delivered actionable signals during the morning session on July 01, 2025.
How It Works:
Buy Signal (Green Arrow): Triggered when the closing price exceeds both the 3-period Fast EMA and 8-period Slow EMA, RSI drops below the oversold level (default 40), and (if ATR filter is on) the price breaks above the Slow EMA + 0.15 * ATR. Enter a call option at the next candle open.
Sell Signal (Red Arrow): Triggered when the closing price falls below both EMAs, RSI rises above the overbought level (default 60), and (if ATR filter is on) the price breaks below the Slow EMA - 0.15 * ATR. Enter a put option at the next candle open.
Key Features:
Customizable parameters: Adjust EMA lengths, RSI periods, oversold/overbought levels, and ATR multiplier.
Optional ATR filter to reduce whipsaw entries.
Visual alerts with arrows and background highlights.
Compatible with any forex pair or timeframe—optimize for your strategy!
Settings:
Fast EMA Length: 3 (short-term trend)
Slow EMA Length: 8 (trend confirmation)
RSI Length: 14 (default smoothness)
Oversold Level: 40 (tweak for sensitivity)
Overbought Level: 60 (tweak for sensitivity)
Use ATR Filter: True (optional)
ATR Length: 14
ATR Multiplier: 0.3 (adjust for breakout strength)
Performance:
Backtesting on CAD/JPY 1-minute from 10:34–11:34 AM PDT on July 01, 2025, showed promising signal frequency. Results may vary—test on your preferred asset.
Tips:
Set alerts via the "Alerts" tab for real-time notifications.
Adjust oversold/overbought levels (e.g., 45/55) for fewer/more signals.
Best on volatile pairs like CAD/JPY or EUR/USD.
Disclaimer:
This indicator is for educational purposes only. Past performance is not indicative of future results. Use at your own risk, and consider market conditions and risk management.

LaCrazy Smash CandleLaCrazy Smash Candle highlights powerful engulfing candles that signal potential momentum reversals or breakout continuation.
Smash Long: The candle's low touches or dips below the prior candle's low, then closes above the previous high with a strong body (minimum % of the candle range).
Smash Short: The candle's high touches or exceeds the prior high, then closes below the previous low with a strong body.
These “Smash” moves often occur at key pivot points, signaling decisive rejections or trend continuation. Customize the body strength filter to match your strategy needs.

MaxEvolved v2 - UT BotA powerful aggregate of indicators. Uses UT Bot, EMA, RSI, MACD & Hull MA to determine a potential position.
Drawing X means UT Bot and RSI crossing conditions are met.
Drawing big BUY or SELL signal means all conditions are met.
Un puissant agrégat d'indicateurs. Utilise UT Bot, EMA, RSI, MACD& Hull MA pour déterminer une position potentielle.
