OBV Osc (No Same-Bar Exit)//@version=5
strategy("OBV Osc (No Same-Bar Exit)", overlay=true, default_qty_type=strategy.percent_of_equity, default_qty_value=100)
// === JSON ALERT STRINGS ===
callBuyJSON = 'ANSHUL '
callExtJSON = 'ANSHUL '
putBuyJSON = 'ANSHUL '
putExtJSON = 'ANSHUL '
// === INPUTS ===
length = input.int(20, title="OBV EMA Length")
sl_pct = input.float(1.0, title="Stop Loss %", minval=0.1)
tp_pct = input.float(2.0, title="Take Profit %", minval=0.1)
trail_pct = input.float(0.5, title="Trailing Stop %", minval=0.1)
// === OBV OSCILLATOR CALC ===
src = close
obv = ta.cum(ta.change(src) > 0 ? volume : ta.change(src) < 0 ? -volume : 0)
obv_ema = ta.ema(obv, length)
obv_osc = obv - obv_ema
// === SIGNALS ===
longCondition = ta.crossover(obv_osc, 0) and strategy.position_size == 0
shortCondition = ta.crossunder(obv_osc, 0) and strategy.position_size == 0
// === RISK SETTINGS ===
longStop = close * (1 - sl_pct / 100)
longTarget = close * (1 + tp_pct / 100)
shortStop = close * (1 + sl_pct / 100)
shortTarget = close * (1 - tp_pct / 100)
trailPoints = close * trail_pct / 100
// === ENTRY BAR TRACKING TO PREVENT SAME-BAR EXIT ===
var int entryBar = na
// === STRATEGY ENTRY ===
if longCondition
strategy.entry("Long", strategy.long)
entryBar := bar_index
alert(callBuyJSON, alert.freq_all)
label.new(bar_index, low, text="BUY CALL", style=label.style_label_up, color=color.new(color.green, 85), textcolor=color.black)
if shortCondition
strategy.entry("Short", strategy.short)
entryBar := bar_index
alert(putBuyJSON, alert.freq_all)
label.new(bar_index, high, text="BUY PUT", style=label.style_label_down, color=color.new(color.red, 85), textcolor=color.black)
// === EXIT ONLY IF BAR_INDEX > entryBar (NO SAME-BAR EXIT) ===
canExitLong = strategy.position_size > 0 and bar_index > entryBar
canExitShort = strategy.position_size < 0 and bar_index > entryBar
if canExitLong
strategy.exit("Exit Long", from_entry="Long", stop=longStop, limit=longTarget, trail_points=trailPoints, trail_offset=trailPoints)
if canExitShort
strategy.exit("Exit Short", from_entry="Short", stop=shortStop, limit=shortTarget, trail_points=trailPoints, trail_offset=trailPoints)
// === TRACK ENTRY/EXIT FOR ALERTS ===
posNow = strategy.position_size
posPrev = nz(strategy.position_size )
longExit = posPrev == 1 and posNow == 0
shortExit = posPrev == -1 and posNow == 0
if longExit
alert(callExtJSON, alert.freq_all)
label.new(bar_index, high, text="EXIT CALL", style=label.style_label_down, color=color.new(color.blue, 85), textcolor=color.black)
if shortExit
alert(putExtJSON, alert.freq_all)
label.new(bar_index, low, text="EXIT PUT", style=label.style_label_up, color=color.new(color.orange, 85), textcolor=color.black)
// === PLOTS ===
plot(obv_osc, title="OBV Oscillator", color=obv_osc > 0 ? color.green : color.red, linewidth=2)
hline(0, color=color.gray)
Options

MACD + MA 2-Min Binary Options Strategy (Strategy Mode)📈 "MACD + MA Crossover Momentum Strategy" (2-Minute Expiry)
✅ Objective:
Catch short-term momentum in the direction of the trend confirmed by MACD crossover and MA alignment.
🧰 Strategy Setup
🕒 Chart Timeframe:
15-second or 30-second candles
(2-minute expiry = 4–8 candles ahead)
📊 Indicators:
EMA 5 (fast)
EMA 13 (slow)
MACD (12, 26, 9) – Standard settings
(Optional): Support/Resistance zones (manual or indicator)
🟩 Call (Buy) Conditions:
EMA 5 crosses above EMA 13
MACD Line crosses above the Signal Line (MACD crossover happens after or at the same time as EMA cross)
MACD histogram is increasing (momentum rising)
Price is above both EMAs, confirming trend strength
No major resistance or news in the next 2 minutes
🟨 Enter on the close of the confirmation candle. Set expiry: 2 minutes from entry.
🟥 Put (Sell) Conditions:
EMA 5 crosses below EMA 13
MACD Line crosses below Signal Line
MACD histogram is decreasing
Price is below both EMAs
No support zone or news in next 2 minutes
✅ Additional Entry Filters
Only trade in the direction of the higher timeframe trend (check 5-minute chart to confirm)
Avoid trading during low volume (e.g., lunch hours, between sessions)
Avoid entry right after a MACD crossover has been running for several candles (too late)
Use price action candles to confirm (e.g., engulfing, strong momentum bars)
🧠 Example Workflow (Call Trade):
You're watching GBP/USD on 30-sec candles.
EMA 5 just crosses above EMA 13.
MACD line crosses above signal, histogram increases.
Price is above both EMAs, showing strength.
Candle closes strong bullish.
➡️ Enter CALL with 2-minute expiry.

SP Indicator Clone## 💡 **SCRIPT का STRUCTURE और FUNCTION**
### 📌 **Indicator Name**
* नाम: `SP Indicator Clone`
* Overlay पर plot होती है — मतलब ये indicator chart पर ही lines, dots, shapes बनाता है।
---
### 📌 **Inputs**
User से कुछ values input लेता है:
1️⃣ **Short EMA Length** → default: 5
👉 ये एक छोटा EMA बनाता है ताकि short term trend दिखे।
2️⃣ **Long EMA Length** → default: 50
👉 ये एक लंबा EMA बनाता है — इसे black trendline जैसा use करते हैं।
3️⃣ **ATR Length** → default: 14
👉 ये ATR निकालता है ताकि trailing stop calculate कर सके।
---
### 📌 **Indicators Plotted**
1️⃣ **Short EMA (blue)**
* Chart पर एक हल्की तेजी/मंदी की direction दिखाता है।
2️⃣ **Long EMA (black)**
* ये SP Indicator की तरह main trend line की तरह काम करता है।
* इस black line के ऊपर/नीचे price जाने पर signals generate होते हैं।
---
### 📌 **Signal Conditions**
#### Long Signal
* जब price का **close** black line (Long EMA) के ऊपर cross करता है।
👉 मतलब market नीचे से ऊपर की तरफ जा रहा है।
#### Short Signal
* जब price का **close** black line (Long EMA) के नीचे cross करता है।
👉 मतलब market ऊपर से नीचे गिर रहा है।
---
### 📌 **Signal Shapes**
* Long signal पर: Green triangle (नीचे candle के नीचे दिखेगा)
* Short signal पर: Red triangle (candle के ऊपर दिखेगा)
---
### 📌 **Trailing Stop**
* Trailing Stop को ATR से निकाला जाता है:
* Long trade में: close price - ATR
* Short trade में: close price + ATR
👉 ये stoploss points green/red dots की तरह दिखते हैं।
---
### 📌 **Visualization**
आप chart पर देख पाते हैं:
* Short EMA (blue line)
* Long EMA (black line)
* Long/Short signal markers (triangles)
* Trailing stop points (dots)
---
## ⚙️ **इस Script से आप क्या देख सकते हैं?**
✅ कब trend बदला (black line के cross पर signal मिलेगा)।
✅ कहाँ approximate trailing stop लगाना है (ATR dots से)।
✅ कब entry लेनी थी (triangles से)।
---
## 🚫 **इस Script की Limitations**
⚠️ यह सिर्फ signals और trailing stop show करता है — **ये Pine Strategy नहीं है** यानी ये Trades को backtest नहीं करता।
⚠️ आप इसका use visual reference के लिए कर सकते हैं, लेकिन P\&L, win/loss stats Strategy Tester में नहीं आएंगे।
---
💡 **अगर आप चाहते हो कि मैं इसी को एक Pine Strategy में बदलूं ताकि Strategy Tester में actual performance दिखे (number of trades, profit, loss आदि)?**
बस बताओ — मैं code तैयार कर दूँ! 🚀

Modüler Trailing Stop (Doğru Ölçekli)
📌 Modular Trailing Stop – Advanced Risk Management for Long & Short Strategies
Modular Trailing Stop is a dual-direction stop management tool that calculates independent stop levels for long and short positions. It is fully scale-adjusted, strategy-agnostic, and optimized for TradingView integration.
🚀 Key Features
🔹 Dual-Side Stop Logic
Separate Ref High and Stop levels for long and short trades, allowing precise and directional control.
🔹 Modular Architecture
Designed to be easily integrated into any indicator or strategy. Operates independently from entry signals.
🔹 Accurate Price Scaling
Automatically adjusts to symbol tick size using syminfo.mintick, ensuring precision across all markets (BTCUSD, ETHUSD, USDTRY...).
🔹 Static Trailing Logic
Once a position is opened, stop levels are anchored to a fixed reference price and adjusted by ATR volatility.
🔹 User-Configurable
- Customizable ATR period and multiplier
- Manual reference high percentages for long and short
- Real-time table display on the chart with key values
⚙️ Calculation Formulas
- Ref High (Long) = Base Price × (1 + %Offset) × scaleFix
- Ref High (Short) = Base Price × (1 - %Offset) × scaleFix
- Step = ATR × Multiplier
- Long Stop = Ref High (Long) – Step
- Short Stop = Ref High (Short) + Step
📈 Use Cases
- Volatility-based static stop-loss framework
- Compatible with RSI, EMA crossover, breakout, and custom signal systems
- Backtesting via TradingView Strategy Tester (WinRate, Sharpe, AvgPnL...)
🧪 Example Backtest (BTCUSDT, 4H Timeframe)
- Win Rate: 41.9%
- Sharpe Ratio: 0.27
- Profit Factor: 1.31
- Avg Trade Duration: 18 bars
- Test Strategy: RSI-based entries + modular trailing stops
🧩 Strategy Integration (Sample)
strategy.exit("Long Exit", from_entry="Long", stop=longStop)
strategy.exit("Short Exit", from_entry="Short", stop=shortStop)
🏁 Summary
Modular Trailing Stop is a robust and intuitive stop-loss management tool. It can be used as a standalone module or combined with any strategy for improved position handling, effective drawdown control, and systematic risk management.
Whether you're building strategies or optimizing entries and exits, this tool brings precision and modular flexibility to your trading workflow.

Option Auto Anchored VWAPThis indicator automatically shows two Anchored VWAP lines.
The first gets placed on the very first candle of the chart.
The second is set on the last or current day you select in the settings.

Nifty Option Auto Anchored VWAPThis indicator automatically shows two Anchored VWAP lines.
The first gets placed on the very first candle of the chart.
The second is set on the last or current day you select in the settings.

時間指定比較 → エントリー&決済+アラート⏰ Time-Based Simple Trade Strategy (Compare → Entry → Exit)
This script implements a time-driven trading strategy that compares price movement between two minute-based points within an hour,
and then enters and exits trades based on your custom schedule.
🔧 Key Features:
User-configurable start and end minutes for price comparison
Determines direction: Long if price increased, Short if decreased
Customizable entry time and exit time
Visual chart signals and alerts
Uses strategy.entry() and strategy.close() for automated backtesting
✅ Example Use:
If price increased from 0 to 15 minutes → Long entry at 30min, exit at 45min
If price decreased → Short entry and exit accordingly
Use 1-minute or 5-minute timeframe for best results.

Simulated OI Proxy with Trend Table1. In Simple Terms
This script mimics open interest analysis using price and volume changes.
It visually marks possible bullish and bearish setups directly on your price chart.
It’s especially useful for markets where real OI data is not available (like Indian stocks)
=======================================================================
2. Calculating Price and Volume Changes
close - close: Calculates the change in closing price from the previous bar to the current bar.
volume - volume: Calculates the change in trading volume from the previous bar to the current bar.
Purpose:
These calculations help determine if price and volume are increasing or decreasing, which is used as a proxy for open interest (OI) since real OI data may not be available.
===================================================================
3. Proxy Logic for OI Signals
long_buildup: Both price and volume are rising. This suggests new buying interest (bullish signal).
short_buildup: Price is falling but volume is rising. This suggests new short positions are being opened (bearish signal).
short_covering: Price is rising but volume is falling. This suggests shorts are closing their positions, causing a price rise (cautiously bullish).
long_unwinding: Both price and volume are falling. This suggests long positions are being closed (cautiously bearish).
====================================================================
4. Plotting the Signals
plotshape(condition, ...): Draws a shape on the chart when the condition is true.
Long Buildup: Green triangle below the bar (bullish).
Short Buildup: Red triangle above the bar (bearish).
Short Covering: Blue circle below the bar (cautiously bullish).
Long Unwinding: Orange circle above the bar (cautiously bearish).
======================================================================
5. Signal Detection:
The script checks price and volume changes to determine which signal is active.
Trend Assignment:
It assigns a text label and color for the detected trend.
Table Display:
A table appears at the top-right of your chart, showing the current trend based on the latest bar.

🎯 M7Ai Algo"M7Ai Algo": شرح موجز
مؤشر M7Ai Algo هو أداة متطورة تم تطويرها باستخدام Pine Script v6، مصممة لتزويد المتداولين بنظرة شاملة لديناميكيات السوق وإشارات التداول المحتملة. يدمج هذا المؤشر مكونات تحليلية متعددة لتقديم رؤى قوية:
محرك الاتجاه (Trend Engine): يستخدم متوسطًا متحركًا مدمجًا ("Fusion MA") يتكون من عدة متوسطات متحركة (مثل EMA، SMA، WMA، ALMA، و VWAP) لتحديد اتجاه السوق السائد وقوته بدقة. كما يشتمل على كشف الانعكاسات بناءً على مؤشر RSI.
الدعم والمقاومة (Support & Resistance): يقوم بحساب ورسم مستويات الدعم والمقاومة الديناميكية تلقائيًا، بما في ذلك النقاط المحورية، مما يساعد المتداولين على تحديد مناطق الأسعار الرئيسية.
تحليل هيكل السوق (Market Structure Analysis): يكشف عن عناصر هيكل السوق الحاسمة مثل مناطق الأوامر (Order Blocks)، شموع المطرقة/المطرقة المقلوبة (Hammer/Inverted Hammer candles)، كسور الهيكل (BOS - Breaks of Structure)، تغيرات الطابع (CHOCH - Changes of Character)، ومناطق السيولة (Liquidity Zones). هذه العناصر حيوية لفهم تحركات السعر المحتملة.
توليد إشارات التداول (Trading Signal Generation): بناءً على تقاطع اتجاه السوق، تأكيد الحجم، الزخم، وهيكل السوق المحدد، يولد المؤشر إشارات تداول "شراء" (LONG) أو "بيع" (SHORT). وتأتي كل إشارة مصحوبة بـ درجة ثقة تشير إلى موثوقيتها.
مستويات الدخول، وقف الخسارة، والأهداف (Entry, Stop-Loss, and Targets): لكل إشارة، يحسب المؤشر نقاط دخول تكيفية، ومستويات وقف الخسارة، وأهداف جني الأرباح المتعددة (T1، T2، T3)، وكل ذلك يتم تعديله ديناميكيًا باستخدام متوسط المدى الحقيقي (ATR) ليعكس التقلبات الحالية.
الرسوم البيانية ولوحة المعلومات (Visualizations & Dashboard): يوفر المؤشر عناصر بصرية قابلة للتخصيص، بما في ذلك الشموع الملونة، سحابات الاتجاه، والنطاقات الديناميكية. كما يتضمن لوحة معلومات (Dashboard) على الرسم البياني لتقديم ملخص سريع لحالة السوق الحالية، معلومات الإشارة، ومستويات الدخول.
باختصار، يهدف مؤشر M7Ai Algo إلى تبسيط عملية التحليل الخاصة بك عن طريق تجميع أدوات فنية قوية لمساعدتك على اتخاذ قرارات تداول أكثر استنارة.
M7Ai Algo: A Brief Explanation
English
The M7Ai Algo is a sophisticated Pine Script v6 indicator designed to provide traders with a comprehensive view of market dynamics and potential trading signals. It integrates multiple analytical components to offer robust insights:
Trend Engine: Utilizes a "Fusion MA" (a composite of multiple moving averages like EMA, SMA, WMA, ALMA, and VWAP) to accurately identify the prevailing market trend and its strength. It also incorporates RSI-based reversal detection.
Support & Resistance: Automatically calculates and plots dynamic support and resistance levels, including pivot points, helping traders identify key price areas.
Market Structure Analysis: Detects crucial market structure elements such as Order Blocks, Hammer/Inverted Hammer candles, Breaks of Structure (BOS), Changes of Character (CHOCH), and Liquidity Zones. These elements are vital for understanding institutional footprints and potential price movements.
Trading Signal Generation: Based on a confluence of trend direction, volume confirmation, momentum, and identified market structure, the indicator generates "LONG" or "SHORT" trading signals. Each signal comes with a confidence score, suggesting its reliability.
Entry, Stop-Loss, and Targets: For each signal, the indicator calculates adaptive entry points, stop-loss levels, and multiple take-profit targets (T1, T2, T3), all dynamically adjusted using Average True Range (ATR) to reflect current volatility.
Visualizations & Dashboard: The indicator offers customizable visual elements, including colored candles, trend clouds, and dynamic bands. A dashboard is included on the chart to provide a quick summary of the current market state, signal information, and entry levels.
In essence, the M7Ai Algo aims to streamline your analysis process by bringing together powerful technical tools to help you make more informed trading decisions.

F&O Time Zones – Final Fixed📌 This indicator highlights high-probability intraday time zones used in Indian F&O (Futures & Options) strategies. Ideal for scalping, breakout setups, and trap avoidance.
🕒 Covered Time Zones:
• 9:15 – 9:21 AM → Flash Trades (first 1-minute volatility)
• 9:21 – 9:30 AM → Smart Money Trap (VWAP fakeouts)
• 9:30 – 9:50 AM → Fake Breakout Zone
• 9:50 – 10:15 AM → Institutional Entry Timing
• 10:15 – 10:45 AM → VWAP Range Scalps
• 10:45 – 11:15 AM → Second Trap Zone
• 11:15 – 1:00 PM → Trend Continuation Window
• 1:00 – 1:45 PM → Volatility Compression
• 1:45 – 2:15 PM → Institutional Exit Phase 1
• 2:15 – 2:45 PM → Trend Acceleration / Reversals
• 2:45 – 3:15 PM → Expiry Scalping Zone
• 3:15 – 3:30 PM → Dead Zone (square-off time)
🔧 Features:
✓ Clean vertical lines per zone
✓ Optional label positions (top or bottom)
✓ Adjustable line style, width, and color
🧠 Best used on: NIFTY, BANKNIFTY, FINNIFTY (5-min or lower)
---
🔒 **Disclaimer**:
This script is for **educational purposes only**. It is not financial advice. Trading involves risk. Please consult a professional or do your own research before taking any positions.
—
👤 Script by: **JoanJagan**
🛠️ Built in Pine Script v5

Simplified SMC Order Blocks📌 Simplified SMC Order Blocks (Pine Script v6)
This script automatically identifies bullish and bearish order blocks based on simple swing highs and lows — inspired by Smart Money Concepts (SMC) and price action trading.
🔍 Features
Detects swing highs/lows using a lookback period
Waits for confirmation candles to validate the zone
Draws order block zones using box.new() directly on the chart
Includes alerts for both bullish and bearish order blocks
⚙️ Inputs
Lookback: How many candles to look back for swing points
Confirmation Candles: How many bars to wait before confirming the OB
Zone Width: Width of the drawn zone (in bars)
🟩 Bullish Order Block:
Identified after a swing low forms
Plots a green shaded zone below price
🟥 Bearish Order Block:
Identified after a swing high forms
Plots a red shaded zone above price
📈 Use Case
Identify potential reversal or mitigation zones
Align with other SMC tools like break of structure (BoS), liquidity sweep, etc.

StraddleThis is an indicator for straddle on Indian markets, with hedging/with out hedging.
You can se these with super trend and ema xover

TradeCrafted – Custom Lines with Dynamic Trend Flow📌 TradeCrafted – Custom Lines with Dynamic Trend Flow
Smart Trend Mapping with Signal Precision
This indicator is crafted for traders who seek clarity, structure, and precision in their trend-following strategy. It dynamically maps price behavior using multiple custom-calculated trend lines that reset daily, extend into the future, and adapt live to market conditions.
🔍 Key Highlights:
⚡ Instant Buy/Sell Labels at critical moments of trend momentum shifts — ideal for intraday entries or swing confirmations.
📐 Three smooth trend lines, updated live and extended ahead, help visualize short- and mid-term directional flow.
🎨 Auto-colored candles based on unique momentum criteria make it easy to scan for strength or weakness.
🕛 Daily resetting logic ensures every session starts with fresh, unbiased trend evaluation — no carryover noise.
✅ Perfect For:
Traders who appreciate minimalist, structure-focused visual guidance.
Those who want an edge without relying on standard indicators.
Anyone looking for clean breakout signals that combine momentum and price action intelligence.
Add it to your chart and let it guide your decisions with elegant, real-time structure and high-probability signals.

TradeCrafted - Gaps in Candles Live🚀 TradeCrafted – Gaps in Candles Live
Instant Gap Detection. Real-Time Signals.
The TradeCrafted – Gaps in Candles Live indicator is a precision tool that scans your chart for true gap formations — those moments when price completely jumps above or below the previous candle, often signaling strong institutional activity or momentum shifts.
🔍 Key Features:
📈 Gap Up Alerts: Highlights when the current candle opens entirely above the previous high — a potential bullish breakout signal.
📉 Gap Down Alerts: Marks when the current candle opens entirely below the previous low — a possible bearish momentum signal.
✅ Real-Time Plotting: Gaps are detected and displayed live, with bold green and red labels for instant visibility.
🎯 Designed for all assets — stocks, indices, crypto, and forex — on any timeframe.
🧠 Why Use It?
Great for spotting momentum ignition points.
Helps identify institutional buying or selling footprints.
Ideal for gap trading strategies or opening range analysis.
Just add it to your chart and let the gaps speak for themselves — no settings, no confusion, just clarity.

Options Strategy V1.3📈 Options Strategy V1.3 — EMA Crossover + RSI + ATR + Opening Range
Overview:
This strategy is designed for short-term directional trades on large-cap stocks or ETFs, especially when trading options. It combines classic trend-following signals with momentum confirmation, volatility-based risk management, and session timing filters to help identify high-probability entries with predefined stop-loss and profit targets.
🔍 Strategy Components:
EMA Crossover (Fast/Slow)
Entry signals are triggered by the crossover of a short EMA above or below a long EMA — a traditional trend-following method to detect shifts in momentum.
RSI Filter
RSI confirms the signal by avoiding entries in overbought/oversold zones unless certain momentum conditions are met.
Long entry requires RSI ≥ Long Threshold
Short entry requires RSI ≤ Short Threshold
ATR-Based SL & TP
Stop-loss is set dynamically as a multiple of ATR below (long) or above (short) the entry price.
Take-profit is placed as a ratio (TP/SL) of the stop distance, ensuring consistent reward/risk structure.
Opening Range Filter (Optional)
If enabled, the strategy only triggers trades after price breaks out of the 09:30–09:45 EST range, ensuring participation in directional moves.
Session Filters
No trades from 04:00 to 09:30 and from 16:00 to 20:00 EST, avoiding low-liquidity periods.
All open trades are closed at 15:55 EST, to avoid overnight risk or expiration issues for options.
⚙️ Built-in Presets:
You can choose one of the built-in ticker-specific presets for optimal conditions:
Ticker EMAs RSI (Long/Short) ATR SL×ATR TP/SL
SPY 8/28 56 / 26 14 1.4× 4.0×
TSLA 23/27 56 / 33 13 1.4× 3.6×
AAPL 6/13 61 / 26 23 1.4× 2.1×
MSFT 25/32 54 / 26 14 1.2× 2.2×
META 25/32 53 / 26 17 1.8× 2.3×
AMZN 28/32 55 / 25 16 1.8× 2.3×
You can also choose "Custom" to fully configure all parameters to your own market and strategy preferences.
📌 Best Use Case:
This strategy is especially suited for intraday options trading, where timing and risk control are critical. It works best on liquid tickers with strong trends or clear breakout behavior.

Master [Trade Snipers]✅ How It Works
The Master indicator is a custom-developed trend and signal tool based on a modified range filter algorithm, specifically designed for clarity, non-repainting signals, and actionable trade execution.
🔧 1. Custom Adaptive Range Filter (Original Logic)
At its core is a custom-built filter that adapts to price volatility. Unlike standard MAs or public-domain range indicators, this version:
(1) Uses a double-smooth EMA logic on absolute price changes.
(2)Multiplies the range by an Impact Factor, giving a dynamic width.
(3) Applies a custom filter algorithm that limits noise and locks on trend movement.
This logic was modified from the concept of range-based filters, but entirely re-engineered to serve trend-following and TP triggering.
🟩 2. Visual Trend Zones (Upper/Lower Lines)
The filtered value generates two dynamic lines:
(1)One above the filter
(2)One below the filter
These create a color-filled “trend tunnel”, making it easy to identify:
(3)🔵 Uptrend (blue fill)
(4)🔴 Downtrend (red fill)
(5)🟡 Sideways market (no fill or neutral color)
These visual cues allow instant identification of market direction without reading complex data
📈 3. Smart Buy/Sell Signals (Confirmed, Non-Repainting ✅)
(1)🚀 Smart Buy is triggered when a confirmed uptrend begins (filter shifts upward with a
new confirmation).
(2)🔻 Smart Sell appears at the start of a confirmed downtrend.
(3)Sideways filters out choppy signals, reducing whipsaws.
✅ All signals are confirmed only after the candle closes (barstate.isconfirmed is used), meaning:
🔒 No repainting or false previews — 100% reliable on live charting.
💰 4. Take Profit System (Unique Utility)
This indicator tracks the entry price after a signal, and auto-detects when a Take Profit level
(in pips) is reached.
(1)💰 Book Profit alert is triggered above/below the candle.
(2)Helps secure gains without relying on external bots or platforms.
🔔 5. Real-Time Alerts Included
All alerts are built-in for automation:
(1)🚀 Smart Buy
(2)🔻 Smart Sell
(3)💰 Book Profit (Buy/Sell)

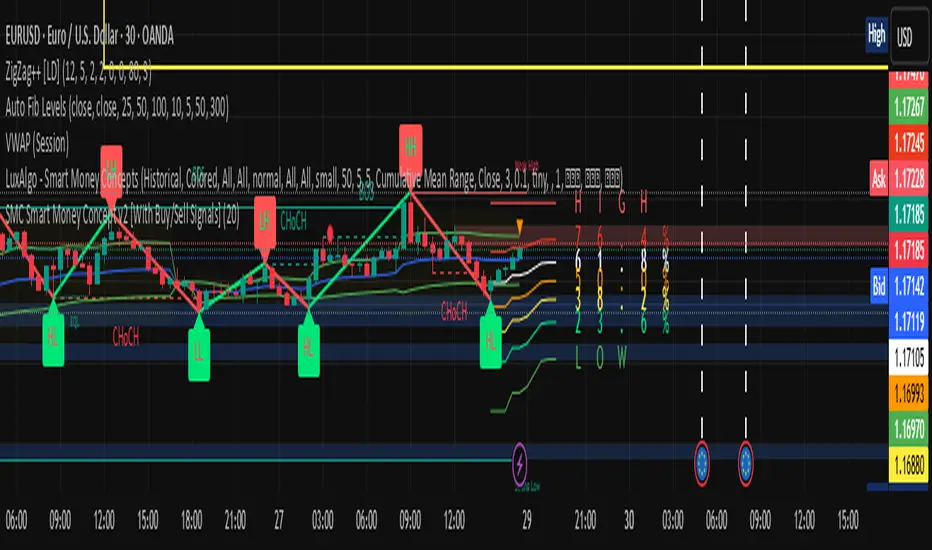
Smart Money Trap SignalSmart Money Trap Signal – Indicator Description
The Smart Money Trap Signal is a precision-based trading tool designed to identify areas where institutional traders (smart money) are likely to trap retail traders through false breakouts and liquidity grabs. These traps often occur near key highs and lows, where retail traders are lured into trades just before price reverses sharply.
🔍 Key Features:
Liquidity Sweep Detection
Identifies false breakouts of recent swing highs or lows, signaling potential liquidity grabs by large players.
Reversal Confirmation
Confirms the trap using a classic price action reversal pattern (bullish or bearish engulfing), helping filter out weak signals.
Optional Volume Spike Filter
Allows additional confirmation based on a significant spike in volume, indicating potential institutional involvement.
Buy and Sell Trap Signals
🔴 Smart Money Short (SMT↓) – Triggered when price sweeps a high and reverses down.
🟢 Smart Money Long (SMT↑) – Triggered when price sweeps a low and reverses up.
Alerts & Labels
Real-time alert conditions and on-chart labels to help you catch setups without missing opportunities.
📈 How to Use:
Apply on Higher Timeframes (1H, 4H, Daily) for cleaner signals.
Look for SMT signals at key supply/demand zones or market structure points.
Combine with your existing trading strategy, such as order blocks or break of structure (BoS), for higher accuracy.
Use volume filter only if you're analyzing markets where volume data is reliable.
⚠️ Disclaimer:
This tool is meant to assist with trade identification, not trade execution. Always use proper risk management and validate setups with your trading plan.
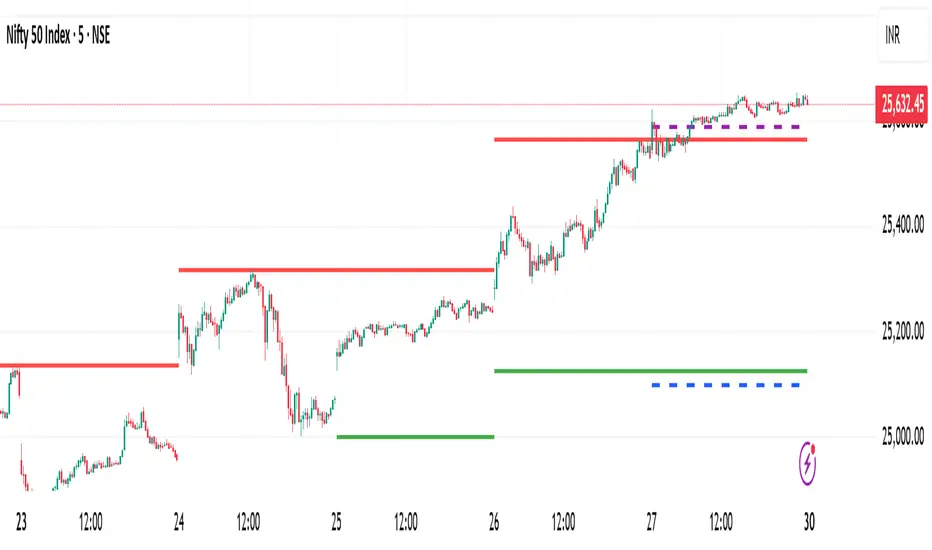
Mathematical Previous Day's Levels🧠 Mathematical Previous Day's Levels
This powerful indicator combines price action logic with mathematically derived levels to help traders visualize key intraday and positional support/resistance zones.
deal for:
Intraday Traders (NIFTY/BANKNIFTY focused)
Mathematical/Quant-based trading strategies
Those who combine technical levels with market structure
Anyone who wants clarity with clean visual aids

ZYTX GKDDThe ZYTX High-Sell Low-Buy Indicator Strategy is a trend-following indicator that integrates multiple indicator resonances. It demonstrates the perfect performance of an automated trading robot, truly achieving the high-sell low-buy strategy in trading.

Historical Volatility with HV Average & High/Low TrendlinesHere's a detailed description of your Pine Script indicator:
---
### 📊 **Indicator Title**: Historical Volatility with HV Average & High/Low Trendlines
**Version**: Pine Script v5
**Purpose**:
This script visualizes market volatility using **Historical Volatility (HV)** and enhances analysis by:
* Showing a **moving average** of HV to identify volatility trends.
* Marking **high and low trendlines** to highlight extremes in volatility over a selected period.
---
### 🔧 **Inputs**:
1. **HV Length (`length`)**:
Controls how many bars are used to calculate Historical Volatility.
*(Default: 10)*
2. **Average Length (`avgLength`)**:
Number of bars used for calculating the moving average of HV.
*(Default: 20)*
3. **Trendline Lookback Period (`trendLookback`)**:
Number of bars to look back for calculating the highest and lowest values of HV.
*(Default: 100)*
---
### 📈 **Core Calculations**:
1. **Historical Volatility (`hv`)**:
$$
HV = 100 \times \text{stdev}\left(\ln\left(\frac{\text{close}}{\text{close} }\right), \text{length}\right) \times \sqrt{\frac{365}{\text{period}}}
$$
* Measures how much the stock price fluctuates.
* Adjusts annualization factor depending on whether it's intraday or daily.
2. **HV Moving Average (`hvAvg`)**:
A simple moving average (SMA) of HV over the selected `avgLength`.
3. **HV High & Low Trendlines**:
* `hvHigh`: Highest HV value over the last `trendLookback` bars.
* `hvLow`: Lowest HV value over the last `trendLookback` bars.
---
### 🖍️ **Visual Plots**:
* 🔵 **HV**: Blue line showing raw Historical Volatility.
* 🔴 **HV Average**: Red line (thicker) indicating smoothed HV trend.
* 🟢 **HV High**: Green horizontal line marking volatility peaks.
* 🟠 **HV Low**: Orange horizontal line marking volatility lows.
---
### ✅ **Usage**:
* **High HV**: Indicates increased risk or potential breakout conditions.
* **Low HV**: Suggests consolidation or calm markets.
* **Cross of HV above Average**: May signal rising volatility (e.g., before breakout).
* **Touching High/Low Levels**: Helps identify volatility extremes and possible reversal zones.
---
Let me know if you’d like to add:
* Alerts when HV crosses its average.
* Shaded bands or histogram visualization.
* Bollinger Bands for HV.

GlocksFibsA modded Version of AlgoAlphas fib script. reworked it into my fib set. same rules apply 868 924 entry. first tp 50% mark. using it to help speed up my charting process overall. This is by far one of the best ones ive found that wont print the fib weird once the new numbers are in. all credits to AlgoAlpha and this gem they made!

Option Call, PUT, entery point, sell point , OB,RSI,VOL,.. this signal when to but call or put and when it the last moment you have to sell them.
works best on 2 min chart or longer time frame.

Previous 2 Days High/LowCan you give me a summary of this indicator
The "Previous 2 Days High/Low" indicator, written in Pine Script v5 for TradingView, plots horizontal lines representing the combined high and low prices of the previous two trading days on a chart. Here's a summary of its functionality, purpose, and key features:
Purpose
The indicator helps traders identify significant price levels by displaying the highest high and lowest low from the previous two days, which can act as potential support or resistance levels. These levels are plotted as lines that extend across the current trading day, making it easier to visualize key price zones for trading decisions.
Key Features
Calculates Combined High and Low:
Retrieves the high and low prices of the previous day and the day before using request.security on the daily timeframe ("D").
Computes the combined high as the maximum of the two days' highs and the combined low as the minimum of the two days' lows.
Dynamic Line Plotting:
Draws two horizontal lines:
Red Line: Represents the combined high, plotted at the highest price of the previous two days.
Green Line: Represents the combined low, plotted at the lowest price of the previous two days.
Lines are created at the start of a new trading day and extended to the right edge of the chart using line.set_x2, ensuring they span the entire current day.
Labels for Clarity:
Adds labels to the right of the chart, displaying the exact price values of the combined high ("Combined High: ") and combined low ("Combined Low: ").
Labels are updated to move with the lines, maintaining alignment at the current bar.
Clutter Prevention:
Deletes old lines and labels at the start of each new trading day to avoid overlapping or excessive objects on the chart.
Dynamic Requests:
Uses dynamic_requests=true in the indicator() function to allow request.security calls within conditional blocks (if ta.change(time("D"))), enabling daily data retrieval within the script's logic.