Options

APLBGreen Line: Indicates the EMA is rising (bullish short-term momentum).
Red Line: Indicates the EMA is falling (bearish short-term momentum).

TZADIKAOTTZA1.2 - Triple Convergence🚀 *TZADIK – Triple Convergence*
The ultimate convergence indicator that brings clarity through the power of consensus.
*What’s Inside?*
A smart fusion of *3 powerful momentum-based indicators*:
* *SMI (Stochastic Momentum Index)*
* *Stochastic RSI*
* *CCI Stochastic*
📊 Each one generates its own buy/sell signal — and TZADIKAOT combines them into a clear, unified consensus:
* ✅ *3/3 BUY / SELL* – Strong entry signals
* ⚠ *2/3 BUY / SELL* – Moderate signals worth watching
* ⚪ *Neutral* – No consensus yet
🎯 *Features*:
✔ Dynamic score histogram
✔ Color-coded background zones
✔ Visual arrows + status labels
✔ Real-time signal table
✔ Built-in alerts for full consensus
*Who is it for?*
Traders who want structured, data-driven signals instead of noise — and a single, trustworthy indicator to guide their decisions.
💡 Designed for clarity, precision, and ease of use on *any timeframe*. No more guesswork. Just signals that matter.

London / NY / Tokyo BreakoutLondon / NY / Tokyo Breakout Signal
This indicator analyzes price action during the London, New York, and Tokyo trading sessions by defining a price range (box) formed at the beginning of each session. At the end of the session, it tests whether the price range is broken.
When the box is broken, it generates a long or short breakout signal on the first breakout bar.
Features:
User-configurable session start and end times with support for local time and GMT offset
Boxes visually display the high-low range formed during each session
Long and short breakout signals plotted on the chart upon price breaking the box
Alert conditions for all breakout signals
Customizable colors for boxes and signals
Use case :
Ideal for breakout strategies based on consolidation during London, New York, and Tokyo sessions in Forex, equities, commodities, and other markets.

Inside Bar Detector - 15min
🔍 What is an Inside Bar?
An **Inside Bar** is a candle that forms **entirely within the high and low of the previous candle**. It represents **consolidation**, **indecision**, or **potential reversal**, and is a key signal in The Strat trading method.
🔧 What the Script Does:
1. **Timeframe Restriction**:
* The script activates **only on the 15-minute timeframe**, avoiding clutter on other timeframes.
2. **Inside Bar Logic**:
* It checks whether the **current bar’s high is lower than the previous bar’s high**, **AND** the **current bar’s low is higher than the previous bar’s low**.
* If both conditions are true, it confirms an Inside Bar.
3. **Visual Display**:
* When an Inside Bar is detected, the script **plots a yellow label ("1") above the bar**.
* The label represents the Strat 1-bar and helps you easily spot potential setups.
🎯 Use Case:
* Ideal for **Strat traders**, **price action analysts**, or **any trader** looking for breakout or reversal opportunities.
* Common setups include **1-2**, **1-3**, or **double inside bar** breakouts.

Improved Historical Volatility Calculator (No Options)Improved Historical Volatility Calculator (No Options)
Description
The "Improved Historical Volatility Calculator (No Options)" is a Pine Script indicator designed to calculate the historical volatility (HV) of assets without relying on options data. This tool is particularly useful for markets like forex, indices, or stocks where options trading might be limited or unavailable. It provides a customizable way to measure volatility based on historical price movements, with options to adjust the calculation period, trading days per year, and use an exponentially weighted moving average (EWMA) for enhanced sensitivity to recent data.
This indicator can be used standalone to visualize volatility trends or integrated with other scripts (e.g., option pricing models) to provide a manual input for implied volatility (IV).
Features
Customizable Period: Adjust the number of days (5 to 365) for volatility calculation.
Flexible Annualization: Set the number of trading days per year (default 252) to suit different markets (e.g., 365 for forex).
EWMA Option: Toggle between standard deviation and EWMA for a more responsive volatility measure.
Trend Adjustment: Removes the influence of price trends using an EMA-based detrending method.
Visual Output: Displays volatility as a histogram and labels the latest value on the chart.
How to Use
Add the Indicator: Load the indicator onto your chart via the Pine Script editor or the Indicators menu.
Configure Settings:
Period for Calculation: Set the lookback period (e.g., 30 days) to calculate volatility.
Trading Days per Year: Adjust for your market (e.g., 252 for stocks, 365 for continuous markets).
Use EWMA: Enable for a weighted approach focusing on recent volatility.
Interpret the Results: The histogram shows volatility in decimal form (e.g., 0.03136 = 3.136%), and the label displays the percentage on the last bar.
Integration: Use the calculated volatility value (in decimal form) as a manual IV input in other scripts, such as option pricing models.
Example
For the DXY index, with a 60-day period and 252 trading days per year, the indicator might output a volatility of 0.03136 (3.136%). You can input this value into an options model to estimate standard deviation levels, adjusting for the days to expiry.
Notes
Accuracy: The indicator provides a reliable estimate of historical volatility, with improvements like trend removal and EWMA. For precision, use a period that matches your trading horizon (e.g., 30-90 days).
Limitations: Volatility is based on historical data and may not reflect future market conditions or implied volatility from options.
Compatibility: Tested on TradingView as of June 16, 2025. Ensure sufficient historical data is available for the chosen period.
Suggestions
Increase the period for volatile assets to smooth out noise.
Share feedback or request enhancements in the comments!

Option Range Projector PRO (with Alerts)Indicator Name: Option Range Projector PRO (with Alerts)
Short Description
This is a powerful and flexible tool for traders that visualizes expected price movement ranges based on option pricing principles and statistical deviations. The indicator plots standard deviation levels (Sigmas) and boundaries calculated from the price of an options Straddle, providing a unique insight into market volatility expectations.
It is ideal for options traders, as well as those who trade futures or spot assets and want to gain an edge by understanding where the market anticipates price boundaries on a specific date.
Core Concepts
The indicator is based on three key ideas:
Standard Deviation (Sigma, σ): In statistics, this is a measure of value dispersion. In trading, when applied to prices, standard deviation levels show the probable range within which the price is expected to remain until a specific date (expiration).
±1σ (1 Sigma): Approximately 68.2% probability that the price will stay within this range.
±2σ (2 Sigmas): Approximately 95.4% probability. These levels often act as strong support/resistance.
±3σ (3 Sigmas): Approximately 99.7% probability. Reaching these levels is a statistically rare event.
Implied Volatility (IV): This is a key component. IV is the market's forecast of the asset's future volatility. It is derived from current option prices and reflects how significant the price movements are expected to be by traders. The higher the IV, the wider the calculated ranges will be.
Straddle-Based Levels: A straddle is an options strategy involving the simultaneous purchase of a Call and a Put option with the same strike price and expiration date. The cost of this combination (Call + Put) directly reflects the market's expected price movement in points. Our indicator uses this value to construct alternative, highly accurate boundaries of the expected range.
Key Features
Flexible Expiration Choice: Easily switch between standard contracts (Weekly, Monthly, Quarterly) or set any custom number of days to expiration (DTE).
Dual Volatility Calculation Mode: Use automatic calculation based on historical data or enter a precise IV value manually (e.g., from your broker's terminal) for maximum accuracy.
Two Types of Predictive Levels: Visualize classic standard deviations (Sigmas) and/or levels calculated from the Straddle price for a comprehensive analysis.
Expiration Comparison: Enable the display of additional levels for a different expiration date to visually compare short-term and long-term market expectations.
"Greeks" Calculation: The indicator calculates and displays key option Greeks (Delta, Gamma, Theta, Vega), helping to deepen the understanding of an option position's characteristics.
Informative Table: All key data—ATM price, IV, DTE, level prices, Greeks, and option prices—are consolidated into one clear table for quick analysis.
Customizable Alerts: Get instant notifications directly in TradingView when the price crosses any of the important levels (±1σ, ±2σ, ±3σ).
Full Visual Customization: Control colors, line thickness, labels, and zone fills to adapt the indicator to your trading style.
How to Use (Settings)
Price Settings:
Auto-detect ATM Price: When enabled, the indicator will use the current closing price as the At-The-Money (ATM) price.
Manual ATM Price: If auto mode is disabled, you can set a precise ATM price manually.
Volatility Settings:
Auto-calculate IV: Calculates historical volatility over a specified period. Useful if you don't have access to real-time IV.
Manual IV Value: (Recommended for accuracy). Enter the Implied Volatility (IV) value for the desired strike from your brokerage terminal or analytical services here.
Expiration:
Contract Type: Choose one of the standard terms (Weekly, Monthly, Quarterly) or "Custom" to use a manual day input.
Days to Expiration: Active only for the "Custom" type.
Show Multiple Expirations: Enables a second set of levels with a different term for comparison.
Straddle Boundaries:
Use Manual Input: Allows you to enter the precise Call and Put Settle prices from the official exchange summary (e.g., from the CME website). This provides the most accurate boundaries based on real market prices.
Trading Ideas and Application
Mean Reversion Trading: The ±2σ and ±3σ levels often act as strong overbought/oversold zones. A price reaching these extreme values has a high statistical probability of reversing or correcting back towards the central ATM price.
Trend Confirmation and Breakouts: A confident close outside the ±1σ range can indicate the beginning of a strong directional move.
Risk Management: Use the levels to set stop-losses or determine profit targets. For example, when opening a trade near the +1σ level, you might consider a target at +2σ and place a stop-loss behind the ATM level.
Volatility Analysis: By comparing the width of the ranges for different expirations, you can assess how the market is pricing short-term versus long-term risks. A narrow range suggests low expectations, while a wide range indicates high ones.
Disclaimer: This indicator is an analysis tool and does not provide direct financial advice or trading signals. All trading decisions are your own. Use this indicator in conjunction with other analysis methods.

OptionHawk1. What makes the script original?
• Unique concept: It integrates a Keltner based custom supertrend with a multi-EMA energy visualization, ATR based multi target management, and on chart options (CALL/PUT) trade signals—creating a toolkit not found in typical public scripts.
• Innovative use: Instead of off the shelf indicators, it reinvents them:
• Keltner bands used as dynamic Supertrend triggers.
• Fifteen EMAs layered for “energy” zones (bullish/bearish heatmaps).
• ATR dynamically scales multi-TP levels and stop loss.
These are creatively fused into a unified signal and automation engine.
________________________________________
2. What value does it provide to traders?
• Clear entries & exits: Labels for entry price/time, five TP levels, and SL structure eliminate guesswork.
• Visualization & automation: Real-time bar coloring and energy overlays allow quick momentum reads.
• Targeted to common pain points: Many traders struggle with manual TP/SL and entry timing—this automates that process.
• Ready for real use: Just plug into intraday (e.g., 5 min) or swing setups; no manual calculations. Signals are actionable out of the box.
________________________________________
3. Why invite only (worth paying)?
• Proprietary fusion: Public indicators like Supertrend or EMA are common—but your layered use, ATR based scaling, and label logic are exclusive.
• Auto-generated options format: Unique labeling for CALL/PUT, with graphical on chart signals, isn’t offered freely elsewhere.
• Time-saver & edge-provider: Saves traders hours of configuration and enhances consistency—worth the subscription cost over piecing together mash ups.
________________________________________
4. How does it work?
• Signal backbone: Custom supertrend uses Keltner bands crossing with close for direction, filtered by trend direction EMAs.
• Multi time logic: Trend defined by crossover of price over dynamic SMA thresholds built from ATR.
• Energy bar-colors/EMAs: 15 fast EMAs color-coded green/red to instantly show momentum.
• Entry logic: “Bull” when close crosses above supertrend; “Bear” when crosses below.
• Risk management: SL set at previous bar; up to 5 ATR scaled targets (or percentage based).
• Options formatted alerts: CALL/PUT labels with ₹¬currency values, embedded timestamp, SL/TP all printed on the chart.
________________________________________
5. How should traders use it?
• Best markets & timeframes: Ideal for intraday / low timeframe (1 15m) setups and 1 hour swing trades in equities, indices, options.
• Conditions: Works best in trending or volatility driven sessions—visible via Keltner bands and EMA energy alignment.
• Recommended combo: Use alongside volume filters or broader cycles; when supertrend & energy EMAs align, validation is stronger.
________________________________________
6. Proof of effectiveness?
• On chart visuals: Entry/exit labels, confirmed labels, TP and SL markers make past hits obvious.
• Real trade examples: Highlighted both bull & bear setups with full profit realization or SL hits.
• Performance is paint tested: Easy to showcase historic signals across multiple tickers.
• Data-backed: Users can export chart data to calculate win rate and avg return per trade.
________________________________________
Summary Pitch:
OptionHawk offers a holistic, execution-ready trading tool:
1. Proprietary blend of Keltner-supertrend and layered EMAs—beyond standard scripts.
2. Automates entries, multi-tier targets, SL, and options-format labels.
3. Visual energy overlays for quick momentum readings.
4. Use-tested in intraday and swing markets.
5. Installs on chart and works immediately—no setup complexity.
It's not a public indicator package; it's a self-contained, plug and play trade catalyst—worth subscribing for active traders seeking clarity, speed, and structure in their decision-making.
6. While OptionHawk is designed for clarity and structure, no script can predict the market. Always use with discretion and proper risk management.
---------------------------------------------------------------------------------------------------------------------
OptionHawk: A Comprehensive Trend-Following & Volatility-Adaptive Trading System
The "OptionHawk" script is a sophisticated trading tool designed to provide clear, actionable signals for options trading by combining multiple technical indicators and custom logic. It aims to offer a holistic view of market conditions, identifying trend direction, momentum, and potential entry/exit points with dynamic stop-loss and take-profit levels.
________________________________________
1. Why These Specific Indicators and Code Elements?
The "OptionHawk" script is a strategic fusion of the Supertrend indicator (modified with Keltner Channels), a multi-EMA "Energy" ribbon, dynamic trend lines (based on SMA and ATR), a 100-period Trend Filter EMA, and comprehensive trade management logic (SL/TP). My reason and motivation for this mashup stem from a desire to create a robust system that accounts for various market aspects often overlooked by individual indicators:
• Supertrend with Keltner Channels: The standard Supertrend is effective for trend identification but can sometimes generate whipsaws in volatile or ranging markets. By integrating Keltner Channels into the Supertrend calculation, the volatility measure becomes more adaptive, using the (high - low) range within the Keltner Channel for its ATR-like component. This aims to create a more responsive yet less prone-to-false-signals Supertrend.
• Multi-EMA "Energy" Ribbon: This visually striking element, composed of 15 EMAs, provides a quick glance at short-to-medium term momentum and potential support/resistance zones. When these EMAs are stacked and moving in one direction, it indicates strong "energy" behind the trend, reinforcing the signals from other indicators.
• Dynamic Trend Lines (SMA + ATR): These lines offer a visual representation of support and resistance that adapts to market volatility. Unlike static trend lines, their ATR-based offset ensures they remain relevant across different market conditions and asset classes, providing context for price action relative to the underlying trend.
• 100-Period Trend Filter EMA: A longer-period EMA acts as a higher-timeframe trend filter. This is crucial for confirming the direction identified by the faster-acting Supertrend, helping to avoid trades against the prevailing broader trend.
• Comprehensive Trade Management Logic: The script integrates automated calculation and display of stop-loss (SL) and multiple take-profit (TP) levels, along with trade confirmation and "TP Hit" labels. This is critical for practical trading, providing immediate, calculated risk-reward parameters that individual indicators typically don't offer.
This combination is driven by the need for a multi-faceted approach to trading that goes beyond simple signal generation to include trend confirmation, volatility adaptation, and essential risk management.
________________________________________
2. What Problem or Need Does This Mashup Solve?
This mashup addresses several critical gaps that existing individual indicators often fail to fill:
• Reliable Trend Identification in Volatile Markets: While Supertrend is good, it can be late or whipsaw. Integrating Keltner Channels helps it adapt to changing volatility, providing more reliable trend signals.
• Confirmation of Signals: A common pitfall of relying on a single indicator is false signals. "OptionHawk" uses the multi-EMA "Energy" ribbon and the 100-period EMA to confirm the trend identified by the Keltner-Supertrend, reducing false entries.
• Dynamic Support/Resistance & Trend Context: Static support and resistance levels can quickly become irrelevant. The dynamic SMA + ATR trend lines provide continually adjusting zones that reflect the current market's true support and resistance, giving traders a better understanding of price action within the trend.
• Integrated Risk and Reward Management: Most indicators just give entry signals. This script goes a significant step further by automatically calculating and displaying clear stop-loss and up to five take-profit levels (either ATR-based or percentage-based). This is a vital component for structured trading, allowing traders to pre-define their risk and reward for each trade.
• Visual Clarity and Actionable Information: Instead of requiring traders to layer multiple indicators manually, "OptionHawk" integrates them into a single, cohesive display with intuitive bar coloring, shape plots, and informative labels. This reduces cognitive load and presents actionable information directly on the chart.
In essence, "OptionHawk" provides a more comprehensive, adaptive, and actionable trading framework than relying on isolated indicators.
________________________________________
3. How Do the Components Work Together?
The various components of "OptionHawk" interact in a synergistic and often sequential manner to generate signals and manage trades:
• Keltner-Supertrend as the Primary Signal Generator: The supertrend function, enhanced by keltner_channel, is the core of the system. It identifies potential trend reversals and continuation signals (bullish/bearish crosses of the supertrendLine). The sensitivity and factor inputs directly influence how closely the Supertrend follows price and its responsiveness to volatility.
• Multi-EMA "Energy" Ribbon for Momentum and Confirmation: The 15 EMAs (from ema1 to ema15) are plotted to provide a visual representation of short-term momentum. When the price is above these EMAs and they are spread out and pointing upwards, it suggests strong bullish "energy." Conversely, when price is below them and they are pointing downwards, it indicates bearish "energy." This ribbon serves as a simultaneous visual confirmation for the Supertrend signals; a buy signal from Supertrend is stronger if the EMA ribbon is also indicating upward momentum.
• Dynamic Trend Lines for Context and Confirmation: The sma_high and sma_low lines, incorporating ATR, act as dynamic support and resistance. The trend variable, determined by price crossing these lines, provides an overarching directional bias. This component works conditionally with the Supertrend; a bullish Supertrend signal is more potent if the price is also above the sma_high (indicating an uptrend).
• 100-Period Trend Filter EMA for Macro Trend Confirmation: The ema100 acts as a macro trend filter. Supertrend signals are typically considered valid if they align with the direction of the ema100. For example, a "BUY" signal from the Keltner-Supertrend is ideally taken only if the price is also above the ema100, signifying that the smaller trend aligns with the larger trend. This is a conditional filter.
• Trade Confirmation and SL/TP Logic (Sequential and Conditional):
• Once a bull or bear signal is generated by the Keltner-Supertrend, the tradeSignalCall or tradeSignalPut is set to true.
• A confirmation step then occurs for a "BUY" signal, the script checks if the close of the next bar is higher than the entry bar's close. For a "SELL" signal, it checks if the close of the next bar is lower. This is a sequential confirmation step aimed at filtering out weak signals.
• Upon a confirmed signal, the stop-loss (SL) is immediately set based on the previous bar's low (for calls) or high (for puts).
• Multiple take-profit (TP) levels are calculated and stored in arrays. These can be based on a fixed percentage or dynamic ATR multiples, based on user input.
• The TP HIT logic continuously monitors price action simultaneously against these pre-defined target levels, displaying labels when a target is reached. The SL HIT logic similarly monitors for a stop-loss breach.
In summary, the Supertrend generates the initial signal, which is then confirmed by the dynamic trend lines and the 100-period EMA, and visually reinforced by the EMA "Energy" ribbon. The trade management logic then takes over, calculating and displaying vital risk-reward parameters.
________________________________________
4. What is the Purpose of the Mashup Beyond Simply Merging Code?
The purpose of "OptionHawk" extends far beyond merely combining different indicator codes; it's about creating a structured and informed decision-making process for options trading. The key strategic insights and functionalities added by combining these elements are:
• Enhanced Signal Reliability and Reduced Noise: By requiring multiple indicators to align (e.g., Keltner-Supertrend signal confirmed by EMA trend filter and dynamic trend lines), the script aims to filter out false signals and whipsaws that commonly plague individual indicators. This leads to higher-probability trade setups.
• Adaptive Risk Management: The integration of ATR into both the Supertrend calculation and the dynamic stop-loss/take-profit levels makes the entire system adaptive to current market volatility. This means stop-losses and targets are not static but expand or contract with the market's price swings, promoting more realistic risk management.
• Clear Trade Entry and Exit Framework: The script provides a complete trading plan with each signal: a clear entry point, a precise stop-loss, and multiple cascading take-profit levels. This holistic approach empowers traders to manage their trades effectively from initiation to conclusion, rather than just identifying a potential entry.
• Visual Confirmation of Market Strength: The "Energy" ribbon and dynamic trend lines provide an immediate visual understanding of the market's momentum and underlying trend strength, helping traders gauge conviction behind a signal.
• Improved Backtesting and Analysis: By combining these elements into one script, traders can more easily backtest a comprehensive strategy rather than trying to manually combine signals from multiple overlaying indicators, leading to more accurate strategy analysis.
• Suitability for Options Trading: Options contracts are highly sensitive to price movement and volatility. This script's focus on confirmed trend identification, dynamic volatility adaptation, and precise risk management makes it particularly well-suited for the nuanced demands of options trading, where timing and defined risk are paramount.
________________________________________
5. What New Functionality or Insight Does Your Script Offer?
"OptionHawk" offers several new functionalities and insights that significantly enhance decision-making, improve accuracy, and provide clearer signals and better timing for traders:
• "Smart" Supertrend: By basing the Supertrend's volatility component on the Keltner Channel's range instead of a simple ATR, the Supertrend becomes more sensitive to price action within its typical bounds while still adapting to broader market volatility. This can lead to earlier and more relevant trend change signals.
• Multi-Confirmation System: The script doesn't just provide a signal; it layers multiple confirmations (Keltner-Supertrend, multi-EMA "Energy" coloration, dynamic trend lines, and the 100-period EMA). This multi-layered validation significantly improves the accuracy of signals by reducing the likelihood of false positives.
• Automated and Dynamic Risk-Reward Display: This is a major functionality enhancement. The automatic calculation and clear display of stop-loss and five distinct take-profit levels (based on either ATR or percentage) directly on the chart, along with "TP HIT" and "SL HIT" labels, streamline the trading process. Traders no longer need to manually calculate these crucial levels, leading to enhanced decision-making and better risk management.
• Visual Trend "Energy" and Momentum: The vibrant coloring of the multi-EMA ribbon based on price relative to the EMA provides an intuitive and immediate visual cue for market momentum and "energy." This offers an insight into the strength of the current move, which isn't available from single EMA plots.
• Post-Signal Confirmation: The "Confirmation" label appearing on the bar after a signal, if the price continues in the signaled direction, adds an extra layer of real-time validation. This helps to improve signal timing by waiting for initial follow-through.
• Streamlined Options Trading Planning: For options traders, having clear entry prices, stop-losses, and multiple target levels directly annotated on the chart is invaluable. It helps in quickly assessing potential premium movements and managing positions effectively.
In essence, "OptionHawk" transitions from a collection of indicators to a semi-automated trading assistant, providing a comprehensive, visually rich, and dynamically adaptive framework for making more informed and disciplined trading decisions.
----------------------------------------------------------------------------------------------------------------
Performance & Claims
1. What is the claimed performance of the script or strategy?
Answer: The script does not claim any specific performance metrics (e.g., win rate, profit factor, percentage gains). It's an indicator designed to identify potential buy/sell signals and target/stop-loss levels. The labels it generates ("BUY CALL," "BUY PUT," "TP HIT," "SL HIT") are informational based on its internal logic, not a representation of actual trading outcomes.
2. Is there any proof or backtesting to support this claim?
Answer: No, the provided code does not include any backtesting functionality or historical performance proof. As an indicator, it simply overlays visual signals on the chart. To obtain backtesting results, the logic would need to be implemented as a Pine Script strategy with entry/exit rules and commission/slippage considerations.
3. Are there any unrealistic or exaggerated performance expectations being made?
Answer: The script itself does not make any performance expectations. It avoids quantitative claims. However, if this script were presented to users with implied promises of profit based solely on the visual signals, that would be unrealistic.
4. Have you clearly stated the limitations of the performance data (e.g., “based on backtesting only”)?
Answer: There is no statement of performance data or its limitations because the script doesn't generate performance data.
5. Do you include a disclaimer that past results do not guarantee future performance?
Answer: No, the script does not include any disclaimers about past or future performance. This is typically found in accompanying documentation or marketing materials for a trading system, not within the indicator's code itself.
________________________________________
Evidence & Transparency
6. How are your performance results measured (e.g., profit factor, win rate, Sharpe ratio)?
Answer: Performance results are not measured by this script. It's an indicator.
7. Are these results reproducible by others using the same script and settings?
Answer: The visual signals and calculated levels (Supertrend line, EMAs, target/SL levels) generated by the script are reproducible on TradingView when applied to the same instrument, timeframe, and with the same input settings. However, the actual trading results (profit/loss) are not generated or reproducible by this indicator.
8. Do you include enough data (charts, equity curves, trade logs) to support your claims?
Answer: No, the script does not include or generate equity curves or trade logs. It provides visual labels on the chart, which can be seen as a form of "data" to support the signal generation, but not the performance claims (as none are made by the code).
________________________________________
Future Expectations
9. Are you making any predictions about future market performance?
Answer: No, the script does not make any explicit predictions about future market performance. Its signals are based on historical price action and indicator calculations.
10. Have you stated clearly that the future is fundamentally uncertain?
Answer: No, the script does not contain any statements about the uncertainty of the future.
11. Are forward-looking statements presented with caution and appropriate language?
Answer: The script does not contain any forward-looking statements beyond the visual signals it generates based on real-time data.
________________________________________
Risk & Disclosure
12. Have you disclosed the risks associated with using your script or strategy?
Answer: No, the script does not include any risk disclosures. This is typically found in external documentation.
13. Do you explain that trading involves potential loss as well as gain?
Answer: No, the script does not contain any explanation about the potential for loss in trading.
________________________________________
Honesty & Integrity
14. Have you avoided hype words like “guaranteed,” “foolproof,” or “no losses”?
Answer: Yes, the script itself avoids these hype words. The language used within the code is technical and describes the indicator's logic.
15. Is your language grounded and realistic rather than promotional?
Answer: Yes, the language within the provided Pine Script code is grounded and realistic as it pertains to the technical implementation of an indicator.
16. Are you leaving out any important details that might mislead users (e.g., selective performance snapshots)?
Answer: From the perspective of the code itself, no, it's not "leaving out" performance details because it's not designed to generate them. However, if this indicator were to be presented as a "strategy" that implies profitability without accompanying disclaimers, backtesting results, and risk disclosures, then that external presentation could be misleading. The script focuses on signal generation and visual representation.
⚠️ Disclaimer:
This indicator is for informational and educational purposes only. It does not guarantee any future results or performance. All trading involves risk. Please assess your own risk tolerance and consult a licensed financial advisor if needed. Past performance does not indicate future returns.

Sticky Notes📌 Sticky Notes - On-Chart Memo Tool
A convenient indicator that lets you display trading ideas and important notes directly on your charts!
✨ Key Features:
📝 Create memos with custom text input
📍 Place anywhere on chart (top/middle/bottom)
🖥️ Screen-fixed display mode (corner positions)
🎨 Fully customizable text and background colors
📏 5 text size options (tiny to huge)
⏰ Time-based display functionality
📐 Text alignment options (left/center/right)
💡 Use Cases:
Trading strategy reminders
Important price level notes
Economic event schedules
Entry/exit point memos
Simple and user-friendly design to enhance your trading analysis!
RSI‑MA Near‑Level AlertRSI‑MA Near‑Level Alert — Publication Description
Overview
RSI‑MA Near‑Level Alert plots a smoothed Relative Strength Index (RSI) line and sends automatic alerts whenever that line comes within a user‑defined distance of two key thresholds (default = 70 for overbought, 30 for oversold). It is designed for traders who want an early warning—before a classic 70/30 cross—so they can tighten stops, scale out, or prepare reversal setups.
How It Works
RSI Calculation – Uses the standard RSI (default length 14).
Smoothing – Applies a moving‑average (default Simple 10) to reduce noise.
Proximity Logic – On every bar, the script measures the absolute distance between the smoothed RSI line and each threshold.
If the distance ≤ the Proximity setting (default 1 point), the condition flips to true.
Built‑in Alert Triggers – Two alertcondition() calls are embedded:
“RSI MA near UPPER level”
“RSI MA near LOWER level”
Select either one (or both) from the TradingView alert dialog and choose your delivery method (popup, e‑mail, SMS, webhook).
Inputs
Input Default Purpose
RSI Length 14 Core momentum look‑back.
Smoothing MA Length 10 Length of the MA applied to RSI.
Upper Level 70 Overbought line.
Lower Level 30 Oversold line.
Alert Proximity (points) 1.0 How close (in RSI points) the MA must get to trigger.
All inputs are fully editable after you add the script to a chart.
Typical Use‑Cases
Pre‑emptive Exits – Get notified when momentum is stalling near 70 or 30 so you can lock in gains before a reversal.
Reversal Hunting – Combine the alert with price‑action patterns (pin bars, engulfing candles) for higher‑probability fades.
Breakout Confirmation – Increase Upper Level to 80 / Lower Level to 20 and lower Proximity to 0.5 for more aggressive trend‑following alerts.
Step‑by‑Step Alert Setup
Add the script to your chart.
Click the alarm‑clock‑plus icon (or press Alt + A).
In “Condition,” select RSI‑MA Near‑Level Alert.
Choose either RSI MA near UPPER level or RSI MA near LOWER level.
Pick Once Per Bar Close for confirmed signals or Once Per Bar for real‑time.
Select your preferred notification methods and click Create.
(Repeat for the opposite threshold.)
Customization Tips
Change Smoothing Type – Replace ta.sma() with ta.ema(), ta.rma(), etc., directly in the code if you prefer another MA.
Track Multiple Assets – Apply the indicator to each symbol in a multi‑chart layout and set independent alerts.
Narrow Range Play – Set Upper = 60, Lower = 40 and Proximity = 0.5 to monitor a quiet‑momentum band.
Disclaimer
This script is provided for educational purposes only. It does not constitute financial advice, and past performance is not indicative of future results. Always back‑test and validate on demo data before risking live capital. The author assumes no liability for trading losses or platform malfunctions.
Options Volatility Strategy Analyzer [TradeDots]The Options Volatility Strategy Analyzer is a specialized tool designed to help traders assess market conditions through a detailed examination of historical volatility, market benchmarks, and percentile-based thresholds. By integrating multiple volatility metrics (including VIX and VIX9D) with color-coded regime detection, the script provides users with clear, actionable insights for selecting appropriate options strategies.
📝 HOW IT WORKS
1. Historical Volatility & Percentile Calculations
Annualized Historical Volatility (HV): The script automatically computes the asset’s historical volatility using log returns over a user-defined period. It then annualizes these values based on the chart’s timeframe, helping you understand the asset’s typical volatility profile.
Dynamic Percentile Ranks: To gauge where the current volatility level stands relative to past behavior, historical volatility values are compared against short, medium, and long lookback periods. Tracking these percentile ranks allows you to quickly see if volatility is high or low compared to historical norms.
2. Multi-Market Benchmark Comparison
VIX and VIX9D Integration: The script tracks market volatility through the VIX and VIX9D indices, comparing them to the asset’s historical volatility. This reveals whether the asset’s volatility is outpacing, lagging, or remaining in sync with broader market volatility conditions.
Market Context Analysis: A built-in term-structure check can detect market stress or relative calm by measuring how VIX compares to shorter-dated volatility (VIX9D). This helps you decide if the present environment is risk-prone or relatively stable.
3. Volatility Regime Detection
Color-Coded Background: The analyzer assigns a volatility regime (e.g., “High Asset Vol,” “Low Asset Vol,” “Outpacing Market,” etc.) based on current historical volatility percentile levels and asset vs. market ratios. A color-coded background highlights the regime, enabling traders to quickly interpret the market’s mood.
Alerts on Regime Changes & Spikes: Automated alerts warn you about any significant expansions or contractions in volatility, allowing you to react swiftly in changing conditions.
4. Strategy Forecast Table
Real-Time Strategy Suggestions: At the close of each bar, an on-chart table generates suggested options strategies (e.g., selling premium in high volatility or buying premium in low volatility). These suggestions provide a quick summary of potential tactics suited to the current regime.
Contextual Market Data: The table also displays key statistics, such as VIX levels, asset historical volatility percentile, or ratio comparisons, helping you confirm whether volatility conditions warrant more conservative or more aggressive strategies.
🛠️ HOW TO USE
1. Select Your Timeframe: The script supports multiple timeframes. For short-term trading, intraday charts often reveal faster shifts in volatility. For swing or position trading, daily or weekly charts may be more stable and produce fewer false signals.
2. Check the Volatility Regime: Observe the background color and on-chart labels to identify the current regime (e.g., “HIGH ASSET VOL,” “LOW VOL + LAGGING,” etc.).
3. Review the Forecast Table: The table suggests strategy ideas (e.g., iron condors, long straddles, ratio spreads) depending on whether volatility is elevated, subdued, or spiking. Use these as a starting point for designing trades that match your risk tolerance.
4. Combine with Additional Analysis: For optimal results, confirm signals with your broader trading plan, technical tools (moving averages, price action), and fundamental research. This script is most effective when viewed as one component in a comprehensive decision-making process.
❗️LIMITATIONS
Directional Neutrality: This indicator analyzes volatility environments but does not predict price direction (up/down). Traders must combine with directional analysis for complete strategy selection.
Late or Missed Signals: Since all calculations require a bar to close, sharp intrabar volatility moves may not appear in real-time.
False Positives in Choppy Markets: Rapid changes in percentile ranks or VIX movements can generate conflicting or premature regime shifts.
Data Sensitivity: Accuracy depends on the availability and stability of volatility data. Significant gaps or unusual market conditions may skew results.
Market Correlation Assumptions: The system assumes assets generally correlate with S&P 500 volatility patterns. May be less effective for:
Small-cap stocks with unique volatility drivers
International stocks with different market dynamics
Sector-specific events disconnected from broad market
Cryptocurrency-related assets with independent volatility patterns
RISK DISCLAIMER
Options trading involves substantial risk and is not suitable for all investors. Options strategies can result in significant losses, including the total loss of premium paid. The complexity of options strategies requires thorough understanding of the risks involved.
This indicator provides volatility analysis for educational and informational purposes only and should not be considered as investment advice. Past volatility patterns do not guarantee future performance. Market conditions can change rapidly, and volatility regimes may shift without warning.
No trading system can guarantee profits, and all trading involves the risk of loss. The indicator's regime classifications and strategy suggestions should be used as part of a comprehensive trading plan that includes proper risk management, directional analysis, and consideration of broader market conditions.

NY ORB + Fakeout Detector🗽 NY ORB + Fakeout Detector
This indicator automatically plots the New York Opening Range (ORB) based on the first 15 minutes of the NY session (15:30–15:45 CEST / 13:30–13:45 UTC) and detects potential fakeouts (false breakouts).
🔍 Key Features:
✅ Plots ORB high and low based on the 15-minute NY open range
✅ Automatically detects fake breakouts (price wicks beyond the box but closes back inside)
✅ Visual markers:
🔺 "Fake ↑" if a fake breakout occurs above the range
🔻 "Fake ↓" if a fake breakout occurs below the range
✅ Gray background highlights the ORB session window
✅ Designed for scalping and short-term breakout strategies
🧠 Best For:
Intraday traders looking for NY volatility setups
Scalpers using ORB-based entries
Traders seeking early-session fakeout traps to avoid false signals
Those combining with EMA 12/21, volume, or other confluence tools

HARSI PRO v2 - Advanced Adaptive Heikin-Ashi RSI OscillatorThis script is a fully re-engineered and enhanced version of the original Heikin-Ashi RSI Oscillator created by JayRogers. While it preserves the foundational concept and visual structure of the original indicatorusing Heikin-Ashi-style candles to represent RSI movementit introduces a range of institutional-grade engines and real-time analytics modules.
The core idea behind HARSI is to visualize the internal structure of RSI behavior using candle representations. This gives traders a clearer sense of trend continuity, exhaustion, and momentum inflection. In this upgraded version, the system is extended far beyond basic visualization into a comprehensive diagnostic and context-tracking tool.
Core Enhancements and Features
1. Heikin-Ashi RSI Candles
The base HARSI logic transforms RSI values into open, high, low, and close components, which are plotted as Heikin-Ashi-style candles. The open values are smoothed with a user-controlled bias setting, and the high/low are calculated from zero-centered RSI values.
2. Smoothed RSI Histogram and Plot
A secondary RSI plot and histogram are available for traditional RSI interpretation, optionally smoothed using a custom midpoint EMA process.
3. Dynamic Stochastic RSI Ribbon
The indicator optionally includes a smoothed Stochastic RSI ribbon with directional fill to highlight acceleration and reversal zones.
4. Real-Time Meta-State Engine
This engine determines the current market environmentneutral, breakout, or reversalbased on multiple adaptive conditions including volatility compression, momentum thrust, volume behavior, and composite reversal scoring.
5. Adaptive Overbought/Oversold Zone Engine
Instead of using fixed RSI thresholds, this engine dynamically adjusts OB/OS boundaries based on recent RSI range and normalized price volatility. This makes the OB/OS levels context-sensitive and more accurate across different instruments and regimes.
6. Composite Reversal Score Engine
A real-time score between 0 and 5 is generated using four components:
* OB/OS proximity (zone score)
* RSI slope behavior
* Volume state (burst or exhaustion)
* Trend continuation penalty based on position versus trend bias
This score allows for objective filtering of reversal zones and breakout traps.
7. Kalman Velocity Filter
A Kalman-style adaptive smoothing filter is applied to RSI for calculating velocity and acceleration. This allows for real-time detection of stalls and thrusts in RSI behavior.
8. Predictive Breakout Estimator
Uses ATR compression and RSI thrusting conditions to detect likely breakout environments. This logic contributes to the Meta-State Engine and the Breakout Risk dashboard metric.
9. Volume Acceleration Model
Real-time detection of volume bursts and fades based on VWMA baselines. Volume exhaustion warnings are used to qualify or disqualify reversals and breakouts.
10. Trend Bias and Regime Detection
Uses RSI slope, HARSI body impulse, and normalized ATR to classify the current trend state and directional bias. This forms the basis for filtering false reversals during strong trends.
11. Dashboard with Tooltips
A clean, table displays six key metrics in real time:
* Meta State
* Reversal Score
* Trend Bias
* Volume State
* Volatility Regime
* Breakout Risk
Each cell includes a descriptive tooltip explaining why the value is being shown based on internal state calculations.
How It Works Internally
* The system calculates a zero-centered RSI and builds candle structures using high, low, and smoothed open/close values.
* Volatility normalization is used throughout the script, including ATR-based thresholds and dynamic scaling of OB/OS zones.
* Momentum is filtered through smoothed slope calculations and HARSI body size measurements.
* Volume activity is compared against VWMA using configurable multipliers to detect institutional-level activity or exhaustion.
* Each regime detection module contributes to a centralized metaState classifier that determines whether the environment is conducive to reversal, breakout, or neutral action.
* All major signal and context values are continuously updated in a dashboard table with logic-driven color coding and tooltips.
Based On and Credits
This script is based on the original Heikin-Ashi RSI Oscillator by JayRogers . All visual elements from the original version, including candle plotting and color configurations, have been retained and extended. Significant backend enhancements were added by AresIQ for the 2025 release. The script remains open-source under the original attribution license. Credit to JayRogers is preserved and required for any derivative versions.

FNO Straddle/Strangle Premium TrackerThe FNO Straddle/Strangle Premium Tracker is a powerful Pine Script indicator designed for options traders to monitor the combined premium of a straddle or strangle strategy for Indian F&O instruments. It tracks the sum of call and put option prices, visualizes the premium as a candlestick or line chart, and includes technical indicators like EMAs and premium percentage change. The indicator also provides a real-time data table, alerts for key events, and exportable data for analysis, making it ideal for tracking premium movements and identifying trading opportunities.
Key Features
Customizable Inputs: Select from a wide range of underlying symbols (e.g., NIFTY, BANKNIFTY, stocks like RELIANCE, TCS), expiry date, call/put strike prices, chart type (Candlestick or Line), and timeframe (1-min to Daily).
Premium Visualization: Plots the combined premium (Call + Put) as a candlestick or line chart, with customizable colors for easy trend identification.
Exponential Moving Averages (EMAs): Displays 21, 100, and 200-period EMAs to track premium trends, with alerts for premium crossing above/below the 21-period EMA.
Premium % Change: Shows the percentage change in the combined premium as a histogram for quick momentum analysis.
Real-Time Data Table: A table in the top-right corner displays the latest premium, call/put Last Traded Prices (LTP), and EMA values (21, 100, 200).
Error Handling: Alerts users with a warning label if the selected symbol, expiry, or strike is invalid or data is unavailable.
Data Export: Outputs the latest premium, call LTP, and put LTP as a text string for easy copying or analysis.
LTP Label: Displays the current premium value every 5 bars for quick reference.
How It Works
Input Selection: Choose the underlying symbol, expiry date (YYMMDD format, e.g., 250626 for June 26, 2025), call and put strike prices, chart type, and timeframe.
Data Fetching: The script fetches real-time OHLC (Open, High, Low, Close) data for the selected call and put options using the specified symbol and expiry.
Premium Calculation: Combines the call and put option prices to calculate the straddle/strangle premium (Open, High, Low, Close).
Visualization: Plots the premium as a candlestick (green for bullish, red for bearish) or a blue line chart, along with EMAs, call/put LTP lines, and a premium % change histogram.
Alerts & Notifications: Triggers alerts when the premium crosses the 21-period EMA and displays a warning if data is invalid.
Data Display: Shows key metrics in a table and provides exportable data for further analysis.
Inputs
Select Symbol: Choose the underlying instrument (e.g., NIFTY, BANKNIFTY, RELIANCE, etc.).
Expiry Date: Enter the option expiry in YYMMDD format (e.g., 250626).
Call/Put Strike: Specify the strike prices for the call and put options.
Chart Type: Select "Candlestick" or "Line" to visualize the premium.
Timeframe: Choose the data aggregation period (e.g., 1-min, 5-min, Daily).
Outputs
Chart: Candlestick or line plot of the combined premium, with EMAs (21, 100, 200), call/put LTP, and premium % change histogram.
Table: Real-time display of premium, call/put LTP, and EMA values.
Alerts: Notifications for premium crossing EMA21 or invalid data.
Export Data: A text string with the latest premium, call LTP, and put LTP for external use.
Use Cases
Straddle/Strangle Trading: Monitor premium movements for at-the-money (ATM) straddles or out-of-the-money (OTM) strangles to time entries/exits.
Trend Analysis: Use EMAs to identify bullish or bearish trends in the premium.
Momentum Trading: Leverage the premium % change histogram to spot rapid price movements.
Risk Management: Track call and put LTP individually to assess option price behavior.
Data Analysis: Export premium data for backtesting or strategy development.
How to Use
Add the indicator to your TradingView chart.
Configure the inputs (symbol, expiry, strikes, chart type, timeframe) based on your trading setup.
Monitor the chart for premium trends, EMA crossovers, and % change signals.
Use the table and export data for real-time insights or external analysis.
Set up alerts to get notified when the premium crosses the 21-period EMA.
Notes
Ensure the symbol, expiry, and strike prices are valid for your data provider to avoid "Invalid Symbol" errors.
The indicator works best on Indian F&O instruments (NSE/BSE) with active options chains.
For optimal performance, use shorter timeframes (e.g., 1-min, 5-min) for intraday trading or Daily for positional analysis.
The premium % change histogram helps identify volatility spikes, useful for breakout strategies.
Limitations
Requires valid option chain data from TradingView’s data provider.
Performance may vary on low-liquidity instruments or illiquid strike prices.
Alerts are limited to EMA21 crossovers; additional custom alerts can be added as needed.
Feedback
If you have suggestions or need additional features (e.g., Bollinger Bands, RSI, or volatility metrics), feel free to comment! Happy trading!

Enhanced Daily Sentiment & Auction Area Trading StrategyDetermine Daily Sentiment (Anchor Chart - Daily TF):
Analyze Yesterday's Daily Candle: Look at the previous day's daily candlestick (high, low, open, close). This is the "most important information."
Establish Bias: If yesterday's candle was bullish (closed higher), the bias for today is generally long (approx. 80% of the time). If bearish, the bias is short.
Moving Average Context: Note if the daily price is above or below its short-term moving average (e.g., 21 or 50 MA). This should align with the candle's bias (e.g., bullish daily candle above its MA).
Pre-Market & Opening Analysis (Information Gathering):
Check for Gaps: Observe if the market is gapping up or down in the pre-market session relative to yesterday's close. This provides an early clue to current sentiment.
Consider Overall Sentiment: Briefly factor in relevant news or overarching market sentiment (e.g., data releases, overall market feeling from yields, gold etc.). Trading Window: Focus primarily on trading within the first hour of the U.S. market open, as this is when volatility is typically highest, which the strategy relies on.
Setup 5-Minute Chart for Execution (Trading TF - 5-min):
Apply Moving Average: Use the same short-term moving average (e.g., 21 or 50 MA) as on the daily chart.
Seek Alignment (Crucial): The 5-minute chart's trend and price action relative to its MA must align with the daily chart's bias and MA relationship.
If Daily bias is LONG (price above daily MA), the 5-minute chart should also show price establishing itself above its 5-min MA, ideally with a similar "45-degree angle" uptrend.
If Daily bias is SHORT (price below daily MA), the 5-minute chart should also show price establishing itself below its 5-min MA, with a similar downtrend. If there's no clear alignment between the daily and 5-minute chart structure/MA, do not trade.
Identify the "Auction Area" (Value/Congestion) on the 5-Minute Chart:
This is a recent area of congestion, a small support/resistance flip, or where price has paused, consolidated, and is retesting, often near the 5-minute MA.
Uptrend (Long Bias): Look for a pullback (a small "V" shape dip) towards the 5-minute MA or a recent small resistance-turned-support area. This is the "auction retest" before a potential breakout higher.
Downtrend (Short Bias): Look for a pullback rally (an inverted "V" shape) towards the 5-minute MA or a recent small support-turned-resistance area.

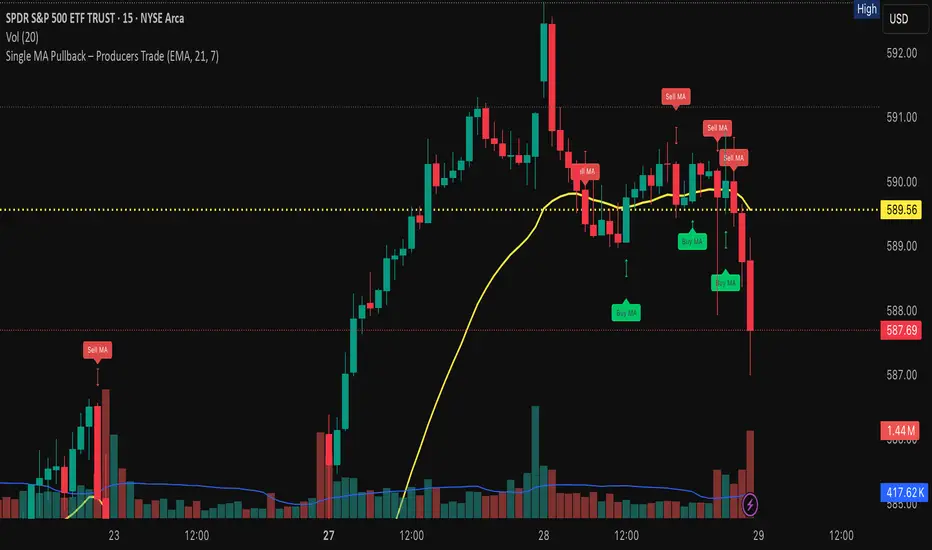
Single MA Pullback – Producers TradeHow to Use the “Single MA Pullback – Producers Trade” Indicator
This indicator helps options traders identify high-probability CALL and PUT signals based on price reacting to a single moving average.
⸻
✅ How It Works
• Select your preferred MA type (EMA, SMA, WMA, VWMA) and length.
• A Buy signal (CALL) is generated when price crosses above the MA.
• A Sell signal (PUT) is generated when price crosses below the MA.
• Visual arrows mark each signal, and a label suggests an option contract with strike and expiration.
⸻
🧠 Features
• Strike prices are automatically calculated ~1% out of the money.
• Expiration dates target the next Friday, based on the current day of the week.
• Symbol-specific strike rounding (e.g., 1 for SPY/XSP, 5 for most stocks).
⸻
📆 Expiration Date Notes
• Expiration dates shown in the label are based on a best-estimate to the next Friday.
• Depending on the time of day or day of week, the date may be off by one day.
• Always verify expiration dates on your trading platform before placing a trade.
⸻
📌 Important Tip on Expiration
A further out expiration is almost always a better idea — especially for:
• Avoiding time decay (theta)
• Holding through small pullbacks
• Letting your trade develop with less pressure
Even when the label suggests a short-dated contract, you can manually choose a longer expiration (e.g., 2–3 weeks out) for added safety and flexibility.
⸻
📈 Trading Suggestions
1. Green arrow = CALL setup. Red arrow = PUT setup.
2. Labels include trade type, strike price, and suggested expiration.
3. Confirm the signal with volume, price structure, or catalyst.
4. Manage your risk with proper sizing and optional stop-loss/target planning.
$ADD LevelsThis Pine Script is designed to track and visualize the NYSE Advance-Decline Line (ADD). The Advance-Decline Line is a popular market breadth indicator, showing the difference between advancing and declining stocks on the NYSE. It’s often used to gauge overall market sentiment and strength.
1. //@version=5
This line tells TradingView to use Pine Script v5, the latest and most powerful version of Pine.
2. indicator(" USI:ADD Levels", overlay=false)
• This creates a new indicator called ” USI:ADD Levels”.
• overlay=false means it will appear in a separate pane, not on the main price chart.
3. add = request.security(...)
This fetches real-time data from the symbol USI:ADD (Advance-Decline Line) using a 1-minute timeframe. You can change the timeframe if needed.
add_symbol = input.symbol(" USI:ADD ", "Market Breadth Symbol")
add = request.security(add_symbol, "1", close)
4. Key Thresholds
These define the market sentiment zones:
Zone. Value. Meaning
Overbought +1500 Extremely bullish
Bullish +1000 Generally bullish trend
Neutral ±500 Choppy, unclear market
Bearish -1000 Generally bearish trend
Oversold -1500 Extremely bearish
5. Plot the ADD Line hline(...)
Draws static lines at +1500, +1000, +500, -500, -1000, -1500 for reference so you can visually assess where ADD stands.
6. Horizontal Threshold Lines bgcolor(...)
• Green background if ADD > +1500 → extremely bullish.
• Red background if ADD < -1500 → extremely bearish.
7. Background Highlights alertcondition(...)
• Green background if ADD > +1500 → extremely bullish.
• Red background if ADD < -1500 → extremely bearish.
8. Alert Conditions. alertcondition(...)
Lets you create automatic alerts for:
• USI:ADD being very high or low.
• Crosses above +1000 (bullish trigger).
• Crosses below -1000 (bearish trigger).
You can use these to trigger trades or monitor sentiment shifts.
Summary: When to Use It
• Use this script in a market breadth dashboard.
• Combine it with price action and volume analysis.
• Monitor for ADD crosses to signal potential market reversals or momentum.

TICK Extreme Levels & AlertsAutomatically draws horizontal lines at +1000 and -1000 TICK levels
Sends alerts when TICK crosses those levels (for potential scalping/reversal setups)
Strategy: How to Use TICK in Real-Time Trading
1. Confirm Market Breadth
Use TICK to confirm broad participation in the move:
• Long S&P futures or SPY? Only buy breakouts if TICK is above +600 to +1000
• Shorting? Confirm with TICK below –600 to –1000
2. Fade Extremes for Scalps
Look for reversals at extreme levels:
• Fade +1200+: market likely overbought short term → scalp short
• Fade –1200–: market likely oversold → scalp long
Use in combo with other signals (like price exhaustion, candlestick reversal, or VWAP touches)
3. Avoid Trading in the Choppy Zone
If TICK remains between –400 and +400, institutions are not committed. This is where fakeouts are common.
4. Time Entries with TICK Swings
For example:
• TICK moves from –800 to +600 = momentum shift → look for long entries
• TICK stalling around +1000 = momentum climax → partial profit or fade play

No Gaps - JizzanyNo Gaps – Jizzany
Fill the blanks. Own the patterns.
Don’t let thin futures feeds or blazing-fast 1 s bars break your flow—this overlay stitches every missing pixel back into your chart so you can:
🔍 Analyze low-liquidity markets (futures, exotic FX, crypto alt-pairs) without awkward jumps
⏱️ Trade ultra-low timeframes (1 s, tick charts) with full confidence in every wick
📈 Spot price patterns seamlessly, even when your broker’s feed skips a beat
How it works: Auto-detects gaps between sessions or feeds, then draws miniature candles from the prior close to the current open—using real intrabar highs/lows—so nothing ever goes unseen.
Perfect for scalpers, day traders, and anyone who demands continuity in every bar. Try it on your next chart and rediscover the story in every candle.
Turn This
Into This
This
Into
Smash + Proba + BFThis script is designed to automatically display various levels that can be useful for trading.
These levels must be entered in the script as parameters in the form of lists separated by semicolons (";").
There are three groups of levels:
Smash: Levels provided in the Smashelito newsletter
Proba: Probability levels (50% and 70%) of reaching certain price points, calculated using options data
BF: Option-related levels provided by Krechendo Connect / BlackFlag
Example :

Failed 2s - The StratDescription:
This indicator detects and highlights "Failed 2" candlestick patterns from The Strat methodology — key price action setups signaling potential reversals or continuation points. It automatically identifies Failed 2 Down (Failed 2D) and Failed 2 Up (Failed 2U) signals by analyzing two consecutive bars, with special attention to price interaction at the 50% midpoint of the previous candle.
Visuals:
- Green upward triangles mark Failed 2 Down signals (bullish setups).
- Red downward triangles mark Failed 2 Up signals (bearish setups).
- Special signals that touch the 50% midpoint of the previous candle are emphasized but use the same shapes.
Alerts:
Built-in alert conditions let you receive notifications when these patterns occur, so you never miss a trade opportunity.
How to Use ALERTS in TradingView
- Paste this code into Pine Editor on TradingView.
- Click Add to Chart.
Set alerts:
- Click "Alerts" → "Condition" = your indicator name
- Choose the alert type (e.g. "Failed 2D Bar Alert")
- Set "Once per bar close"
- Customize the notification method (pop-up, app, email, etc.)
Anchored VWAP by Time (Math by Thomas)📄 Description
This tool lets you plot an Anchored Volume Weighted Average Price (VWAP) starting from any specific date and time you choose. Unlike standard VWAPs that reset daily or weekly, this version gives you full control to track institutional pricing zones from precise anchor points—such as key swing highs/lows, market open, or news-driven candles.
It’s especially useful for price action and Smart Money Concepts (SMC) traders who track liquidity, fair value gaps (FVGs), and institutional zones.
🇮🇳 For NSE India Traders
You can anchor VWAP to Indian market open (e.g., 9:15 AM IST) or major events like RBI policy, earnings, or breakout candles.
The time input uses UTC by default, so for Indian Standard Time (IST), remember:
9:15 AM IST = 3:45 AM UTC
3:30 PM IST = 10:00 AM UTC
⚙️ How to Use
Add the indicator to your chart.
Open the settings panel.
Under “Anchor Start Time”, choose the date & time to begin the VWAP.
Use UTC format (adjust from IST if needed).
Customize the line color and thickness to suit your chart style.
The VWAP will begin plotting from that time forward.
🔎 Best Use Cases
Track VWAP from intraday range breakouts
Anchor from swing highs/lows to identify mean reversion zones
Combine with your FVGs, Order Blocks, or CHoCHs
Monitor VWAP reactions during key macro events or expiry days
🔧 Clean Design
No labels are used, keeping your chart clean.
Works on all timeframes (1min to Daily).
Designed for serious intraday & positional traders.

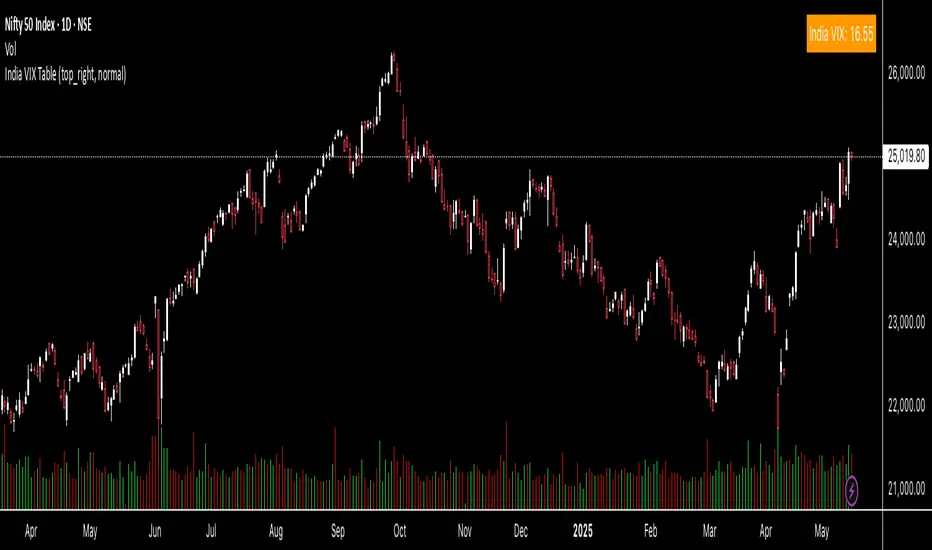
India VIX TableThis indicator gives you the India Vix value in real time on your chart. You can change the position on the chart as per your preference.