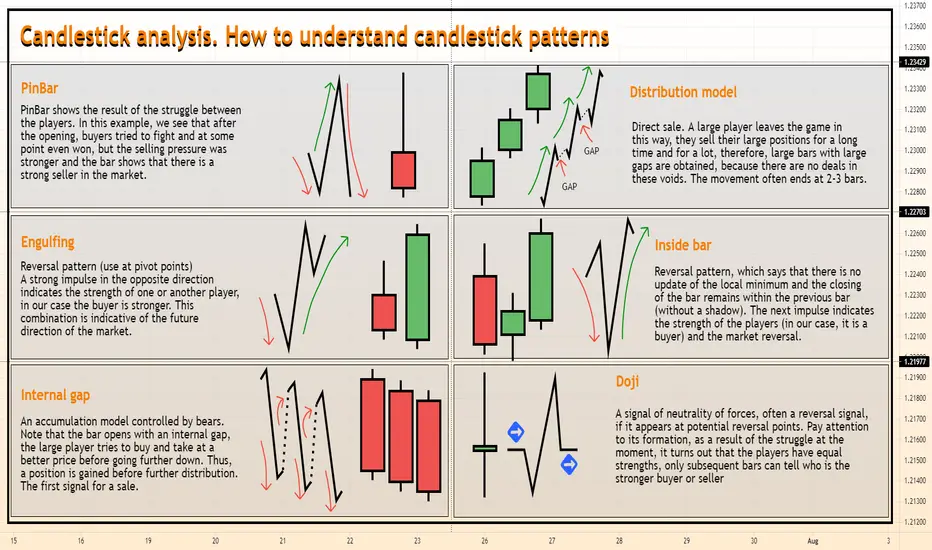
Candlestick analysis. How to understand candlestick patternsPinBar
PinBar shows the result of the struggle between the players. In this example, we see that after the opening, buyers tried to fight and at some point even won, but the selling pressure was
stronger and the bar shows that there is a strong seller in the market.
Engulfing
Reversal pattern (use at pivot points)A strong impulse in the opposite direction indicates the strength of one or another player, in our case the buyer is stronger. This combination is indicative of the future direction of the market.
Internal gap
An accumulation model controlled by bears. Note that the bar opens with an internal gap, the large player tries to buy and take at a better price before going further down. Thus, a position is gained before further distribution. The first signal for a sale.
Distribution model
Direct sale. A large player leaves the game in this way, they sell their large positions for a long time and for a lot, therefore, large bars with large gaps are obtained, because there are no deals in these voids. The movement often ends at 2-3 bars.
Inside bar
Reversal pattern, which says that there is no update of the local minimum and the closing of the bar remains within the previous bar (without a shadow). The next impulse indicates the strength of the players (in our case, it is a buyer) and the market reversal.
Doji
A signal of neutrality of forces, often a reversal signal, if it appears at potential reversal points. Pay attention to its formation, as a result of the struggle at the moment, it turns out that the players have equal strengths, only subsequent bars can tell who is the stronger buyer or seller
-------------------
Share your opinion in the comments and support the idea with Like.
Thanks for your support!
Priceaction

Candlestick analysis. How to understand candlestick patternsPinBar
PinBar shows the result of the struggle between the players. In this example, we see that after the opening, buyers tried to fight and at some point even won, but the selling pressure was
stronger and the bar shows that there is a strong seller in the market.
Engulfing
Reversal pattern (use at pivot points)A strong impulse in the opposite direction indicates the strength of one or another player, in our case the buyer is stronger. This combination is indicative of the future direction of the market.
Internal gap
An accumulation model controlled by bears. Note that the bar opens with an internal gap, the large player tries to buy and take at a better price before going further down. Thus, a position is gained before further distribution. The first signal for a sale.
Distribution model
Direct sale. A large player leaves the game in this way, they sell their large positions for a long time and for a lot, therefore, large bars with large gaps are obtained, because there are no deals in these voids. The movement often ends at 2-3 bars.
Inside bar
Reversal pattern, which says that there is no update of the local minimum and the closing of the bar remains within the previous bar (without a shadow). The next impulse indicates the strength of the players (in our case, it is a buyer) and the market reversal.
Doji
A signal of neutrality of forces, often a reversal signal, if it appears at potential reversal points. Pay attention to its formation, as a result of the struggle at the moment, it turns out that the players have equal strengths, only subsequent bars can tell who is the stronger buyer or seller
-------------------
Share your opinion in the comments and support the idea with Like.
Thanks for your support!
Key Patterns Of Price ActionKey Patterns Of Price Action
Key patterns of price action.
Below I will describe several key patterns, but on the diagrams you can see the analysis from a technical point of view.
And also please pay attention to the rules, which I do not advise to ignore.
The Cup with a handle pattern is formed according to the following logic:
- On an upward movement, the bulls cannot push through the next resistance level , a correction begins. It is undesirable that there were impulses during a rollback, a moderate downward movement should be observed;
-By basic rules, the bottom of the cup should be formed in the area of correction levels. A deeper rollback is allowed in modified models. In case of a deep correction after entering the market, the position is transferred to breakeven as soon as possible, the probability of the trend continuation is lower, it is better to insure;
Double bottom
It all starts with the formation of a new low on a downtrend, after which a rollback against the trend occurs.
Then, the price goes down again and rests against the previous low. And finally, after pushing off from this level, an upward movement begins, which breaks through the level of the previous local maximum. It is after the breakout of this level (confirmation line) that the final formation of the 'Double Bottom' occurs and you can start buying.
The same is with a reversal in an upward market. After the first high, the price should fall by at least 10%. Otherwise, it will mean that the bears are not strong enough.
Saucer
Let's start with the shape of the figure. Contrary to its name, the correct shape of the 'Saucer' figure rather resembles a bowl.
As you can see, the figure is formed by a smooth price movement along a parabolic trajectory. The first half of the figure (the left side of the saucer) is a smooth descent from the edge of the saucer to its bottom. The second half of the figure (the right side of the saucer) is the same smooth rise from the bottom to the edge. Ideally, the second half should be a mirror image of the first. And the bottom should in no case be sharp .
The classic 'Saucer' is formed, as a rule, on large timeframes from D1. But you can also find him on H1.
Flat base
In trading, the term flat means an area on the chart, without a clearly defined direction of price movement, that is, a trend. In other words, flat is the opposite of a trend.
Misc Rules
-all BP = 10 pips
-ideal prior uptrend >30%
-for wks abv avg vol: #up>#down
-up 20% for new base
- undercut base resets base count
- 66% or 3rd stage base fails
- 80% of 4th stage base fails
- in base bottom look for
- shakeout
- tight closes
- volume dryout
- accumulation
great
thanks
PHASES, MARKET BEHAVIORA Growing trend. Bull market
CONSOLIDATION (ACCUMULATION)
Large players risk unlocking the potential of the instrument, actively investing, although there is no clear picture of further growth. The market is full, big exchanges, big losses, someone manages to make money. Energy is accumulating
STRONG BULLISH TREND
The beginning of the excitement, news,
speculative activity, brokers, sales departments,
solid motivation for all speculators to purchase the
instrument. Technical traders make a lot of money
in these times of the market.
Capturing liquidity and deceiving participants by a large player. They drag the price above the previous peaks, supposedly showing that we will move up, and then turn around and go down, collect everything that is needed and after accumulation continue to follow the trend.
MADNESS STAGE
The market is very active, the participants catch up with the departing train and try to drop in to earn money.
A Falling trend. Bear market
DISTRIBUTION
Large players are exiting the market for high pitched reasons. There is unloading, distribution. Private traders are still active. High volumes. Decrease.
PANIC PHASE
More and more sellers appear, including large ones. The fall is accelerating, the sell-off is strong. Strong buyers change positions or leave the market.
The third phase is a huge drawdown, a hopeless situation for buyers. The downward movement is gradually stopping, but there is still no major buyer in the market, everything is characterized by negative news or market sentiment.
-------------------
Share your opinion in the comments and support the idea with likes.
Thank you for your support!

What is impulse and how to make money on it?What is momentum and how to make money on it?
Momentum is a sharp paranormal price movement in one direction or another, unusual for average daily fluctuations of an asset
How to build zones from which impulse movement is most likely to occur?
1) The price is pushed back from the previously built level
2) There is an impulse movement in the other direction
3) Correction to the level, from which the price pushed a little
4) consolidation, consolidation below the level, from which there will be an impulse movement
How it works?
1) the level above which the price consolidates and repels
2) Rollback from the price level at the moment
3) Impulse that breaks the level
4) We need to extend the level to understand where the key point will be
5) Fixing the price below the level
6) In anticipation of an impulse movement, at the very beginning of the movement, after fixing, we open an order
*** Works in the same way in long
What do you need to do, what to earn on this?
1) If you use impulses not all in a row, but the very first one after a trend reversal, then we have a chance to pick up all the movements, it all depends on your benchmarks, where you exit the market, according to your strategies.
2) Not every impulse level is the first, we estimate the situation from strong levels, from which the price can reverse
3) We focus on the opening of the session, the chance that the market will reverse at the end of the working day and give you less profit if it is at the beginning.
It is important to understand:
Price moves from level to level
The price does not always fix directly below / above the level
You can work both on the younger (m5, m15, m30, h1, ch4) and on the higher timeframes (d1, b1, m1 )
The older the timeframe, the stronger the level from which an impulse can follow
During an impulse, funds are injected, a large player enters the market or a major player exits the market, stops-losses are collected, i.e. removal of market participants.
Our goal is to follow a major player who leads the price and get profit from it

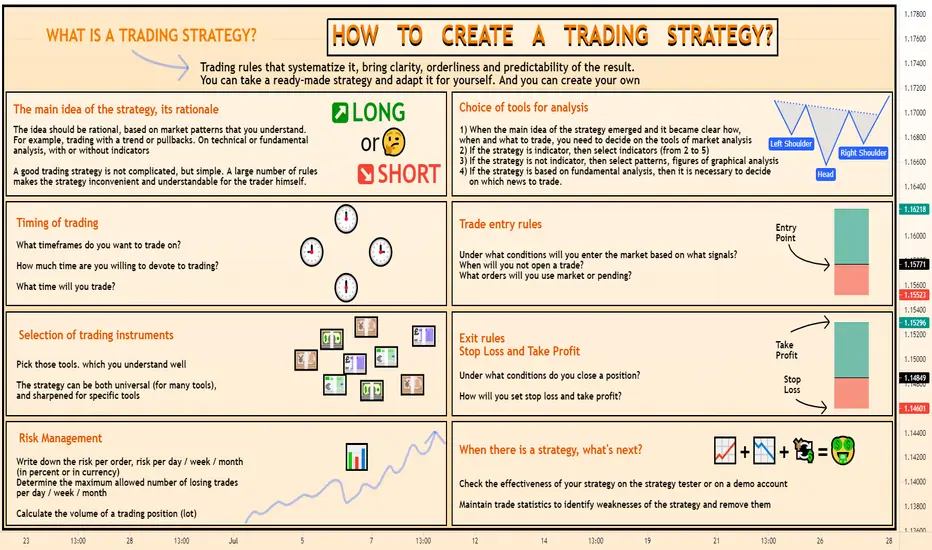
How to create a trading strategy?HOW TO CREATE A TRADING STRATEGY?
WHAT IS A TRADING STRATEGY?
Trading rules that systematize it, bring clarity, orderliness and predictability of the result. You can take a ready-made strategy and adapt it for yourself. And you can create your own
The main idea of the strategy, its rationale
The idea should be rational, based on market patterns that you understand. For example, trading with a trend or pullbacks. On technical or fundamental analysis , with or without indicators
A good trading strategy is not complicated, but simple. A large number of rules makes the strategy inconvenient and understandable for the trader himself.
Timing of trading
What timeframes do you want to trade on?
How much time are you willing to devote to trading?
What time will you trade?
Selection of trading instruments
Pick those tools. which you understand well
The strategy can be both universal (for many tools), and sharpened for specific toolsChoice of tools for analysis
1) When the main idea of the strategy emerged and it became clear how, when and what to trade, you need to decide on the tools of market analysis
2) If the strategy is indicator, then select indicators (from 2 to 5)
3) If the strategy is not indicator, then select patterns, figures of graphical analysis
4) If the strategy is based on fundamental analysis , then it is necessary to decide on which news to trade.
Trade entry rules
Under what conditions will you enter the market based on what signals?
When will you not open a trade?
What orders will you use market or pending?
Exit rules
Stop Loss and Take Profit
Under what conditions do you close a position?
How will you set stop loss and take profit?
Risk Management
Write down the risk per order, risk per day / week / month
(in percent or in currency)
Determine the maximum allowed number of losing trades
per day / week / month
Calculate the volume of a trading position (lot)
When there is a strategy, what's next?
Check the effectiveness of your strategy on the strategy tester or on a demo account
Maintain trade statistics to identify weaknesses of the strategy and remove them
Find me on:
Understanding Market Structure1) Consolidation
The market enters this phase after a strong movement. Sellers control buyers, which further leads to a downward trend
2) Down trend
Bearish phase - lower lows and lower highs. This is where traders want to go short on breakouts or from levels
3) Distribution
Occurs after a prolonged fall in prices, when buyers gain control of prices, resulting in higher prices
4) Up trend
The bull phase is where you want to be long. See to buy short breakout moves after long rallies have exhausted themselves. Attempts to rally are considered guilty until proven innocent
-------------------
Share your opinion in the comments and support the idea with likes.
Thank you for your support!

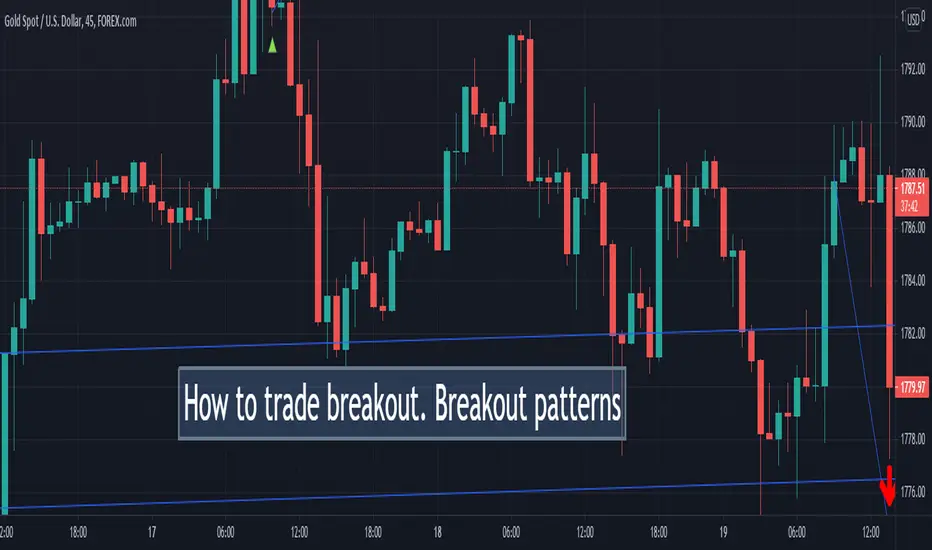
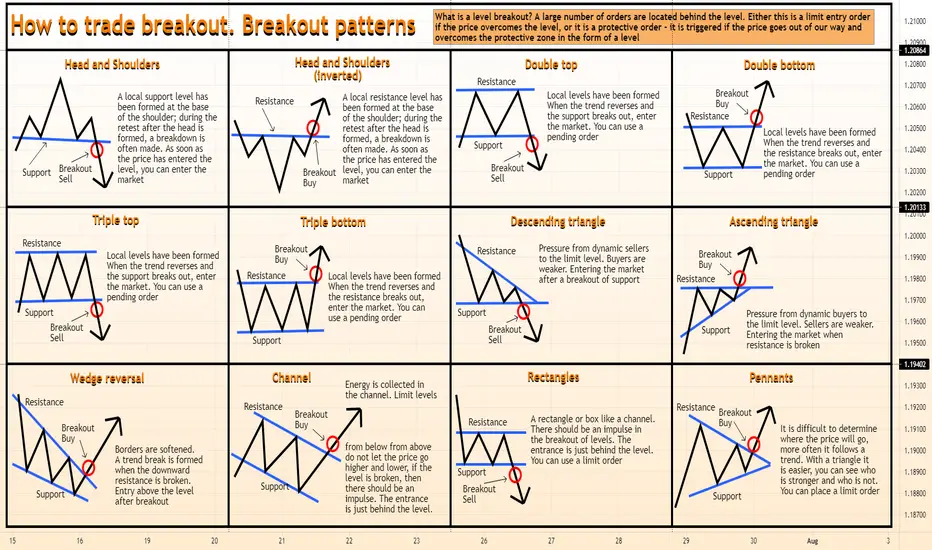
How to trade breakout Breakout patternsWhat is a level breakout? A large number of orders are located behind the level. Either this is a limit entry order
if the price overcomes the level, or it is a protective order - it is triggered if the price goes out of our way and
overcomes the protective zone in the form of a level
-------------------
Share your opinion in the comments and support the idea with Like.
Thanks for your support!
How to trade breakout. Breakout patterns What is a level breakout? A large number of orders are located behind the level. Either this is a limit entry order
if the price overcomes the level, or it is a protective order - it is triggered if the price goes out of our way and
overcomes the protective zone in the form of a level
-------------------
Share your opinion in the comments and support the idea with Like.
Thanks for your support!

IMPROVE YOUR TRADING | 4 TYPES OF TRADE CONFIRMATION ✅👌
"Look for a confirmation!"
"Wait for a confirmation!"
When I was learning how to trade and when I was watching and reading different trading educators, these words naturally pissed me off. What the hell are you talking about? What confirmation?
It was a full-blown mystery...🤯
Then, once I started to mature in trading and trade full-time, I became an author on TradingView.
Posting my forecasts and trading setups, I frequently mentioned the confirmation.
And now the newbies that are reading me and learning from me are pissed off...🤬
That is so funny I guess.
But the truth is that the confirmation must become a fundamental part of your trading strategy. It is your key to successful trading.
What exactly is the confirmation?
It depends on many many different things, in this article I will discuss with you the 4 main types of confirmation and give you detailed examples.
1️⃣ - PRICE ACTION CONFIRMATION
That is actually what I prefer.
Analyzing different markets and searching for decent trading opportunities often times we find some peculiar instruments to watch.
Identifying the market trend and key levels we find the potential spots to trade from.
But do we just open the trade once the "ZONE" is spotted?
I wish it could be that simple...
Trading just the zone, without additional clues brings very negative figures. We definitely need something else.
Price action & candlestick patterns can be those clues.
Accurate reflection of the current local market sentiment makes the patterns a very reliable confirmation.
Dodji's, pin bars, double tops/bottoms ...
Proven by history, the skill of identification & reading the patterns will pay off quickly.
Being in some sense the language of the market, the patterns are the fundamental part of my trading strategy.
2️⃣ - FIBONACCI LEVELS
Fibonacci levels are a very popular technical tool. Being applied properly it helps the trader to confirm or, alternatively, disqualify the identified "ZONE".
With multiple different methods like confluence trading, fibs are applied in hedge funds and various banking institutions.
The main problem with the fibs, however, is complexity and a high degree of subjectivity. Meeting different traders and watching different posts on TradingView I noticed that all traders tend to have their own vision. There is no universal system to apply here, a proper fib.confirmation technique can be built only with long-lasting backtesting and practicing.
3️⃣ - FUNDAMENTAL NEWS
The figures in the economic calendar, news, tweets. Actual fundamental news can become your best confirmation tool.
However, the main obstacle right here is the promptness, validity and reliability of the data that you get.
The information shouldn't be delayed and it must be objectively true.
The search for such a source is by itself is a very time-consuming and labor-intensive business not even mentioning its potential costs.
And that is not all. Knowing how to make sense of that data, its proper perception, and understanding requires a solid economical and financial background and experience.
At the end of the day, becoming an expert in fundamental analysis, the trader can easily sort the trading zones and trade only the ones that are confirmed by a decent fundamental trigger.
4️⃣ - TECHNICAL INDICATORS
I believe all the traders apply some indicators. From a simple moving average to some complex composite algorithms, indicators play a very important role in trading.
Being 100% objective and providing up-to-date real numbers and figures, they are our allies in a battle against subjectivity.
For many traders, the various signals from indicators are considered to be accurate and reliable confirmations.
Many algotrading solutions are operating simply relying on such signals and being able to bring consistent profits proves the power of technical indicators.
What confirmation type should you rely on?🧐
I guess the main rule right here is that the confirmation must MAKE SENSE to you. You should feel the logic behind that. It must make you confident in your action, even in case of the occasional losses, it must keep you calm and humble.
Let me know in a comment section what confirmation do you prefer!
💝Please, support my work with like and comment!
Thank you for reading.

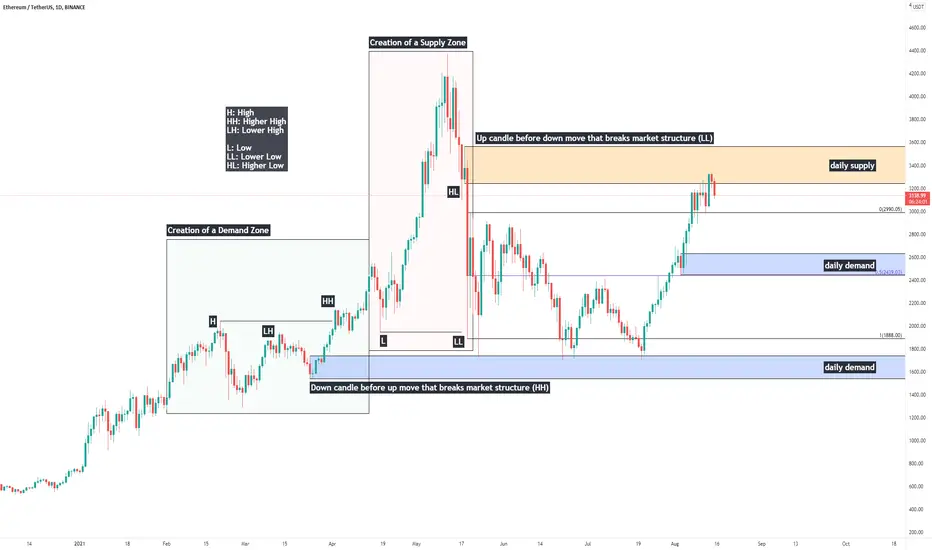
Price Action Study: Single Candle Supply & Demand ZonesHappy Sunday everybody, today I'll be providing a quick writeup on identification of single-candle Supply & Demand zones, otherwise known as "Orderblocks" (Credits to ICT for coining this phrase)
Supply & Demand are one of the most fundamental aspects of trading securities.
In price action - liquidity is believed to be the driving force behind market movements. The primary reason assets move is because of an imbalance between buyers and sellers - supply & demand.
If supply outweighs demand, price moves down.
If demand outweighs supply, price moves up.
If supply and demand are relatively the same - the market consolidates.
Supply and demand zones are created during consolidations - and today we are going to look at how to identify them. When prices is to return to these zones, we look for signs of accumulation to go long, or distribution to short.
Single candle supply and demand zones are also commonly referred to as "orderblocks" - here's how to identify them.
Demand/Bullish OB: A down candle before an up move that breaks market structure - a higher high.
Supply/Bearish OB: An up candle before a down move that breaks market structure - a lower low.
It is an important distinction - we need a structural break for the zone to be a meaningful region to watch if/when price is to return.
-Will, OptionsSwing Analyst
Understanding Market Structure1) Consolidation
The market enters this phase after a strong movement. Sellers control buyers, which further leads to a downward trend
2) Down trend
Bearish phase - lower lows and lower highs. This is where traders want to go short on breakouts or from levels
3) Distribution
Occurs after a prolonged fall in prices, when buyers gain control of prices, resulting in higher prices
4) Up trend
The bull phase is where you want to be long. See to buy short breakout moves after long rallies have exhausted themselves. Attempts to rally are considered guilty until proven innocent
-------------------
Share your opinion in the comments and support the idea with likes.
Thank you for your support!

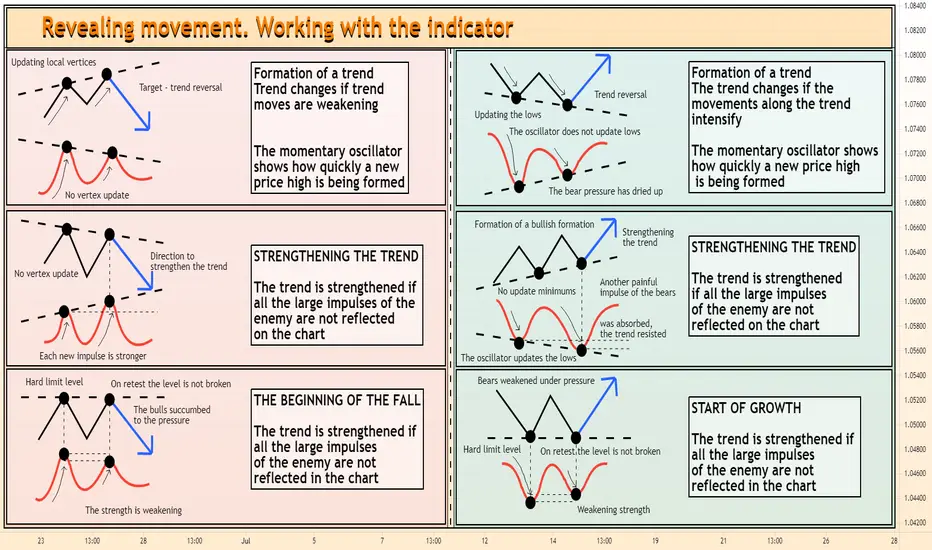
Revealing movement. Working with the indicatorRevealing divergence. Working with the indicator
I analyze the market, absolutely any trader is interested in seeing in advance where the price of a particular currency pair or another asset will move. After all, his profit depends on it. To win, it is important to see Forex divergence on all timeframes
In this article, we will understand the concept of divergence, and also learn how to determine divergence
A divergence or divergence can tell us that the market is ready to go in the opposite direction. In other words, divergence should be considered the moment when the direction of price movement does not coincide with the direction of movement of the Forex indicator. Moreover, this can be observed both in the direction of the trend line and against it. It is better, of course, that the divergence occurs in the direction of the global trend.
-------------------
Share your opinion in the comments and support the idea with likes.
Thank you for your support!
Risk-free and safe trading Safe is the closing of half of the order when the profit distance is equal to your risk, that is, in such a way that the profit from the closed part of the order is equal to the size of the stop loss loss, if the price movement does not go in our direction.
This is important in order to fix the profit on a part of the order, and set a stop loss equal to the profit on the first part of the order for the rest of the part, then we are in the market without risk!
But here it is possible to move the stop loss to the point of entry into the market after the distance passed by the price equal to the risk, then if the price turns against us and closes by the stop loss, then we will be in profit
In 65-70%, if a technical entry goes to "plus", if you entered correctly, in other cases the deal will be closed by stop loss, but thanks to the SAFE there will be no loss!
These laws are already guaranteed to allow you never to drain your deposit and, as a result, start earning
-------------------
Share your opinion in the comments and support the idea with likes.
Thank you for your support!

Closer look into Rising/Falling Wedge, Reversal Price Action
Closer look into Rising/Falling Wedge, Reversal Price Action structures/patterns
Hi traders:
Today I will go more in detail on rising/falling wedge correction in price action structures/patterns.
You might have already heard about these types of correctional structures, and many traders who utilize them.
Certainly there are many ways of traders identifying them and taking advantage of these kinds of price action, so it's ideal for you to understand them in your analysis.
We first need to understand that a rising/falling wedge is a REVERSAL price action. Meaning when the correction completes, there's a higher probability of the price to reverse.
You might have already seen multiple price action videos from me that go over all sorts of continuation and reversal price action (I will share links below),
and I always talk about when combining multiples of different price action structures/patterns will give you a better edge at entering positions that work out in your favor.
Same idea here, so let's take a look at how rising/falling wedges are, how to identify them, and how to effectively use them in your analysis.
Rising/falling wedge, just as the name suggests, is an ascending/descending type of correction where the price is getting squeezed into a “wedge”.
As the price gets narrower and narrower, there's a higher probability of the price to “reverse” from the wedge.
Now about entries, certainly many traders have their own method of entering, so I will share my point of view and the way how I like to enter them.
Any questions, comments or feedback welcome to let me know :)
Thank you
Risk Management: 3 different entries on how to enter the impulsive phrase of price action
Multi-time frame analysis
Identify a correction for the next impulse move in price action analysis
Continuation and Reversal Correction
Continuation Bull/Bear Flag
Parallel Channel (Horizontal, Ascending, Descending)
Reversal Ascending/Descending Channel
Reversal Double Top/Bottom
Reversal Head & Shoulder Pattern
Reversal “M” and “W” style pattern
Reversal Impulse Price Action
Continuation/Reversal Expanding Structure/Pattern

How to create a trading strategy?HOW TO CREATE A TRADING STRATEGY?
WHAT IS A TRADING STRATEGY?
Trading rules that systematize it, bring clarity, orderliness and predictability of the result. You can take a ready-made strategy and adapt it for yourself. And you can create your own
The main idea of the strategy, its rationale
The idea should be rational, based on market patterns that you understand. For example, trading with a trend or pullbacks. On technical or fundamental analysis, with or without indicators
A good trading strategy is not complicated, but simple. A large number of rules makes the strategy inconvenient and understandable for the trader himself.
Timing of trading
What timeframes do you want to trade on?
How much time are you willing to devote to trading?
What time will you trade?
Selection of trading instruments
Pick those tools. which you understand well
The strategy can be both universal (for many tools), and sharpened for specific toolsChoice of tools for analysis
1) When the main idea of the strategy emerged and it became clear how, when and what to trade, you need to decide on the tools of market analysis
2) If the strategy is indicator, then select indicators (from 2 to 5)
3) If the strategy is not indicator, then select patterns, figures of graphical analysis
4) If the strategy is based on fundamental analysis, then it is necessary to decide on which news to trade.
Trade entry rules
Under what conditions will you enter the market based on what signals?
When will you not open a trade?
What orders will you use market or pending?
Exit rules
Stop Loss and Take Profit
Under what conditions do you close a position?
How will you set stop loss and take profit?
Risk Management
Write down the risk per order, risk per day / week / month
(in percent or in currency)
Determine the maximum allowed number of losing trades
per day / week / month
Calculate the volume of a trading position (lot)
When there is a strategy, what's next?
Check the effectiveness of your strategy on the strategy tester or on a demo account
Maintain trade statistics to identify weaknesses of the strategy and remove them
Learn How to Trade Double Bottom Formation | Full Guide 📚
Hey traders,
If you are learning price action trading, you definitely must know a double bottom pattern.
Double bottom is a reversal pattern.
It is applied to spot early market reversal clues and catch the initiation of a new bullish trend.
Preconditions for a double bottom:
1️⃣ The market must trade in a bearish trend.
2️⃣ After a formation of the last lower high, the price must set equal low.
3️⃣ The price must return back to the last lower high level.
✅Once these conditions are met the pattern is considered to be completed.
The formation of the pattern is considered to be a ⚠️WARNING sign.
Even though many traders buy the pattern once it is completed,
for me it is not enough.
❗️Remember that the price can easily start to consolidate and form a horizontal channel for example.
The trigger that we will look for is the breakout (candle close above) the last lower high level (based on a wick and its highest candle close) - the neckline.
Being broken to the upside, the market sets a new higher high.
It signifies a violation of a current bearish trend.
⬆️Attempting to catch an initiation of a bullish trend, we will buy the market with a buy limit order on a retest of a broken neckline.
❌Safest stop will lie below the lows of the pattern.
💰Your reward must be at least 1.5 of your risk.
Following these simple rules, you will be impressed by how accurate this pattern is!
❤️Please, support this idea with a like and comment!❤️

Continuation & Reversal Correction in price action structures
In-depth look at Continuation & Reversal Correction in price action structures/patterns
Hi everyone:
Today I want to revisit the fundamental aspect of trading impulsive and corrective phases in Price Action Analysis.
As you all know I focus on multi-time frame analysis and forecasting/anticipating the next impulsive move in the market.
To me, the most important part of identifying the next impulsive phase of the market, is to understand how correction works.
An impulse phase usually happens after a correction has finished correcting, so the key is to identify and understand how a corrections structure will complete so we anticipate the next impulsive move.
You may have seen my videos on this topic, but today I will go more in detail on this, and explain the 2 types of correctional structure the market can create.
The market can only be in 2 phases, impulsive phrase or corrective phrase.
In addition, the corrective phrase can only be continuation, or reversal.
So to fully have an edge in the market, is to understand what the correctional structure the price is currently making,
whether a continuation/reversal, then forecast the possible price outlook, and go down to the lower time frames for possible entries.
Now, it's important to understand that different traders/strategies/styles will call these patterns/structures in varies names.
What they are called or identify isn't important, but the important aspect is to understand whether they are continuation, or they are reversal.
In addition, simply seeing price action structures/patterns by itself, is not a good enough entry criteria for me.
You want to combine multi- time frame analysis, top-down approach, and with multiples of these price actions all happening so it adds extra confluence for you to enter a particular trade.
Seeing a H and S pattern, on a 5 minute chart, without considering the overall HTF and other factors, will not be a consistent move in the long run.
Continuation Correctional Structure/Pattern
Bullish/Bearish Flag
Bullish/Bearish Pennant
Parallel Channel
Reversal Correctional Structure/Pattern
Ascending/Descending Channel
Rising/Falling Wedge
Double Top/Bottom
Head & Shoulder Pattern/Inverse H and S
“M” and “W” style pattern
Reversal Impulse Price Action
I will forward all the price action structures/patterns videos I have made in the past to help you understand each of the structures more.
Impulse VS Correction
Multi-time frame analysis
Identify a correction for the next impulse move in price action analysis
Continuation Bull/Bear Flag
Parallel Channel (Horizontal, Ascending, Descending)
Reversal Ascending/Descending Channel
Reversal Double Top/Bottom
Reversal Head & Shoulder Pattern
Reversal “M” and “W” style pattern
Reversal Impulse Price Action
Continuation/Reversal Expanding Structure/Pattern
Any questions, comments or feedback please let me know. :)
Thank you
Jojo

What is impulse and how to make money on it?What is momentum and how to make money on it?
Momentum is a sharp paranormal price movement in one direction or another, unusual for average daily fluctuations of an asset
How to build zones from which impulse movement is most likely to occur?
1) The price is pushed back from the previously built level
2) There is an impulse movement in the other direction
3) Correction to the level, from which the price pushed a little
4) consolidation, consolidation below the level, from which there will be an impulse movement
How it works?
1) the level above which the price consolidates and repels
2) Rollback from the price level at the moment
3) Impulse that breaks the level
4) We need to extend the level to understand where the key point will be
5) Fixing the price below the level
6) In anticipation of an impulse movement, at the very beginning of the movement, after fixing, we open an order
*** Works in the same way in long
What do you need to do, what to earn on this?
1) If you use impulses not all in a row, but the very first one after a trend reversal, then we have a chance to pick up all the movements, it all depends on your benchmarks, where you exit the market, according to your strategies.
2) Not every impulse level is the first, we estimate the situation from strong levels, from which the price can reverse
3) We focus on the opening of the session, the chance that the market will reverse at the end of the working day and give you less profit if it is at the beginning.
It is important to understand:
Price moves from level to level
The price does not always fix directly below / above the level
You can work both on the younger (m5, m15, m30, h1, ch4) and on the higher timeframes (d1, b1, m1)
The older the timeframe, the stronger the level from which an impulse can follow
During an impulse, funds are injected, a large player enters the market or a major player exits the market, stops-losses are collected, i.e. removal of market participants.
Our goal is to follow a major player who leads the price and get profit from it
