Using the Regression Trend Tool to Analyze USDJPYCurrency charts (or any chart) can look rather chaotic sometimes.
Grabbing a regression trend tool may help. You select the tool and the pick the two points...usually a major high and low.
The regression tool then finds the line of best fit through the data. You can also add standard deviations above and below the regression line, resulting in a channel.
The result will be slightly different than a drawn channel because it is essentially highlighting the average price action between two points in time.
I have used the tool twice on the USDJPY chart. The larger one shows the price is near the top of a larger channel. The smaller shows the price is near the bottom of a short-term channel.
This helps highlight some potential trading opportunities. If the price consolidates here and moves higher (would use 4-hour chart), it is a buy trade into the top of the small and larger channels. But if that occurs, once the price reaches the upper channel, watch for a potential short (or break to the upside).
Alternatively, if we head lower from here, that will break the short-term rising channel, and indicate a pretty big downward move based on the larger channel.
You could freehand draw these channels as well, but sometimes a crazy one day move will obscure a pattern that the regression highlights. For example, the regression filters out that one day drop on Jan 2 2019....without the regression (or without ignoring that long candle wick) it is hard to see the channel.
You could also go back further in time and add in additional regression channels to provide a larger insight into where the currency pair is within its cycle.
Want more like this? Discuss trades in my free swing trading Facebook group: www.facebook.com
Trend

XAUUSD NEW UPDATEFOREXCOM:XAUUSD
I EXPECT THAT IT WOULD BE STRAIGHT FALL THIS WEEK. LETS SEE
GOODLUCK !

Pyramiding money management. 2 part. Short LTC/USD This is the second part of the training material on the method of capital management - pyramiding or scaling as it is also called. Let me remind you once again in the first part of working long with an uptrend, we earned $ 20,000 - $ 52,000 time.
Read more about the process of working in long in this trading idea: Pyramiding How to earn 52000 with a risk of 5% from 20000 1part
After the breakthrough of the upward channel and exit from a long position, a downtrend and a downtrend are formed for us on the LTC / USD pair.
Here is my idea for June before breaking through the rising channel.
LTC / USD June
The trend is broken. A downtrend and a downtrend formed. Here is my trading idea for August:
SHORT LTC uptrend is broken. Trading in the downward channel.
LTC / USD August
______________________________________________________
Let's go back to our example of LTC / USD money management by pyramiding in a downward channel. When working long in an uptrend, we earned $ 52,000 on this coin from an initial deposit of $ 20,000 . Round up to $ 50,000.
Divide the amount into 3 parts of the entrance. A less risky entry point is the first, like a coin at the beginning of its downtrend and a big profit from the uptrend. Therefore, the first purchase will be a large amount.
First purchase - $ 30,000
Second purchase - $ 10,000
Third purchase - $ 10,000
Stop loss is always 5% and moves behind the price of a downtrend. Stop loss should always be behind the downtrend line. (outside the upper boundary of the downward channel). Breaking it will mean a potential change in trend.
_____________________________________________________
As a result of currently open trading deals, we have a profit:
1 purchase for $ 30,000 + 42% = $ 42,600 (net profit $ 12,600)
2 purchase for $ 10,000 + 19% = $ 11,900 (net profit of $ 1900)
3 purchase for $ 10,000 + 0% = as soon as we opened a deal (there is now an option to break the downtrend).
The risk is always 5%
The total net profit of work in the downward channel is currently + $ 14,500
$ 6,400 total position
______________________________________________________
If all 3 sales target work out as planned, then the potential from the entry point:
1 purchase - $ 53400 (net profit of $ 23,400).
2 purchase - $ 17,000 (net profit of $ 7,000).
3 purchase - $ 16,200 (net profit of $ 6,200).
Total short profit: $ 86,600 (net profit $ 36,600).
_____________________________________________________
If we take into account the work in an uptrend that we started with $ 20,000, then the net profit is $ 66,600 and this is on the same coin with a 5% risk and during this period we will only make 8 transactions. This is not fantasy, this is reality. I worked like this for more than a year on the ETH / USD pair in the downstream channel, all the ideas and work in the channel were published in my chat, also partially had ideas here, for example this one for December 2018 I complicated the work a little, but I increased my profits several times, I worked from trending channels. Also, most of the trading transactions were made from the trend lines of the internal channel.
This trading idea for December 2018, but I started trading this downward channel from March 2018.
ETH / USD
_______________________________________________________________
Money management by pyramiding or scaling.
The pyramiding method of money management (scaling) today is very popular among traders with experience. The essence of this method is the sequential opening of several transactions on the trend. We increase our position as profit grows, not loss.
Pyramiding method of money management is perfectly combined with a positional trading strategy. Also, this method increases the deposit well when a trader trades in upward (long work) and downward channels (short work).
Pyramid trading is a strategy that involves adding a new position to an existing profitable position. In other words, these are purchases or sales in order to add to an existing position, after the market has developed movement in a profitable direction for you. You are increasing your position. At the same time, the size of each next transaction may change taking into account the result of the previous one, that is, the position increases when you make a profit in the previous transaction to increase the deposit at a faster pace or after receiving a loss to accelerate the exit from the drawdown.
This is the main advantage of using pyramiding in trading. If you did everything right, then do not expose your trading capital to additional risk. In fact, you reduce risk as the market moves in a profitable direction for you. The main thing is to correctly determine the trend and "sit" on it. The most difficult moment is to determine the beginning of a trend.
On a bull trend it is better to always work on the bull side; on a bearish trend , on a bearish side. Always follow the trend!
However, just as pyramiding can be profitable, it can also be dangerous if used improperly. The main thing is to determine the trend correctly.
Many experienced traders consider this method the only possible way to quickly disperse the "deposit". One well-defined trend lasting only 1-2 weeks can double, triple the deposit with the right approach. Moreover, the risk is only 2% -5%.
It is very important, do not confuse averaging and pyramiding, since these two approaches are completely different. Averaging occurs when the price goes against our position. And pyramiding is the other way around when the price is in your favor.
Pyramiding allows you to achieve a super effective profit / risk ratio by transferring stop loss as the trend moves in your favor.
______________________________________________________
How to carry out a set of positions according to the trend, when to enter.
Another important issue in pyramiding is: when do you actually enter a deal, gain a position more? The answer to this question can be divided into several approaches. Each of them has its pros and cons and in different situations will give different results. Just who is comfortable and who is more used to what they trade.
Entrance to the transaction during the construction of the "pyramid":
1) On kickbacks.
2) On signs of continued movement. For example, it can be a powerful volume entry or a hammer candlestick pattern.
3) During the breakdown of important levels.
___________________________________________
How to use stop loss when building a "pyramid".
Naturally, with pyramiding, stop loss is used. It is recommended to use a separate stop for each entry (to buy the position). As the trend develops, it should be pulled up.
For example, I use 2 stop loss. Regardless of how much I had as the trend of inputs on kickbacks grew. The first is the top, which is about 30% of the entire position. As a rule, it is equivalent to the stop loss level of the last entry (buy by trend). The second is 70% of the position, this is when the trend breaks. Both stop losses are tightened as the trend grows.
It is logical to use stop loss outside of some important levels. The trader as a whole should decide on the overall risk that he is ready to bear. For example, it is 3% -5%. Therefore, it is necessary to calculate the following positions in such a way that, taking into account the profit of the previous steps, compensate for the loss of the subsequent ones and keep within 3% -5%.
You need to understand that with the correct determination of the trend, and the correct scaling of the pyramid, a loss of 3-5% is purely arbitrary, as long as you have a stop knocked out, you can already double or triple the total profit. The main thing with the price increase is not to forget to tighten the stop loss. And so put so that they are not knocked ahead of time. As a rule, I go out when stop loss is touched, just two, as the first one can knock out, and the price can go up further.
It is also worth adding that sometimes on some coins due to their volatility , their feet are knocked out by 5%, so that this does not happen, the size of the stop is not so important as the moment of entry.
________________________________________________
Profit taking.
How to take profit when managing money using the pyramid method? There are several different methods of closing positions:
1) According to the planned profit. For example, you planned to take profit + 100% from this tool. You have reached your take profit. We left the position, took profit and forgot about this tool.
2) With a slowdown in profit growth. For example, you have already doubled the profit on this trend and this is quite enough for you. The trend has moved in a lateral movement, profit is not growing, or growing slowly. It is more advisable for you to close this profitable deal and transfer the profit to the trend that is emerging, thereby building a new "pyramid" on a more rapidly growing trend.
3) At the first sign of a trend reversal. Not breaking through important resistance levels, reversal patterns, breaking the trend line .
4) By tightening stop loss. Knocked out stop loss. Depending on which stop loss ordering technique you use, either single or fractional for each entry separately. Stopped, took profits and forgot about this trading tool. They began to search for a new instrument with a good entry point at the stage of trend emergence. Started the construction of a new "pyramid".
In my opinion, a reasonable solution is to partially take profit at some maximum levels with the trend growing. I am also part of the position about 30% aggressively trading increasing the asset. An important point at local maximums I sell these 30% almost completely, I already shop a large amount of assets from the support if I trade in an uptrend. As the trend progresses, I constantly pull up the lower stop loss (main position). 70% of the position is exited when the trend unfolds completely.
_______________________________
Benefits of money management by pyramiding or scaling.
Pyramiding works well with strong steady trend movements.
The advantages of pyramiding:
1) the bistro is increasing the deposit.
2) minimal risks, and with the development of a trend, there are no risks.
3) psychologically comfortable trading due to the absence of great risks.
_____________________________________________________________
Disadvantages of money management by pyramiding or scaling.
As you already understood, pyramiding works well in the trending market. If the market turns into a flat or a trend movement is accompanied by deep pullbacks, then the pyramid can be destroyed very quickly. On few liquid, weak instruments, this method does not work! On cryptocurrencies, this method only works on TOP. Coins such as BTC , LTC, ETH.
This method does not work:
1) In lateral flat movement.
2) With a weak trend.
3) In a trend with deep pullbacks, in which there will be uncertainty about further movement and they will knock out stops.
_______________________________________________________________
We all heard the well-known trade axiom: reduce your losses, and give the opportunity for profit to grow. This is the aspect of money management in your trading system that issues major winners. Money management throws aside the subjective sensations present in people.
Richard Dennis

BATTLE OF THE SUPERTRENDS. And The Winner Is...BATTLE OF THE SUPERTRENDS
Here is an interesting comparison of many of the Top "Supertrend Strategies" that are published here on Tradingview (Including my own: "SUPER SMART ST") . Please note that all test shown here were done using Heikin Ashi candles, which seem to improve Supertrends functionality ...
15 MINUTE (BTC/USD) COMPARISONS
ONE HOUR (BTC/USD) COMPARISONS
FOUR HOUR (BTC/USD) COMPARISONS
Recently I released several SUPERTREND based indicators, studies and strategies. In fact, I created an entire " Trading Toolkit " that incorporates Supertrend along with many other built-in Indicators, Oscillators and Technical Analysis Tools.
--- SCROLL TO BOTTOM HERE FOR LINKS TO THEM ALL ---
I decided to compare my "Super Smart" SuperTrend with the SuperTrend strategies others had published. As you can see in screenshots above, the results were very interesting. What follows is a summary of my experiences and journey surrounding this super topic.
IT STARTED WITH BACKTESTING
After a lot of thought and "playing around" with SuperTrend over the past few months, I was compelled to perform hundreds of backtests across many cryptocurrencies and all the common timeframes. I was seeking to improve upon SuperTrend (if I could) without degrading any of it's many inherent qualities.
But before I jump into my personal journey toward a "Smart" Supertrend, let me share a few thoughts with those of you who are new to Supertrend...
WHAT IS SUPERTREND?
As the name suggests (and as many of you likely already know) , 'Supertrend' is a trend-following indicator that is notably popular.
WHY?
Well, it does a remarkably great job of recognizing a trend (once in progress) and signaling you to when to jump into a trade after the trend is clear. However, many traders feel the greater value of Supertrend is that it helps KEEP YOU IN your position until that trend is over by ignoring minor dips and retracements along the way. Yes, supertrend has it's short comings (detailed later) , but boy... when it's right, it can be very profitable.
IT SOUNDS SO EASY
When you look at any Supertrend chart (in history) it looks so impressive. You begin to fantasize about gains and profits. After all, Supertrend maps out many impressive price movements. It just seems so easy, right? But you soon realize that "trusting" what Supertrend is telling you is hard... "BUY, BUY, BUY... this is a friggin' trend." But you doubt yourself and what Supertrend is telling you and you hesitate. Been there?
Then you finally get in and Supertrend starts yelling... "STAY IN, STAY IN, STAY IN"... but you're up a percentage point (or two) already and you don't want to lose your profit. You exit. Usually way too soon. You're super happy until you see Supertrend continuing to track along with a monster trend. You missed out! Bummer.
SECRETS OF SUPERTREND
You have to remember a couple of secrets to get Supertrend to work the way you've fantasized:
1) Trust it, get in when it signals and stay in until it signals you to exit.
2) Accept the fact that Supertrend does not work well in sideways markets, so if you detect that this is what is forthcoming in the market... lay back, go do some GRID TRADING or have a beer. Wait for a trending market (unfortunately this is usually less than 30% of the time).
3) Should you enter on a Supertrend signal and discover after-the-fact you are in a flat or sideways market, exit as soon as this is clear or at the latest, when Supertrend signals an exit. Yes, you might have a loss. But don't assume Supertrend didn't work, it did work but the market did not have a trend worth following, so you'll have to enter again on the next signal. For every big Supertrend trade you nail, you'll have to wade through perhaps 6 or 7 not so great trades.
4) To improve your odds, try combining Supertrend with other indicators. Often it's a combination of things that gives you your optimal ins and outs.
Speaking of combinations...
STONEHENGE SUPERTREND PLUS (Toolkit)
It was "Secret #4" (above) that lead me to create the " Stonehenge Supertrend Plus Toolkit. "
This features THREE Supertrends:
A CURRENT timeframe Supertrend,
A HIGHER timeframe Supertrend and
My exclusive SUPER SMART Auto-Adjusting Supertrend.
In addition, it is closely integrated with dozens of other indicators and data points.
BUT WHY THE FUNNY MEGALITHIC NAME?
Well, it looks like Stonehenge! Check it out... it displays an array of stones arranged in a manner that does a pretty good job of predicting the future. Learn to read these stones and you can sometimes predict the future!
And best of all, these Stonehenge "predictive stones" not only incorporate Supertrend data but they also enhance Supertrend as you consider entry and exit points along the way.
LET ME CLARIFY
1) There is Supertrend (the standard indicator)
2) There is SUPER SMART SUPERTREND (a version I optimized)
3) Then there is STONEHENGE (a multi-indicator toolset that incorporates Supertrend and Super Smart Supertrend)
LET ME CLARIFY FURTHER
My indicators here have TWO parts that work together:
1) An overlay that appears on the chart with your candles.
2) A separate stand-along indicator that presents data as an array of colored "stones" which help predict future price movement.
AND YET FURTHER CLARIFICATION
1) I have both free and paid versions of everything.
2) I have both Strategy and Study versions of everything.
3) Strategy versions allow BACKTESTING, while Study versions have ALARMS.
IT MIGHT SOUND COMPLICATED, BUT...
If you're confused, just install a free version ( part 1 and part 2 ) and explore this for a few days. If you like what you see, you might consider the more advanced STONEHENGE TOOLKIT . That's all there is to it!
Now back to our regularly scheduled programming!!!
WHAT'S SO SMART ABOUT SUPER SMART SUPERTREND?
As I built the Stonehenge Toolkit, I kept noticing that the Supertrend part had a very annoying downside: Entry signals lagged and Exit signals came late. If those two things could be improved, Supertrend would be really "Super."
After much trial and error and even more backtesting I developed a solution that achieved my goals without OVER modifying Supertrends' inherent qualities. In a nutshell, I made Supertrend smarter!
MANY PEOPLE ASK...
What's the best ATR period and multiplier setting for Supertrend? After all, there are typically only two important data points we must enter for Supertrend to work, namely the 'period (ATR number of candles or days)' and the 'multiplier (value by which ATR is multiplied).' BTW, in case you don't know, ATR signals the degree of price volatility. A common default setting is 10 for the ATR period and 3 for the multiplier.
While this is good to know, Super Smart Supertrend already has well tested default settings built-in, so you can install it and use it right away, without adjusting settings in the beginning. Just plug and play.
HOW IT WORKS
So here's what I did. Using data from other indicators I came up with a SMART SUPERTREND that auto-adjusts as the market changes. It still has settings so you can fine tune for specific assets and timeframes (if you like) , but once the settings are entered, it auto-adjusts as the market and prices evolve.
With "Super Smart SuperTrend" there is no ATR period setting (ATR is determined programmatically) and now there are TWO multipliers you can experiment with... (a lower one set at 1.7 default and a higher one at 2.5). These multiplier settings create a multiplier range that can be used programmatically to adjust the multiplier automatically as the market and prices evolve.
BTW, there is also a separate STANDARD Supertrend that you can run parallel or turn on/off to compare things if you like.
THE RESULTS
Across all time frames and assets I've tested, I generally get better results with my "Smart" version. Better entries, better exits and well defined trends. However, when compared with a STANDARD Supertrend, "Super Smart" is not radically different, but when it does differ it is almost always better. All this is substantiated by backtesting of course.
BATTLE OF THE SUPERTRENDS
How good is SUPER SMART SUPERTREND? You can decide for yourself. I ran backtests on 8 Supertrend strategies I found here at Tradingview (sample results posted above). I set my charts to use Heikin Ashi candles as these seem to improve Supertrend in general. These comparisons were the best 8 I could find and I commend each author/coder for their fine work. I was not trying to out-do any one, I just wanted to improve my trading results. I'm also rather sure some other strategy will eventually out perform Super Smart Supertrend. And if they do, great! I believe in making more money, not making more indicators!
I tested all of the scripts found here:
www.tradingview.com
I used the timeframes of 15 minutes, 1 hour and 4 hours (as published above) . And I used the default settings built-in to each script strategy and again, with Heikin Ashi candles. I fully understand that you can tweak the settings on any Supertrend strategy and get different results.
I hope you have as much fun with this "BATTLE OF THE SUPERTRENDS" as I had creating it. But at the end of the day, I hope you install and try one of my indicators in the very near future and try the Supertrend indicators by these other authors (linked above).
#########################################
MY SUPERTREND BASED INDICATORS
#########################################
The free versions are extremely powerful and will serve you well, they will also give you a preview of the even more powerful "STONEHENGE SUPERTREND PLUS TRADING TOOLKIT." I recommend you use both Stonehenge AND a Companion overlay.
###################################################
STONEHENGE SUPERTREND PLUS TOOLSET (paid versions)
###################################################
DH: (Strategy) Stonehenge SuperTrend Plus Toolkit / Stones
DH: (Companion) Stonehenge SuperTrend Plus Toolkit / Overlay
#########################################
STONEHENGE BASIC TOOLSET (free versions)
#########################################
STONEHENGE SUPERTREND BASIC (Double Stone Indicator Version)
(You may use either of the SUPERTREND overlays below as a companion with this "double stone" indicator)
DH: (Study) Basic Stonehenge SuperTrend - Double Stone Version
SUPER SMART SUPERTREND (Overlay Companion Indicators)
DH: (Study) Super Smart SuperTrend: Self Adjusting
DH: (Strategy) Super SmartSuper Trend: Backtest Version
#########################################
That's it. Get "SMART" Today!
PLEASE HIT THE LIKE BUTTON (and follow me... lots of other SMART STUFF in the works!)
As always, I appreciate your support. Please share with others.
ENJOY!
Dan Hollings
Master Crypto Grid Trader
Stonehenge Master Mason
Host of the "High Leverage Lounge"
Please Explore My Other Indicators, Scripts, Grids and Educational Ideas.
@DanHollings on Tradingview.
Additional Links Below...

Educational charting analysis 3 touches is strong confirmation for a trade position. Looking at this text book example shows how easy it can be to identify what direction the market is going.

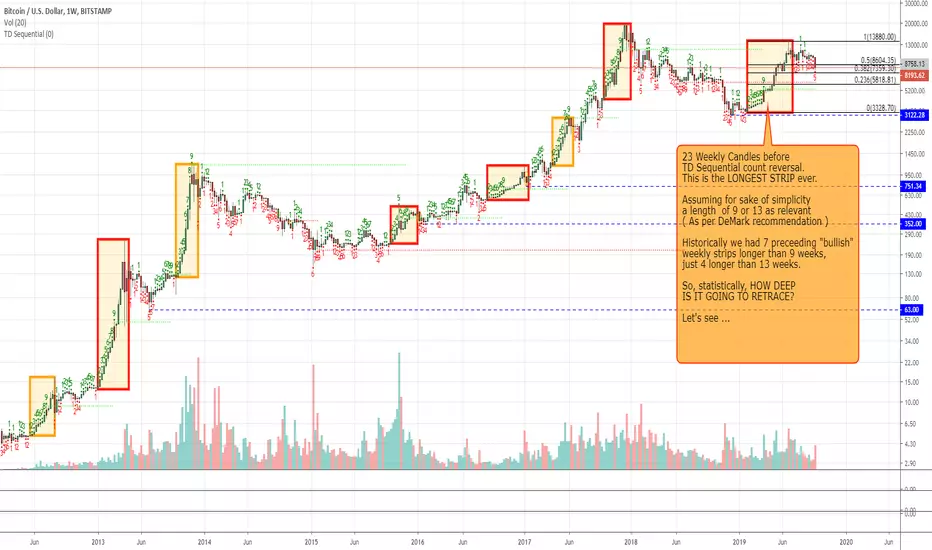
Playground: probabilistic estimation of depth of the retraceI think many among you already know about Tom DeMark "TD Sequential" method.
Here i'm applying that in some pretty unorthodox way, because i find it fascinating.
Let's find the longest weekly sequential strips, as the longest one ever came just into spring 2019.
Let's check what happened AFTER their blow, let's see how deep they retraced.
Let's collect some statistical data we can use for some (pretty basic) trend speculation.
Historically we had just 7 TD sequential strips lasting more than 9 weeks, only 4 lasting more than 13.
The longest strip EVER ( 23 weeks ) just ended in July.
So what can we presume now, given the past examples of long strips retrace ?
Considering just basic FIBs (0.5, 0.382, 0.236), history told there was a straight 100% probability to hit at least 8600$ (FIB 0.5 calculated on the whole strip).
Infact all the 7 previous strips retraced AT VERY LEAST to their own FIB 0.5.
Recent price action confirmed this was true also for the latest strip, so let's move on.
Now there's still a 57% probability to have some weekly close under 7350$ (FIB 0.382), but also a 72% chance as well that price WON'T close a week anymore under 5800$ (FIB 0.236).
This is pretty interesting, given price got down to 7700$ already.
Speaking of wicks ( or intra-week lows ) there's still a 85% probability to see some wick under 7350$, 57% for under 5800$ lows.
That's some pretty high chance of a deep failed low, maybe with a swift recovery on weekly close.
However if we consider only the longest strips ( red squares, longer than 13 weeks ), the probability of a dip under 7350$ is just 50%.
25% chance for some sub 5800$ low.
So after all a dip, if that's the case, may be less severe.
If so all the 7 thousands range would be a pretty good accumulation zone.
---
That's what this pretty small set of data data tells.
So dig into past and look for advices, do your own diligence.
Obviously Future != past , but often it makes a rhyme ...
Have a nice weekend.
** THIS AN EDUCATIONAL AND SIMPLIFIED POST, NOT A TRADING ADVICE ***
Using Time Fibonacci to predict the next MARKET CRASHUsing TIME FIBONACCI to connect the crash of 1877 and the crash of 1973 we get an accurate prediction on the 1.382 Fibonacci level for the bottom of the DOT COM bubble market crash in 2003 and a warning sign signaling to January 2021 being a significant date, either the beginning of the crash or the end of the crash and an entry point for investors.
For free education visit www.TopTradingSignals.us

Technical Trading Option 1: Trend FollowingHello friends,
Someone said that they felt that bitcoin wasn't in an uptrend. I said that clearly it is in an uptrend as an uptrend is measurable (kind of the main point) and the measurements are bullish. I'd like to take a second to talk about why objectively (by common metrics) bitcoin is OBJECTIVELY in an uptrend.
For starters, Bitcoin is up over 200% this year and has had a max drawdown of something like 30% in all that time. It has been more probable for bitcoin to consolidate and then explode up than to drop after parabolic moves (!). This alone is a pretty good piece of evidence that we are in an uptrend, but it's not an exact measurement.
Let me share with you a pretty well documented technical sign that you are in a bull trend: if a moving average is faster than another one that implies the faster ma is above the ma. As you can see, in the chart, the 50 is higher than the 100 which is higher than the 200. This is bullish technical posture and is a pretty simple measurement of trend.
Now, I am on the daily chart and generally don't care about any timeframe lower (am starting too in developing quantitative infrastructure but that's not how I cut my teeth) than it. The weekly and monthly are vital as well for determining trend and they will agree with what I am saying is true for the daily price data as well. That is also a good indication you are in a strong trend: the lower timeframes align. If the timeframes align, the trend is wherever the price is generally moving. It's that simple.
The sar is also a good measurement of trend, but it changes often even in uptrends so you don't want to define a trend based on it. That said it can be pretty useful in measuring how serious moves against the trend are.
My point in making this post is that as a technical trader, there are really two main options for your trading strategy (you could do orderbook analysis, stat arb and others but that's besides the point) they are: 1) trend following 2) mean reversion. I use elements of both in different situations, but by and large, I follow trends. If you look at my early work, which made a lot of money for me and was very high alpha (see for yourself) I was betting on the bear trend every time and called many of the bear market local tops. I did this by a mix of mean reversion and trend following, but the confidence was far more in the trend than the mean reversion.
How are you going to trade? How are you going to measure a trend? Only by systematically approaching trading will you have a chance to make money. And for what it's worth, bitcoin is a very nascent inefficient market. What does that mean? It means your competition is much less than that of other major markets. This is an advantage. There are disadvantages to this as well, but by and large you are competing with other traders and less competition is good for your pnl. In smaller markets, you have a better chance of being a big fish (a whale if you like).
The question is: how are you going eat the other fish?
YoungShkreli

Algorithm Builder : Please ask me if you're stuckHi everyone
A quick post to share a story that happened less than 20 min ago.
I received feedback that a follower didn't want to buy the Algorithm Builder because he "tried it and it doesn't work on the Indian market"
11 minutes later (see screenshot below), using the exact same Strategy Builder along with the Backtest (that I'll introduce tomorrow), I made him a strategy with a stunning 63% win-rate, 3 Profit factor - on a period of 10 days, ending today
Our chat imgur.com
Performance of the algorithm across the last 10 days on a market not very volatile: imgur.com
I'm not writing this for trolling, I don't care at all and I surely have better use of my time
I just want to convey a message that if you don't know/understand how to use my Algorithm Builder, please ask me. I won't bite and I'll even advice configs
People are asking me every what I do use for trading and if I use the scripts I share... short answer: YES and the main pinnacle of my trading is the Algorithm Builder.
I make every day for my clients any algorithm on any market, any timeframe in less than 15 minutes. Now some of my clients got even better than me at designing signals with the tools.... (I'm a bit pissed about that, to be honest, but so happy they're learning)
You'll be able as well with a bit of practice, it's honestly not hard. Even my sister is doing it and she doesn't even know what the indicators inside mean...
I'm here to help so shoot me your questions/concerns/feedback.
I can't guarantee your success on the financial markets because psychology plays still a huge part but I did this in 11 minutes guys and you already have the tool available for a free week trial
This is a generic script to detect the confluence/convergence between unrelated indicators
Algorithm Builder
More on that tomorrow to come, my friends.
Dave

USDCAD 240 min Short. CCI lessons on end of continuationThe apex of triangle on CCI is below zero, favoring down. The move continues down from the previous CCI short signals. Because there is now a CCI divergence, two new things may be on the horizon.
1) at some time, the price is likely to be revisited where it was when the CCI low prior to the divergence occurred.
2) normally a CCI divergence occurs before trend can change direction. CCI now has a diver, but before the price turns up, usually price needs to retest the low or drop lower. The only exception to this is if CCI spurts north so fast that it crosses up thru the zeroline before pulling down a bit
Direction change to Long requires what is described in 2) above, and requires a CCI crossing up thru a down-trendline and moving above -100.

How To : "Trend Volatility"The back testing was done with 240 days of data using the following settings (if you find better settings let me know)
BTC = 5 5 25 settings
ETH = 3 5 25 settings
You can choose in between using the filter or not and also set alerts according with/without the filter.

KEY LEVEL down trend pending order case Four factors must be considered in any transaction
1, trend
2, key level (structure)
3, signal
4, fund management
FX:GBPJPY

[Reading notes] : chapter 13 how & when to sell shortHello, everyone
This is a threads of my reading notes for the great book: [ Technical analysis using multiple timeframes ]
And here is the notes of chapter 13, how & when to sell short
I will go through all of key points of this book, and find proof from the bitcoin chart.
Why to selling short?
from the book : bear markets occur every 39 months on average and typically last for about 18 months. that is a lot of time where the odds are stacked against long trades and where selling short makes sense to generate market profits for the purpose of current income.
And let's have a look at the bitcoin market for the bear market times:
02.Dec 2013 ~ 24.Aug 2015 last 21 months.
18.Dec 2017 ~ 28.Jan 2019 last 14 months.
In the long time of bear market, shorting is a good tools to catch great profit.
Measures of sell short
By selling short, the trader expects to profit by repurchasing the shares at a lower level and profiting from the difference.
And cutting losses must be taken very seriously when selling short since the unlimited losses.
Shorting takes the right mindset
Selling short is a skill that every serious trader learns to utilize during stage 4 market declines.
The best time for sell short is during a bear market, but there are always stocks in a stage 4 decline that can be sold short regardless of the overall market environment.
What is a bear market?
The most obvious sign of market bearishness is when the majority of stocks are in established downtrends or when the overall market indices are below key moving averages. the best way to define a bear market is an environment in which markets where the 200-day MA is declining.
Let's look at the chart pattern of bitcoin in bear market 2014 and 2018 with 200 day MA.
From the chart above, we can see in the bull run, bitcoin will not touch the 200 day MA, if bitcoin drop below the 200day MA, then it's high possibility we enter the bear market, and 200 day MA will become a major resistance line of bitcoin.
But is it the best indicator of bear market? how can we measure we are near the peak of ATH? find the bear market indication in in early stage is very profitable and very risky also
another clue is the price of stock/bitcoin drop below the long term support line. such as in 2017 bull run, the 20 week MA is the most important support line for bitcoin, but it drops below the 20 week MA on 29.Jan 2018. This may indicate the bear market is coming!
And I found another indication is the bitcoin is not correction in healthy range (20 week MA) and resume to advance again, this means the final ATH will be very soon.
Sentiment of bear market
In the bull market, everyone is very confident, but in bear market, stock tend to drop much quicker than they advance and it has a great deal to do with emotion. bear market are characterized by a stronger emotion response than bull markets because people are complacent when they are winning and become frightened when they are losing. fear is a much stronger motivator than complacency, and emotional liquidation from frustrated long holders can lead to quick declines.
Choosing shorts
Timing need to be more accurate when it comes to shorts, in bear environment, try to concentrate only on the highest probability setups, and keep overall trading activity low relative to your trading volume in a bull market. you need to have the patience to let the market present you with the lowest-risk opportunities. This occurs when the trend are aligned on multiple timeframes .
Some of sharpest rallies experienced by stocks occur during a downtrends, and while these rallies usually fail to hold up in a down trending stock.
Trend trading is the safer way to consistent profitability, so do not allow yourself to be enticed by the rapid movement.
Short alignment
Trend alignment of short trading positions is the lowest-risk, highest-profit potential trade scenario. Whether we trade long or short, the basic cyclical structure of the market never changes.
Find the candidate with daily timeframe
The first step in trading short is to find a stock in an established stage 4 downtrend. when trading from the short side, we ideally want the overall market, the sector and the stock to be in a decline.
In digital currency market, we hope the bitcoin is in decline when shoring the alt coins.
And if the daily MA 10-, 20-, 50- stacked below each other 10<20<50 is another bonus for shorting. let apply these rules.
Shorting choose in bear market
07. Feb 2014, lower high formed in Jan 11, and consolidate in the neck line range ~ 790, but after 1 month, the market choose downside direction, when 07.Feb 2014, we can see obvious MA stacked 10<20<50, it's a sign of bear formed, good point to start short.
13.Aug 2014, lower high formed in 01.July 2014, and break the neck line in 14.Aug 2014, with daily MA 10<20<50 stacking, good point to shorting.
05.Mar 2018, daily double top seems formed, this chart pattern in bear market have strong power to drive the price down. we can setup shoring with stop loss in here.
05.May 2018, daily double top formed, we can shorting with stop loss from here:
29.July 2018, bitcoin price formed lower high in daily chart. shorting!
14.Nov 2018, bitcoin break the major support which support bitcoin ~ 1 year. the longer the hold, if breaks, the large dump will happen. shorting without reasons!
Shorting in bull market
I have to say shorting in bull market is very risky, bulls driven by FOMO of crowd. Don't short in bull market otherwise you're very experienced in trading. And one rule we should always keep in mind is we should ride the trends, not try to violate or control it.
So in bull market, just find the right position to long, don't try to stand on the oppose/low possibility position.

AUDNZD, buy and buy in dip.
Follow and LIKE if my work is useful for others.
Buy at value low with excess and tail is perfection. Everything is mentioned in the chart.
This chart showing you fair value working for a long time.

BITCOIN: Question of the month - does it have any value?People certainly think that Bitcoin has value! How do I know? Because there is incontrovertible evidence that in recent days people have gone greedy for it. However there is expert opinion (which shall remain nameless) that Bitcoin is NOTHING and has no value at all. I'm really amused by this opinion because it flies in the face of evidence.
The chart shown in this screencast is the evidence of BTCUSD running a very hot RSI again! Billions have been spent buying this thing that is called 'nothing' by the good and great.
Arguments for Bitcoin being ' nothing ' is that it is ' thin air '. Oops that must mean that when I transfer fiat money wirelessly I'm transferring 'nothing' too - cuz I certainly do not transfer metal or paper money when I use my credit or debit card.
A few months ago I even showed that it is now possible to transfer solid Gold electronically - which now makes Gold to be 'thin air' - if this so-called expert out there (nobody on Tradingview) is correct.
What many a guru out there fails to understand is that the value of anything is what people are willing to attach to it. But some people then argue that a) BTC is nothing and b) it has no intrinsic value . Of course most of the people who chunter about 'intrinsic value' cannot define what they mean. All value is represented by how much people are willing to exchange for some 'thing'. The 'thing' certainly does not need to be physically tangible in the hand. Why? How? Because most (fiat) money in the world is not held in the hands - these days.
A measure of value is also how much effort, labour or service one may be willing to exchange to acquire 'the thing'. There was a time when money did not exist. That did not mean that nothing on earth had value! Way back then, value in physical form may have been represented in food items e.g. sacks of potatoes, livestock, water etc. So - if you lived back in that time, you might be willing to exchange so many hours of work for potatoes. You might then trade your potatoes for something else you wanted to acquire from somebody else.
Even stocks/shares are 'thin air'. The piece of paper stating your ownership is only proof of promise and a record. To trade the stock you gotta do that via a broker etc - and that activity is electronic, in the vast majority of cases.
'Value' and some 'things' exist only in the mind. BTC is the result of a mathematical equation and its value exists as 'thin air' in the minds of people - as does all value.
Today Bitcoin is a vehicle of value for something. It doesn't matter if it is made out of thin air.

CAN A MA HELP YOU TO DETERMINE IF PRICE CONTINUES OR REVERSESWill Price Continue or Reverse
Possible Expectation of Price and a Moving Average
If less than 30 bars since price has been on the opposite
side of MA - expect range behavior not continuation
If more than 30 bars expect price to continue in 1 direction

TRADING PULLBACKS WITH KELTNER CHANNELTrading Pullbacks with Keltner Channel
Trading pullbacks successfully can only be done in the presence of a strong trend. Using the Keltner channel indicator we can study how the price behaves around the upper and lower envelopes to gauge the strength of the trend.
As you already learned when the price hugs one of the two bands and crawls along the band, we have a case for a strong trending market.
In the chart below we’ve highlighted small retracements while the price hugs the upper Keltner band. Notice that the price retrace to the area around the 20-EMA. It won’t give you an exact price, but a price zone from where the price can potentially bounce and the bullish trend can resume.
This remains a good way to measure pullbacks in price. Successful trading doesn’t require catching the exact turning point.
For a better timing of our trades we can use the Stochastic RSI indicator in combination with the Keltner indicator for more confluence.
The trade trigger is simply to follow with this Keltner Channel pullback strategy. Pull the trigger when the price retraces to the middle band and the stochastic indicator develops a crossover from an oversold territory.

in April we will know what is The Bitcoin Next Year TrendHey guys
for a long time nearly 400 days Bitcoin couldnt break the Resistance shown in the chart
every time it hits it it fall more and more
from 22 Mar to 26 of Apr we will see some important moves in bitcoin that will decide the bitcoin trend in the next 9 month
Dont be so happy from the recent Alt coin moves and be aware of Bitcoin
as we all know any analytics will be failed by bitcoin hard moves so at the times that i told you its better to be full tether so you prevent any losses
wish you best life and more profitable trades.

EURJPY ideaThis one is kinda of a new one for me.
The levels are not like always, but have been having some trouble with jpy pairs, so here is to something new.
-On the daily, the price has bounced from the 61% fib lvl, leaving us a higher target
-The price has been uptrending this days
-Bounced from a monthly level
-emas crosed bullish
I think, that the price might rebound from the next resistance, but if we break it, i think there is a break and retest and posible entry there to get at least to the next resistance.
IF the next resistance gets broken i think the same might occur, but if not, i think it might range a bit, but we'll see depending on the price action.

The Looney: value in higher time frame trendsMacroeconomic trends are represented in higher time frame charts. The trend and price analyses held secret opportunities for traders in lower time frames. I explain how I assessed the probabilities in my own unique methodology.

Free money - but not easy money!This educational post shows how exploiting trends can deliver profits in the long term, by living for the big trends. This is a no-targets system that uses the ATR. Trend switches define entry positions and the markets decide exit positions. Scaling-in of position sizes is an advanced higher risk technique. Those lacking experience and with small account sizes should stay far from it.
Trading is not easy. If it was then everybody would be doing it and making millions. About 80 to 90% of all traders consistently lose money. Shocking but true.
Even in showing a purely mathematical system, there are unseen limitations in the backdrop. What's that? The key defining limitation is 'YOU' and your individual psychology. Risk - or the sense of risk - how 'you' manage that, is mostly about psychology.
Even when mathematical reality becomes unarguable, there is still the psychological issue about 'being convinced'. Not everybody is convinced by what is exquisitely mathematical.
Please note that I've only used a 60 min time frame on one chart for illustrative purposes. This is not a tutorial. The skill involved in anticipating where trend switches are more likely to occur is not something I can teach or intend to teach (even for a fee). I do not accept fees and never make any offers of deals to anybody - that's my 'mathematical constant'.

YOU HAVE BEEN FED A FALSE SENSE OF CONTROL (MUST WATCH!)Your sole purpose is to provide liquidity to the market makers. Learn how to play their game or get slaughtered like sheep in the gears of their war machine.

WHAT IS YOUR DEFINITION WHAT MAKES A TRENDThis defines a trend in such in clear terms that it applies to any time frame, any symbol, any market, any time of day.
Here are some definitions I have heard what is a trend
A trend demonstrates higher highs, or lower lows. Really? how many bars of "higher highs" or "lower lows" are required to define a trend?
The trend is your friend until it ends," because most people don't even know when it started! Let alone when it's about to end, or reverse and run up a margin call.
What do you use to determine "The Trend?"
