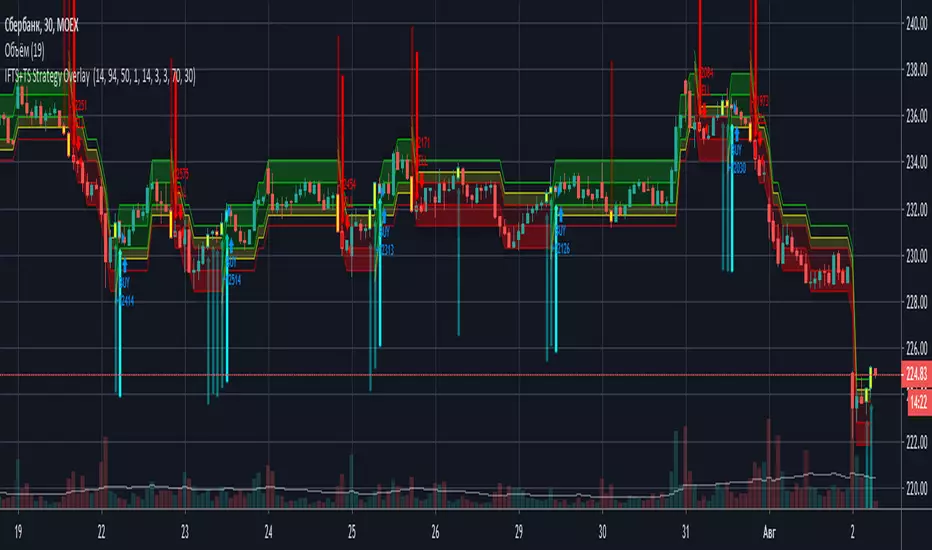
IFTS+TS Strategy OverlayInverse Fisher transform on stochastic with Hull MA and Donchian Channels with oversell/overbuy levels and dynamic trailing stop
Options:
Fixed trailing stop
Dynamic, based on ATR trailing stop
Re-enter after trailing stop
Includes Hull MA
Hull MA filtration for re-entering after trailing stop
Donchian channels, with overbuy/oversell levels
No repaints
Centered Oscillators

Combo Strategy 123 Reversal & CCI This is combo strategies for get a cumulative signal.
First strategy
This System was created from the Book "How I Tripled My Money In The
Futures Market" by Ulf Jensen, Page 183. This is reverse type of strategies.
The strategy buys at market, if close price is higher than the previous close
during 2 days and the meaning of 9-days Stochastic Slow Oscillator is lower than 50.
The strategy sells at market, if close price is lower than the previous close price
during 2 days and the meaning of 9-days Stochastic Fast Oscillator is higher than 50.
Second strategy
The Commodity Channel Index (CCI) is best used with markets that display cyclical or
seasonal characteristics, and is formulated to detect the beginning and ending of these
cycles by incorporating a moving average together with a divisor that reflects both possible
and actual trading ranges. The final index measures the deviation from normal, which indicates
major changes in market trend.
To put it simply, the Commodity Channel Index (CCI) value shows how the instrument is trading
relative to its mean (average) price. When the CCI value is high, it means that the prices are
high compared to the average price; when the CCI value is down, it means that the prices are low
compared to the average price. The CCI value usually does not fall outside the -300 to 300 range
and, in fact, is usually in the -100 to 100 range.
WARNING:
- For purpose educate only
- This script to change bars colors.

IFT Stochastic + Trailing StopInverse fisher transform on stochastic strategy with trailing stop. Good work on flats with mid-wave length

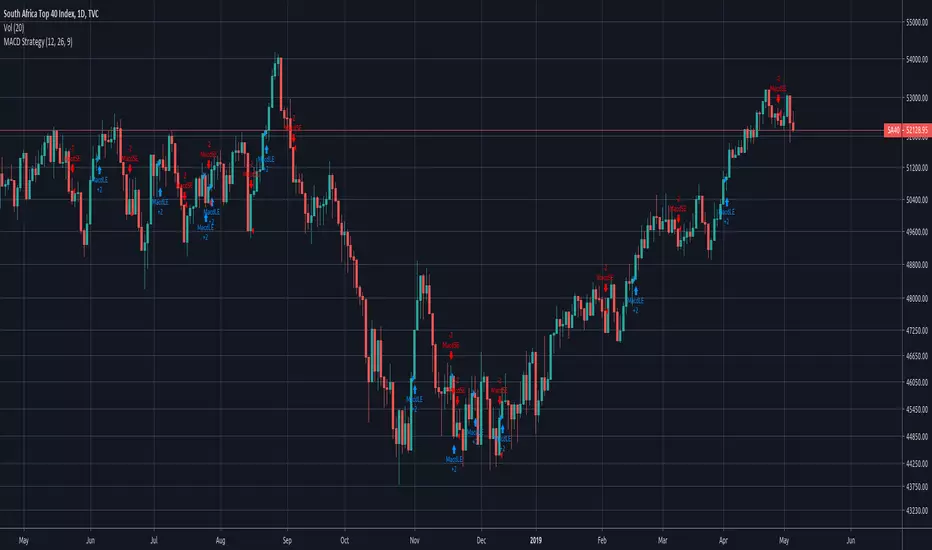
MACD Strategy by ForbesStrategy นี้เขียนขึ้นมาจากบทความของนิตยสารธุรกิจ ชื่อดัง Forbes
สำหรับผู้ที่อยากอ่านสามารถค้นหาได้โดยใช้คำค้นว่า Bitcoin Trading Strategy For Passive Investors
สำหรับผู้ทีจะทอสอบ backtest ให้ตั้งค่า commission (หรือค่าธรรมเนียมการเทรดด้วย) เพื่อให้ผลลัพท์ใกล้เคียงกับความเป็นจริงมากที่สุด
อย่างไรก็ตามจากการ backtest นั้น พบว่า Strategy นี้เหมาะกับ Timeframe Day มากที่สุด และโดยส่วนตัวคิดว่าเหมาะสำหรับการซื้อขายแบบ Spot เท่านั้น


MACD Strategy With HistogramCombines MACD strategy for backtesting with a plotted histogram and orders

MACD Strategy with HistogramThis combines a strategy for backtesting with a plotted MACD graph and orders


Simple MACD Strategy - CrossoverSimple MACD Crossover Strategy
No secret sauce here!
Script was requested by user
MACD BFThis is a modified version of the MACD strategy in the public library. You can set the time period you want in the input parameters, along with the MACD and signal line values.
The default values for this strategy are 12, 26, 12. These settings seem favorable to BTC/USD pairs.
The strategy is simple - when the histogram crosses above zero, a buy signal is generated, when it crosses below zero, a sell signal is generated.
If an opposing signal is generated, we exit the current trade and enter the new one.
You can set a stop-loss as a percentage in the input parameters - for example, if you enter 5, the strategy will exit when the trade goes the wrong way by 5%.
The default money management strategy is to trade 100% of the equity. This can be changed in input settings like it can with any strategy.


Smeared VCI BacktestThis is the strategy with backtest date range and trailing-stop / stop-loss for vitelot's Smeared VCI indicator:

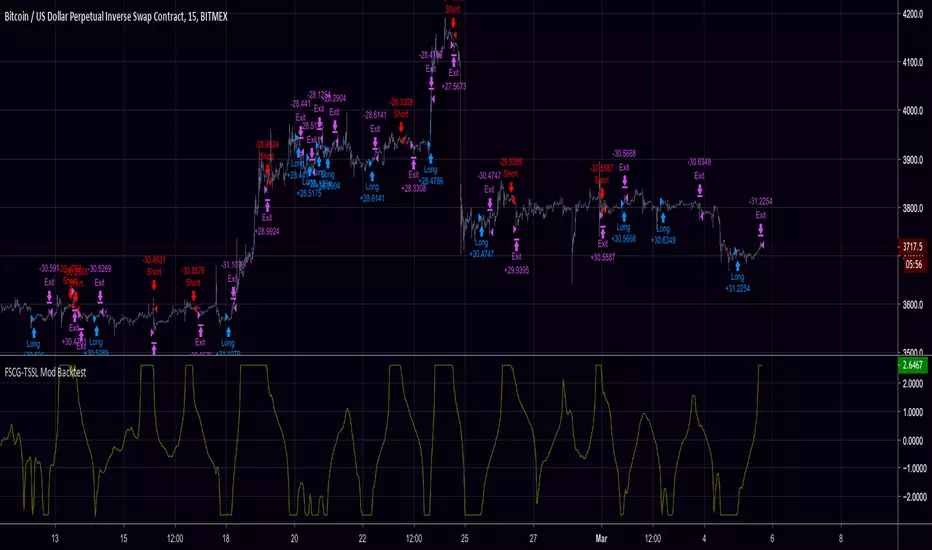
FSCG-TSSLA modification of dasanc's "Fisher Stochastic Center of Gravity"
Added:
- Thresholds for Buy/Sell Signals
- Trailing Stop / Stop Loss
- Backtest Range
Support the open-source community.
Screw you people selling open-source scripts to newbies.
Tip Jar: 3KNZq8mE24MuBmpDJVF31bBy8zc9beDiZo
Contact me for collaborations and let's take things to the next level!
Do NOT contact me for alert scripts or paid-custom work, I don't work for clients.

GBPJPY MACD 1min Long OnlyThis MACD indicator uses two lines for long and sell long. It also uses a MACD indicator line with a historian. When the MACD historian crosses over the buy line, a long signal is executed. When the MACD historian crosses over the sell line, a close entry is signal is executed. There is a also a built in stop loss and you can adjust the buy and sell lines accordingly.
This does not repaint and I use it for autoview with an alert to autotrade this strategy.

GBPUSD MACD 1min Long OnlyThis MACD indicator uses two lines for long and sell long. It also uses a MACD indicator line with a historian. When the MACD historian crosses over the buy line, a long signal is executed. When the MACD historian crosses over the sell line, a close entry is signal is executed. There is a also a built in stop loss and you can adjust the buy and sell lines accordingly.
This does not repaint and I use it for autoview with an alert to autotrade this strategy.

EURUSD MACD 1 min Long OnlyThis MACD indicator uses two lines for long and sell long. It also uses a MACD indicator line with a historian. When the MACD historian crosses over the buy line, a long signal is executed. When the MACD historian crosses over the sell line, a close entry is signal is executed. There is a also a built in stop loss and you can adjust the buy and sell lines accordingly.
This does not repaint and I use it for autoview with an alert to autotrade this strategy.

MACD - EURUSD - 1min Long OnlyMACD strategy with a specified level the MACD and signal line must be under. Once the two lines cross under the specified level, a long entry is executed. When the MACD line crosses over the historian, the close entry will be executed. This strategy is designed around the high probability of a reversal in an under-bought trend.

Fisher Transform Multi-Timeframe (Backtest)This is the Backtest Strategy for mortdiggiddy's "Fisher Transform Multi-Timeframe"
For more details check his study:

Volatile Stocks - Simple Strategy w/Profit and StopThis strategy is based off of a script I wrote for another highly volatile asset, cryptocurrencies. It prints BUY and SELL signals based off of inputs that you can specify. I used this script as a time saver. If there is no signal on the chart, I'm less interested in analyzing it.
BUY SIGNALS
Bullish EMA Cross
Positive MACD Cross
Single-candle gains
SELL SIGNALS
Profit %
Stop Loss %
Naturally, I don't trade based off of the BUY and SELL signals alone, but it does help me identify the most important charts to look at.

Simple Alt Coin Strategy - EMA and MACD w/Profit and StopThis script prints BUY and SELL signals based on settings you input. I use it to save time while scrolling through charts deciding what alts I want to look at.
BUY SIGNALS
Positive EMA Crossover
Positive MACD Crossover
Single Candle Gains
SELL SIGNALS
Profit Capture
Stop Loss
I don't trade based just on the BUY or SELL from this strategy, but I have found that these indicators do very well well looking at the large cap alt coins. It backtests well.
Default Settings EMA 5/12/50, MACD 9/12/26, Single Candle Gain 10%, Stop 10%, Profit Capture 45%
