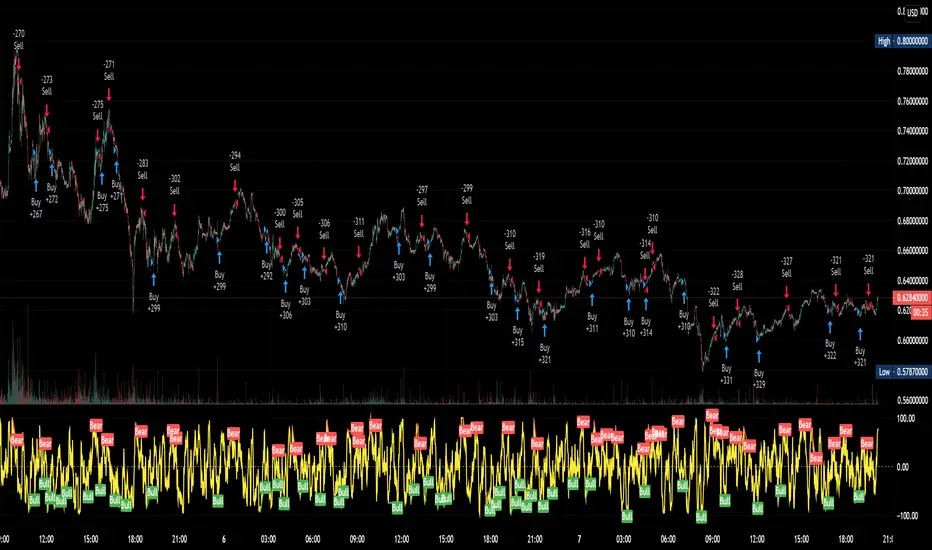
Sentiment OscillatorPrice moves when there are more market takers than there are market makers at a certain price (i.e. price moves up when there are more market buys than limit sells and vice versa). The idea of this indicator is to show the ratio between market takers and market makers in a way that is intuitive to technical analysis methods, and hopefully revealing the overall sentiment of the market in doing so. You can use it in the same way you would other oscillators (histogram crossing zero, divergences, etc). The main difference between this and most volume-weighted indicators is that the price is divided by volume instead of multiplied by it, thus giving you a rough idea of how much "effort" it took to move the price. My hypothesis is that when more volume is needed to move the price, that means bulls and bears are not in agreement of what the "fair price" should be for an asset (e.g. if the candle closes only a bit higher than its open but there's a huge spike in volume, that tells you that a majority of the market are starting to think the price is too high and they've started selling).
Methods of Calculation
1. Price Change Per Volume
The main method this indicator uses to reveal market sentiment is by comparing price change to the volume of trades in a bar.
You will see this calculation plotted in its most basic form by ticking the "Show Bar per Bar Change/Volume" box in the inputs dialog. I personally found that the plots were too noisy and cannot be used in real time reliably due to the fact that there is not much volume at the open of a new bar. I decided to leave in the option to use this method, in case you'd like to experiment with it or get a better grasp of how the indicator works.
2. Exponential Moving Averages
In my quest to smooth out the plotted data, I experimented with exponential moving averages. Applying an EMA on the change per volume data did smooth it out a bit, but still left in a lot of noise. So I worked around it by applying the EMA to the price change first, and then dividing it by the EMA of the volume. The term I use for the result of this calculation is "Market Sentiment" (do let me know if you have a better-fitting term for it ;-)), and I have kept it as an option that you can use in the way you would use other oscillators like CMF, OBV, etc. This option is unticked by default.
3. MACD
I left "Market Sentiment" unchecked as the default option because I thought an easier way to use this indicator would be as a momentum indicator like the MACD . So that's what I turned it into! I applied another EMA on the Market Sentiment, added a slower EMA to subtract from the first, and now we have a MACD line. I added a signal line to subtract from the MACD , and the result is plotted as a histogram... ish . I used area instead of columns for plot style so you don't get confused when comparing with a regular MACD indicator, but you can always change it if an actual histogram is more your taste.
The "histogram" is the main gauge of sentiment change momentum and it is easiest to use, that is why it is the only calculation plotted by default.
Methods of Use
As I have mentioned before, you can use this as you would other oscillators.
-The easiest way to use this indicator is with the Momentum histogram, where crosses over 0 indicate increasing bullish sentiment, and crosses below 0 indicate increasing bearish sentiment. You may also spot occasional divergences with the histogram.
-For the Market Sentiment option, the easiest way to use it is to look for divergences.
-And if you use the "Price Change per Volume of Each Bar", well... I honestly don't know. I guess divergences would be apparent towards the close of a bar, but in realtime, I don't recommend you use this. Maybe if you'd like to study the market movement, looking at historical data and comparing price, volume , and Change per Volume of each bar would come in handy in a pseudo-tape-reading kind of way.
Anyway, that's my explanation of this indicator. The default values were tested on BTC/USDT (Binance) 4h with decent results. You'll have to adjust the parameters for different markets and timeframes.
I have published this as a strategy so you can test out how the indicator performs as you're tweaking the parameters.
I'm aware that the code might not be the cleanest as I have only started learning pine (and code in general) for about a month, so any suggestions to improve the script would be appreciated!
Good luck and happy trading :-)
Centered Oscillators

All in One StrategyTrue improvement over my previous script. This script adds in all of the complementary indicators, makes it truly easy to adjust the inputs, and has produced a real world net gain using the TradingView bots paired with any broker's API that is supported.
It has a selection for which strategy you'd like to use and due to limitations in Pine I cannot program in logic to make sure you only pick one, so you need to make sure you are only picking one.
To tweak the Connors option - it only depends on the RSI length variable, everything else is hard coded and tweaked for Crypto.
To tweak the MACD - play around with the min and max values of the RSI for lookback and the amount of candles to lookback. Then tweak the fast and slow MA lengths. I have found that a fast length of 3 or 4 and a slow length between 6 and 10 will yield the highest gains.
Also, when I was a young Noob I thought using a chart timeframe of 5 minutes was the best...no...no it wasn't. I lost my ass. Don't lose yours. I highly suggest sticking with a 30 minute timeframe, you will minimize losses caused by false triggers, have less trades and higher profits. More is not always better, trades that may sell one day and then buy six days later are normal. Leave it do its magic and you'll be very happy in the end.

Strategy - DMI Indicator with DPO Indicator as a GuardThe Directional Movement Index Indicator is one of my favorite indicators in tradingview's built-in library. It is free to use for all
For more information on what the DMI is, please visit: www.tradingview.com
The only problem I've come across with the DMI is that when it hits a 'trade range zone' it triggers false new trends (this is the case with almost every indicator I've ever tested).
This script modifies the DMI by removing the need for the ADX logic. It only focuses on the +DI and the -DI.
In order to remove the 'noise' generated during a trade range zone I have added another powerful indicator called the Detrended Price Oscillator.
The DPO is also a 'built-in' indicator on tradingview. www.tradingview.com
The DPO is used in conjunction with the DMI to stop trade ranges from wrecking your profits.
This strategy logic simply checks for the DMI indicator to cross itself. If the +DI crosses over the -DI this is a bullish cross and visa versa, if the -DI crosses over the +DI then it could mean bearish sentiment is building.
But then strategy logic uses the DPO to check if the DPO is above 0 or below 0 value
If the +DI crosses over the -DI and the DPO is above 0 value, then it's a Long entry point.
However, if the +DI crosses over the -DI and the DPO is below 0 value, then the Long signal is void.
And visa versa, if the -DI crosses over the +DI and the DPO is below 0 value, then it's a Short entry point (unless the DPO is greater than 0)
With this DPO 'guard' in place, it helps us keep the total trades executed to a minimum.
This is vital to push through trade ranges that can wreck your profit potential.
I wish I could create a better plotting mechanism for this indicator so you can better see the visuals. But combining the DMI to scale with the DPO is not possible.
The best solution is to simply add another DMI indicator to your chart so you can compare the DMI to this script that is dominated by the DPO (yellow line).
Enjoy! Likes are much appreciated!

MACD, RSI, & RVOL Strategy
This strategy combines the use of MACD (12, 26, 9), RSI (14, 30, 70), and RVOL (14) to create Long Buy and Sell signals. This works well with many different time intervals but was developed with 15-minute intervals in mind.
Using MACD as a reference, the strategy identifies when the MACD line crosses over (a factor in a buy signal) and under (a factor in a Sell signal) the Signal line. This shows a shift in positive (cross over) and negative (cross under) of a security.
Using the Relative Strength Index ( RSI ) as an indicator, the strategy notices when the velocity and magnitude of the directional price movements cross over the Oversold signal (30) and crosses under the Overbought signal (70) as a factor in creating a Buy and Sell signal.
Using Relative Volume (RVOL) as an indicator, the strategy calculates when the current volume has crossed over the 2x average volume indicator over a given period and is then used as a factor in creating a Buy signal. RVOL is also used when the change in volume crosses under a set RVOL number (in this strategy, it is set to a RVOL of 5).
RVOL = Current Volume / Average Volume over a certain period
This strategy indicates a Buy signal when 2/3 conditions are met:
- RSI Cross Over the Over Sold signal (default 30)
- MACD Cross Over of Signal ( MACD > Signal)
- RVOL Cross Over of 2 (RVOL > 2)
This strategy indicates a Sell signal when 2/3 conditions are met:
- RSI Cross Under the Over Bought signal (default 70)
- MACD Cross Under of Signal ( MACD < Signal)
- RVOL Cross Under 5 (RVOL < 5)
Enjoy and leave feedback!

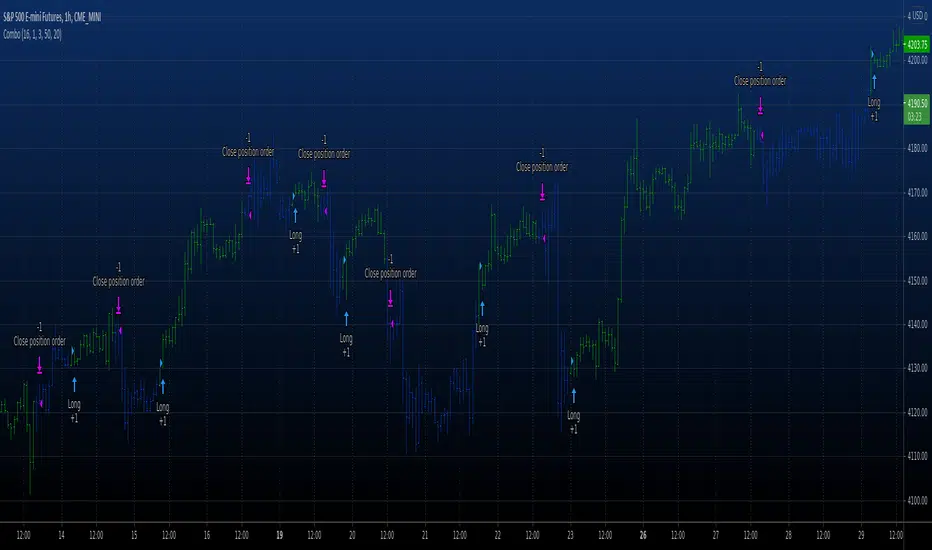
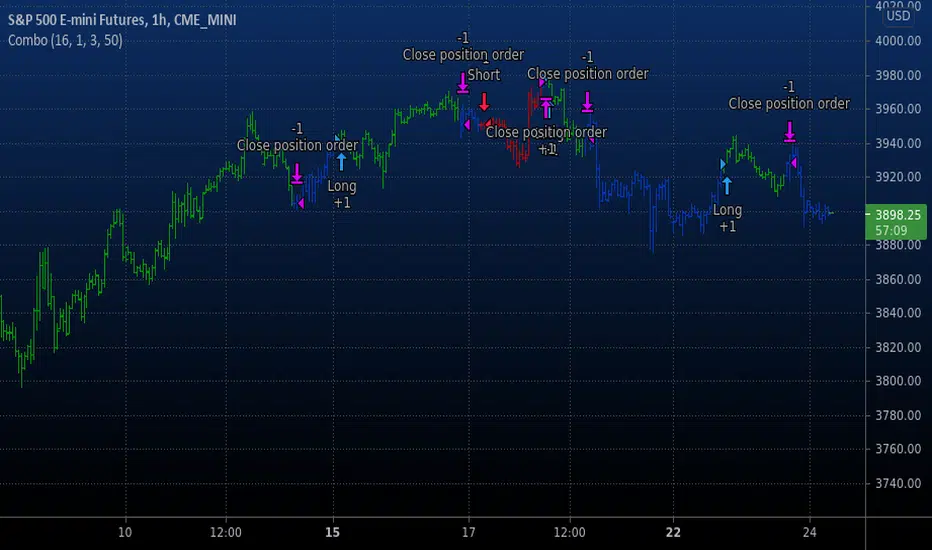
Combo Backtest 123 Reversal & Psychological line This is combo strategies for get a cumulative signal.
First strategy
This System was created from the Book "How I Tripled My Money In The
Futures Market" by Ulf Jensen, Page 183. This is reverse type of strategies.
The strategy buys at market, if close price is higher than the previous close
during 2 days and the meaning of 9-days Stochastic Slow Oscillator is lower than 50.
The strategy sells at market, if close price is lower than the previous close price
during 2 days and the meaning of 9-days Stochastic Fast Oscillator is higher than 50.
Second strategy
Psychological line (PSY), as an indicator, is the ratio of the number of
rising periods over the total number of periods. It reflects the buying
power in relation to the selling power.
If PSY is above 50%, it indicates that buyers are in control. Likewise,
if it is below 50%, it indicates the sellers are in control. If the PSY
moves along the 50% area, it indicates balance between the buyers and
sellers and therefore there is no direction movement for the market.
WARNING:
- For purpose educate only
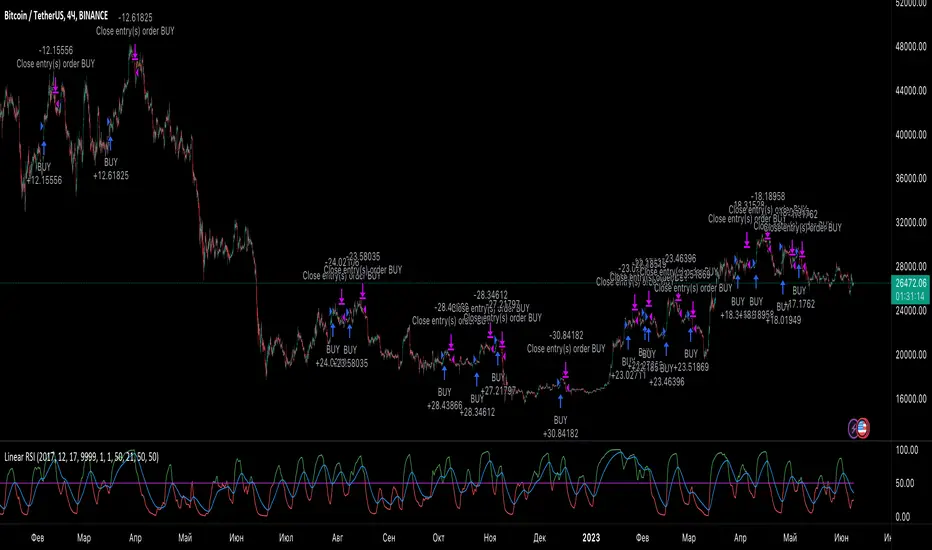
Linear RSIThis is an attempt to create a strategy based on the previous post. The strategy, as before, is based on the RSI, which is calculated using linear regression, but with the addition of EMA. The crossing of EMA and RSI is a buy and sell signal. There are also two functions to buy (because I haven't decided which is really better), so please use checkbox to order which one you would like to use.
[laoowai]BNB_USDT_3m_3Commas_Bollinger_MACD_RSI_StrategyBNB_USDT _3m
Release Notes:
Time: 3min
Pair: BNB_USDT
Use: {{strategy.order.alert_message}}
What's the difference with 3Commas Bollinger Strategy by tedwardd:
1. Initial capital: 1210 USDT (10$ Base order / 400$*3 Safety order), if you will change, please change JUST safety order volume or number of safety orders 2-3
2. Using just 2(3) safety order (original script 4)
3. More high-performance strategy for BNB_USDT
4. Using MACD to sell order (original script take profit by scale), thanks Drun30 .
5. Using RSI to analyze the market conditions.
Need to change:
bot_id = input(title="3Commas Bot ID", defval=" YOUR DATA ")
email_token = input(title="Bot Email Token", defval=" YOUR DATA ")
---------------------------------------------------------------------------------------------------------------------------------------------------------------------------------------------------
FAQ copy from tedwardd
---------------------------------------------------------------------------------------------------------------------------------------------------------------------------------------------------
This strategy is intended for use as a way of backtesting various parameters available on 3commas.
The primary inputs for the strategy are:
---------------------------------------------------------------------------------------------------------------------------------------------------------------------------------------------------
// USER INPUTS
Short MA Window - The length of the Short moving average
Long MA Window - The length of the Long moving average
Upper Band Offset - The offset to use for the upper bollinger offset
Lower Band Offset - The offset to use for the lower bollinger offset
Long Stop Loss % - The stop loss percentage to test
Long Take Profit % - The Take profit percentage to test
Initial SO Deviation % - The price deviation percentage required to place to first safety order
Safety Order Vol Step % - The volume scale to test
3Commas Bot ID - (self-explanatory)
Bot Email Token - Found in the deal start message for your bot (see link in the previous section for details)
3Commas Bot Trading Pair - The pair to include for composite bot start deals (should match the format of 3commas, not TradingView IE. USDT_BTC not BTCUSDT )
---------------------------------------------------------------------------------------------------------------------------------------------------------------------------------------------------
Start Date, Month, Year and End Date, Month, and Year all apply to the backtesting window. By default, it will use as much data as it can give the current period select (there is less historical data available for periods below 1H) back as far as 2016 (there appears to be no historical data on Trading view much before this). If you would like to test a different period of time, just change these values accordingly.
---------------------------------------------------------------------------------------------------------------------------------------------------------------------------------------------------
Composite bot using a Bollinger band type trading strategy. While its primary intention is to provide users a way of backtesting bot parameters, it can also be used to trigger a deal start by either using the {{strategy.order.alert_message}} field in your alert and providing the bot details in the configuration screen for the strategy or by including the usual deal start message provided by 3commas.
---------------------------------------------------------------------------------------------------------------------------------------------------------------------------------------------------
Original script:
1. 3Commas Bollinger Strategy by tedwardd
2. Momentum Strategy ( BTC /USDT; 1h) - MACD (with source code) by Drun30

Stochastic TrendDear community,
I've made another simple trading bot for you to use. This bot is based on the Stochastic Oscillator. It only produces long trades currently.
I changed the oscillation period to a much longer one, which in turn creates opportunities to trade long term trends.
The bot goes long when the Entry lines is crossed from below and it will close its long position once the Exit line has been crossed from above.

Bollinger Bands strategy with RSI and MACD v1.0 This is a strategy based on the Bollinger Bands, where buy trades are made when the price crosses the lower line of the Bollinger Bands upwards, and sell trades are made when the price crosses the upper line downwards.
In addition, it is possible through the inputs to enable trading with RSI and MACD, so that buy or sell trades are supported by these two indicators.
Trades are partially and fully closed in the following way, a buy trade will close half of the position when the price touches the middle line of the Bollinger bands and will be fully closed when the price touches the upper band. In the case of a sell position, half of the position will be closed if the price touches the middle band and the entire position will be closed when the price touches the lower band. Alternatively, a fixed take profit can be placed. In case the price moves against us, trailing stops can be placed.
In case of selecting to use RSI, MACD, or MACD variation, trades will be executed as long as The Bollinger Bands, and all the above-mentioned indicators give the same signals, either buy or sell.
For example in the case of selecting only Use RSI, buy trades would be made as long as RSI and BB give buy signals.
Strategy inputs:
-BB source: Bollinger Bands price source.
-Bollinger Bands SMA length: Bollinger Bands simple moving average length.
-Bollinger Bands StdDev length: Bollinger Bands standard deviation length.
-Trail Long Loss (%): Distance in percentage at which the stop loss will initially be placed for buy trades.
-Trail Short Loss (%): Distance in percentage at which the stop loss will be initially placed for sell trades.
-Maximum orders: Maximum of simultaneous operations, for example, if it is 3, up to 3 parallel operations of buy and up to 3 parallel operations of sell will be carried out.
-Position size: Number of contracts per trade.
-Use RSI: If selected, the strategy will also trade based on oversold or overbought signals provided by the RSI.
-RSI source: RSI price source.
-RSI period: The RSI period to use.
-RSI value for buy: If the RSI is below this value, it will give a buy signal.
-RSI value for sell: If the RSI value is above this value, it will give a sell signal.
-Use MACD: If selected, buy trades will be made when the MACD crosses 0 upwards, and sell trades will be made when the MACD crosses 0 downwards.
-Use MACD variation: Only available if MACD is previously selected. In this case, buy trades are made if the MACD value in the last 3 candles has been decreasing, and sell trades are made if the MACD value has been increasing.
-MACD source: MACD price source.
-MACD fast length: MACD fast EMA lenght.
-MACD slow length: MACD slow EMA lenght.
-MACD signal length: MACD signal EMA lenght.
-Use maximum TP long: If selected, a fixed take profit will be placed for buy trades. The position could be closed before reaching this take profit if the price touches one of the lower or upper lines first.
-Maximum take profit long (%): Distance in percentage at which the take profit will be placed for buy trades.
-Use maximum TP short: if selected, a fixed take profit will be placed for sell trades. The position could be closed before reaching this take profit if the price touches one of the lower or upper lines first.
-Maximum take profit short (%): Distance in percentage at which the take profit will be set for sell trades.
I hope you like it and as always all feedback is welcome.

MACD oscillator with EMA strategy 4H This is a simple, yet efficient strategy, which is made from a combination of an oscillator and a moving average.
Its setup for 4h candles with the current settings, however it can be adapted to other different timeframes.
It works nicely ,beating the buy and hold for both BTC and ETH over the last 3 years.
As well with some optimizations and modifications it can be adapted to futures market, indexes(NASDAQ,NIFTY etc), forex(GBPUSD), stocks and so on.
Components:
MACD
EMA
Time condition
Long/short option
For long/exit short we enter when we are above the ema, histogram is positive and current candle is higher than previous.
For short /exit long , when close below ema, histo negative and current candles smaller than previous
If you have any questions please let me know !

SMIO strat SMIO strat with longer input which rounds off the trends. The strat is based on when SMIO hits over 0 it sends a buy signal and when it goes under it sends a short signal. The SMIO input was changed from 20, 5, 5 to 35, 15, 15.

Crypto rsi cci mf stoch rsi oscillators all in one strategyThis is a strategy based on the popular oscillator like RSI, CCI, MF and Stochastic RSI oscillators.
In this situation I use a very high length , 100 candles, and the middle point between overbought and oversold levels at 50.
The entry for long is when all oscilators are above 50, and the exit is when they are below 50 + plus some minor modifications
If you have any questions, please message me a private message !

Combo Backtest 123 Reversal & MovROC (KST indicator) This is combo strategies for get a cumulative signal.
First strategy
This System was created from the Book "How I Tripled My Money In The
Futures Market" by Ulf Jensen, Page 183. This is reverse type of strategies.
The strategy buys at market, if close price is higher than the previous close
during 2 days and the meaning of 9-days Stochastic Slow Oscillator is lower than 50.
The strategy sells at market, if close price is lower than the previous close price
during 2 days and the meaning of 9-days Stochastic Fast Oscillator is higher than 50.
Second strategy
This indicator really is the KST indicator presented by Martin Pring.
the KST indicator is a weighted summed rate of change oscillator that
is designed to identify meaningful turns. Various smoothed rate of change
indicators can be combined to form different measurements of cycles.
WARNING:
- For purpose educate only
- This script to change bars colors.
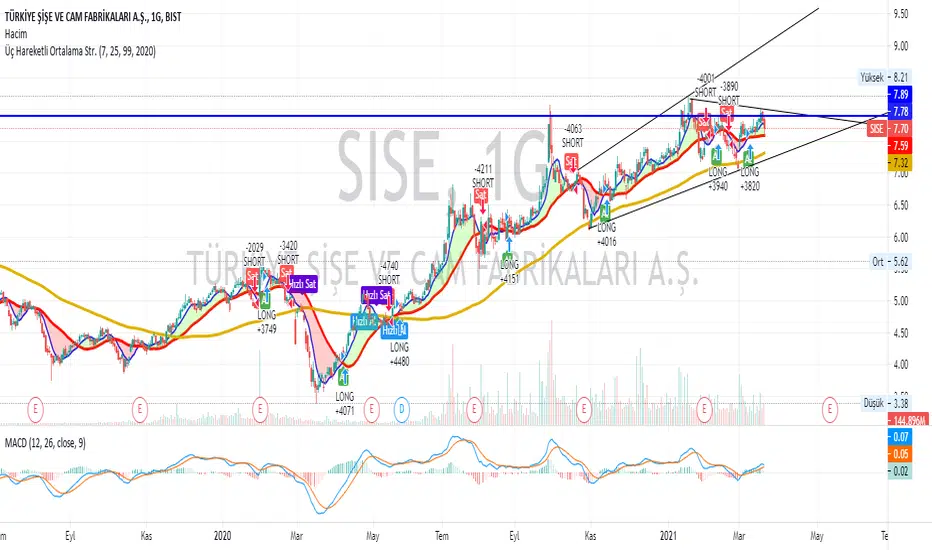
Three moving average strategies
If the short term (Default 7) moving average cuts the medium term (default 25) moving average, BUY. Conversely, it generates the SELL signal. If the long term (Default 99) moving average cuts its short term moving average, Quick SELL. Conversely, it can be interpreted as Fast SELL. You can change the moving average and the number of days as you wish, and you can trade in the short or long term. I hope it was useful.
MACD Crossover trend strategy, Long and ShortHey everybody,
This is my first strategy and script I wrote mostly myself. There's tons of content out there to learn how to code in Pinescript and it's exactly what I wanted and needed in this time of my life.
In any case, I made a rather simple MACD crossover strategy that only takes trades in the direction of both EMA and SMA (there are inputs to change the length of the moving averages and lots of other stuff too).
If the MACD line crosses upwards on the signal line, while above the zero point of the histogram and the price is above EMA + SMA , it's a long signal.
If the MACD line cosses downards on the signal line, while below zero on the histogram and the price is below EMA + SMA , it's a short signal.
There are a lot of default variables that make no sense, for basically any symbol you're going to be looking at. You're going to have to adjust the EMA , SMA , backtest date, take profit, stop loss and all that good stuff yourself to find decently profitable parameters.
I made this myself because I couldn't really find a strategy out there that allowed for so much customizing and it's an easy way to get started in Pinescript.
If you have any suggestions, tips or you see a flatout mistake in my code, please let me know. I'm still learning, everyday and I'm enjoying every second of it.

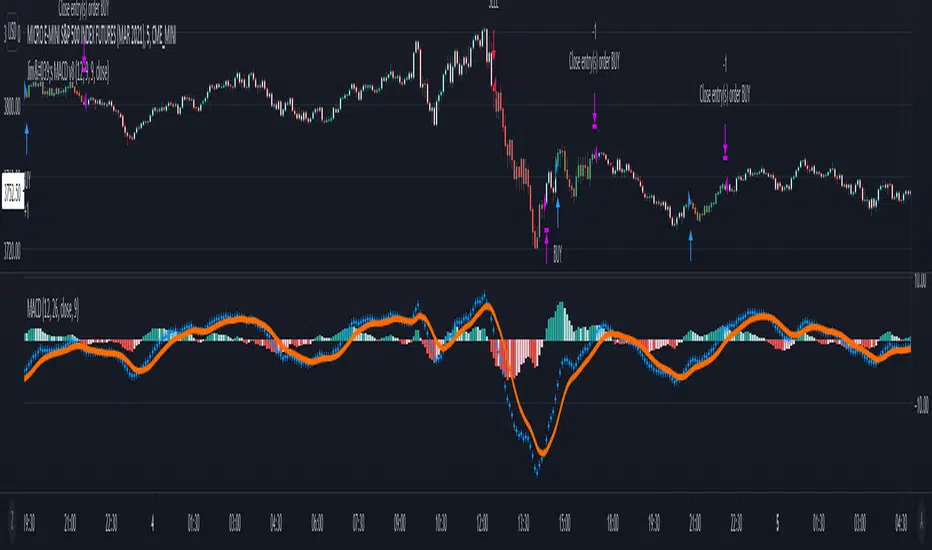
Momentum Strategy (BTC/USDT; 1h) - MACD (with source code)Good morning traders.
It's been a while from my last publication of a strategy and today I want to share with you this small piece of script that showed quite interesting result across bitcoin and other altcoins.
The macd indicator is an indicator built on the difference between a fast moving average and a slow moving average: this difference is generally plottted with a blue line while the orange line is simply a moving average computed on this difference.
Usually this indicator is used in technical analysis for getting signals of buy and sell respectively when the macd crosses above or under its moving average: it means that the distance of the fast moving average (the most responsive one) from the slower one is getting lower than what it-used-to-be in the period considered: this could anticipate a cross of the two moving averages and you want to anticipate this potential trend reversal by opening a long position
Of course the workflow is specularly the same for opening short positions (or closing long positions)
What this strategy does is simply considering the moving average computed on macd and applying a linear regression on it: in this way, even though the signal can be sligthly delayed, you reduce noise plotting a smooth curve.
Then, it simply checks the maximums and the minimums of this curve detecting whenever the changes of the values start to be negative or positive, so it opens a short position (closes long) on the maximum on this curve and it opens a long position (closes short) on the minimum.
Of course, I set an option for using this strategy in a conventional way working on the crosses between macd and its moving average. Alternatively you can use this workflow if you prefer.
In conclusion, you can use a tons of moving averages: I made a function in pine in order to allw you to use any moving average you want for the two moving averages on which the macd is based or for the moving average computed on the macd
PLEASE, BE AWARE THAT THIS TRADING STRATEGY DOES NOT GUARANTEE ANY KIND OF SUCCESS IN ADVANCE. YOU ARE THE ONE AND ONLY RESPONSIBLE OF YOUR OWN DECISIONS, I DON'T TAKE ANY RESPONSIBILITY ASSOCIATED WITH THEM. IF YOU RUN THIS STRATEGY YOU ACCEPT THE POSSIBILITY OF LOOSING MONEY, ALL OF MY PUBBLICATIONS ARE SUPPOSED TO BE JUST FOR EDUCATIONAL PURPOSES.
IT IS AT YOUR OWN RISK WHETHER TO USE IT OR NOT
But if you make money out of this, please consider to buy me a beer 😜
Happy Trading!

Delta-RSI Strategy (with filters)Delta-RSI Strategy (with filters):
This is a version of the Delta-RSI Oscillator strategy with several criteria available to filter entry and exit signals. This script is also suitable for backtesting over a user-defined period and offers several risk management options (take profit and stop loss).
Since the publication of the Delta-RSI Oscillator script, I have been asked many times to make it compatible with the Strategy Tester and add filtering criteria to minimize "false" signals. This version covers many of these requests. Feel free to insert your favorite D-RSI parameters and play around!
ABOUT DELTA-RSI
Delta-RSI represents a smoothed time derivative of the RSI designed as a momentum indicator (see links below):
INPUT DESCTIPTION
MODEL PARAMETERS
Polynomial Order : The order of local polynomial used to interpolate the relative strength index (RSI).
Length : The length of the lookback frame where local regression is applied.
RSI Length : The timeframe of RSI used as input.
Signal Length : The signal line is a EMA of the D-RSI time series. This input parameter defines the EMA length.
ALLOWED ENTRIES
The strategy can include long entries, short entries or both.
ENTRY AND EXIT CONDITIONS
Zero-crossing : bullish trade signal triggered when D-RSI crosses zero from negative to positive values (bearish otherwise)
Signal Line Crossing : bullish trade signal triggered when D-RSI crosses from below to above the signal line (bearish otherwise)
Direction Change : bullish trade signal triggered when D-RSI was negative and starts ascending (bearish otherwise)
APPLY FILTERS TO
The filters (described below) can be applied to long entry, short entry and exit signals.
RELATIVE VOLUME FILTER
When activated, the D-RSI-driven entries and exits will be triggered only if the current volume is greater than N times the average over the last M bars.
VOLATILITY FILTER
When activated, the D-RSI-driven entries and exits will be triggered only if the N-period average true range, ATR, is greater than the M-period ATR. If N < M, this condition implies increasing volatility.
OVERBOUGHT/OVERSOLD FILTER
When activated, the D-RSI-driven entries and exits will be triggered only if the value of 14-period RSI is in the range between N and M.
STOP LOSS/TAKE PROFIT
Fixed and trailing stop loss as well as take profit options are available.
FIXED BACKTESTING START/END DATES
If the checkboxes are not checked, the strategy will backtest all available price bars.

[KL] BOLL + MACD Strategy v2 (published)This strategy will look for opportunities when price touches the lower Bollinger band, then enters Long when it anticipates a MACD crossover signal.
Setup: on 1-day chart interval
Exits when either (a) hitting trailing stop loss, or (b) meeting risk-to-reward, if defined by user.

TSI HMA CCIHi!
This strategy has TSI and CCI indicators with the CCI being based on a HMA instead of the Price.
There is a number of conditions that must combine to create buy or sell signals, but it is basically a couple of MA crossovers.
The strategy opens new orders on each candle if the conditions are met, Either direction, so it is hedging.
It wont open new orders if there is a floating loss, and so is constantly attempting to hold a floating profit (drawup instead of drawdown)
But It has a StopLoss (set by user) for closing of losing orders, and it closes all orders in basket style when account is in profit to users set amount target profit.
Low commission set to simulate swap but Forex pairs generally dont have commission like the crypto exchanges do. So if you use this on cryptos, remember to increase the commission to your brokers amount.
Crypto users will likely find that because this opens so many orders the commission could erase its profits.
So i recommend this for Forex only, and perhaps, only NZDUSD 4H chart. other pairs, change settings for.
The strategy has settings for testing on target time spans, so you could test it on just Jan-Feb 2020 for example, if you want, or from Jan 2020 to present day.
Have Fun! Open Script for copy/paste/edit/publish your own version :)

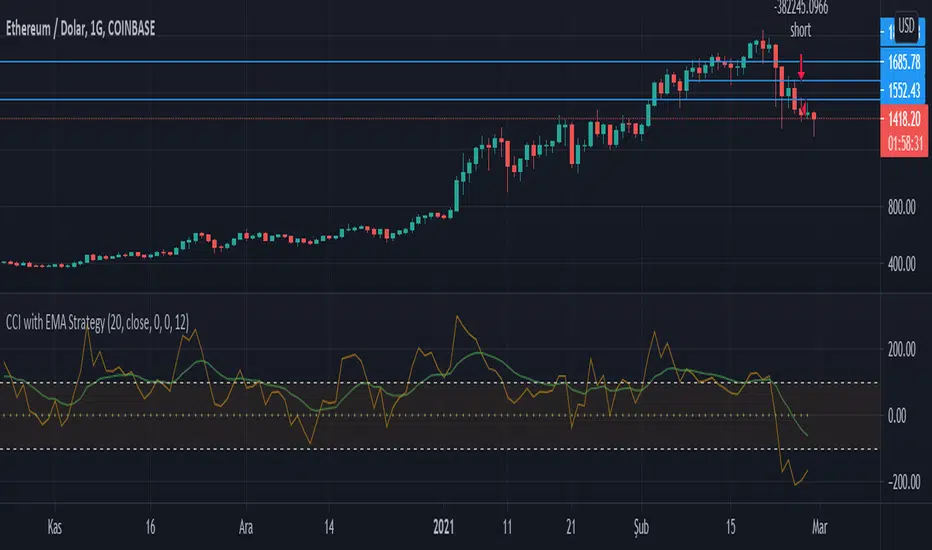
CCI with EMA StrategyI designed it as buy and sell when the cci 0 point cut, but you can optimize it by changing the buy sell points
I used moving average to smooth out cci's movements
Jim's MACDMACD Buy/Sell Strategy
Filters bearish crossovers above the 0 line and bullish crossovers below.
Uses 34 ema to further filter the trades and take only longs above and only shorts below.
Apply at least 2:1 risk to reward ratio to account for losing trades.
Trade at own risk!
RSI-VWAP Indicator %█ OVERALL
Simple and effective script that, as you already know, uses vwap as source of the rsi, and with good results as long as the market has no long-term downtrend.
RsiVwap = rsi (vwap (close), Length)
The default settings are for BTC in a 30 minute time frame. For other pairs and time frames you just have to play with the settings.
█ FEATURES
• The option to start trading from a certain date has been added.
• To make the profit more progressive, a percentage of your equity is used for entries and a percentage of your position is used for closings.
• The option to trade in Spot mode has been added, since, for the TradingView backtest, the money is infinite and if you do not limit it somehow,
it would offer you much better profits than the live trading.
QuantityOnLong = Spot ? (EquityPercent / 100) * ((strategy.equity / close) - strategy.position_size) : (EquityPercent / 100) * (strategy.equity / close)
• The option to stop the system when the drawdown exceeds the fixed limit has been added.
Drawdown, as you already know, is a very important measure of risk in trading systems.
The maximum drawdown will tell us what the maximum loss of a trading system has been during a period. This maximum loss is determined by:
strategy.risk.max_drawdown(Risk, strategy.percent_of_equity)
• Leverage plotted on labels added.
█ ALERTS
To enjoy the benefits of automatic trading, TradingView alerts can be used as direct buy-sell orders on spot, or long-close orders with leverage.
Currently there are Chrome extensions that act as a bridge between TradingView and your Exchange or Broker.
This is an example of syntax for this type of extensions. Copy and paste a message like this into the alert window:
{{strategy.order.action}} @ {{strategy.order.price}} | e = {{exchange}} a = account s = {{ticker}} b = {{strategy.order.action}} {{strategy.order.alert_message}}
█ NOTE
Certain Risks of Live Algorithmic Trading You Should Know:
• Backtesting cannot assure actual results.
• The relevant market might fail or behave unexpectedly.
• Your broker may experience failures in its infrastructure, fail to execute your orders in a correct or timely fashion or reject your orders.
• The system you use for generating trading orders, communicating those orders to your broker, and receiving queries and trading results from your broker may fail.
• Time lag at various point in live trading might cause unexpected behavior.
• The systems of third parties in addition to those of the provider from which we obtain various services, your broker, and the applicable securities market may fail or malfunction.
█ THANKS
Thanks to TradingView, its Pine code, its community and especially those Pine wizards who post their ideas that helps us to learn.
If the world is heading toward a equitable new world economic order, let's get rich first ...
Happy trading!

MA Divergences StrategyThis is the Strategy version of the Study I published. It is a Moving Average that can be applied to any plot to plot divergences on any oscillator, as well as perform backtesting. You'll need a REALLY good oscillator to perform live trades using this alone, but I think it is a valuable tool and had the Strategy hanging around and for some reason didn't upload it yet.
So here it is.
Turn Length to 1 to follow the oscillator without lag. Turn Length up if you are getting too many false signals or tweak the original oscillator settings.