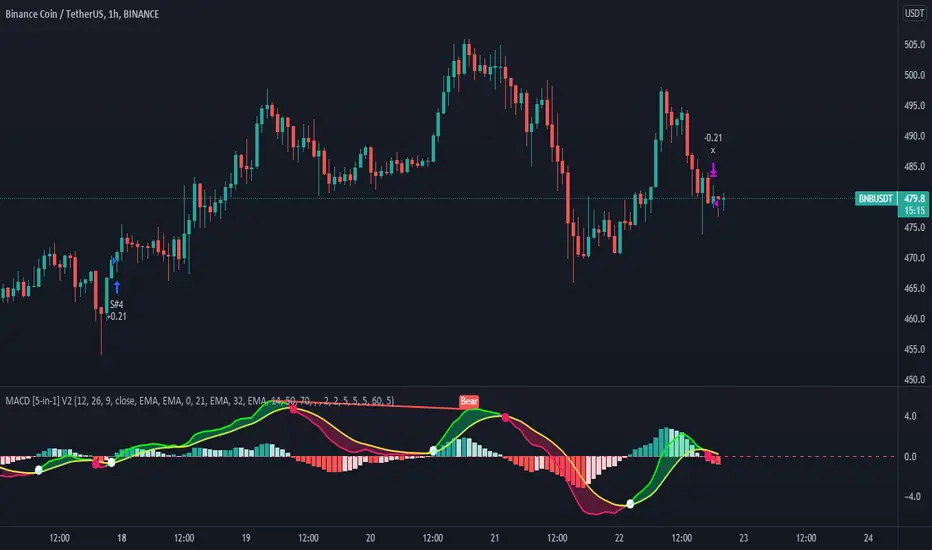
MACD 5 iN 1 [Pro-Tool]introducing MACD Which has different indicators inside,
And not only that, five different strategies have also been included in this indicator.
Strategy №1:👉 MACD Crossover Signal Line
Strategy №2:👉 MACD Crossover + MACD Overbought Section (for ignore false Crossover signals)
Strategy №3:👉 MACD Crossover + Market Close should b greater tha MOVING AVERAGE
Strategy №4:👉 MACD Crossover + Market Close should b greater tha MOVING AVERAGE ZONE
Strategy №5:👉 MACD Crossover + RSI Close should b greater tha 50 Level (or whatever level you choose)
also 5 types of MOVING AVERAGE you can choose
1: Simple Moving Average ( SMA )
2: Exponential Moving Average ( EMA )
3: Weighted Moving Average ( WMA )
4: Volume Weighted Moving Average ( VWMA )
5: Relative Moving Average (RMA)
and you can customize MACD Colors + Widths + Signals and MACD lines, and also can Hide or Unhide Histogram / Cross Sign / MACD Zone Color
hope so you like it, 🥰
Investing and trading in cryptocurrencies is very risky, as anything can happen at any time.
***NOT FINANCIAL, LEGAL, OR TAX ADVICE! JUST OPINION! I AM NOT AN EXPERT! I DO NOT GUARANTEE A PARTICULAR OUTCOME I HAVE NO INSIDE KNOWLEDGE! YOU NEED TO DO YOUR OWN RESEARCH AND MAKE YOUR OWN DECISIONS! THIS IS JUST EDUCATION & ENTERTAINMENT! USE ALTCOIN DAILY AS A STARTING OFF POINT!
Centered Oscillators
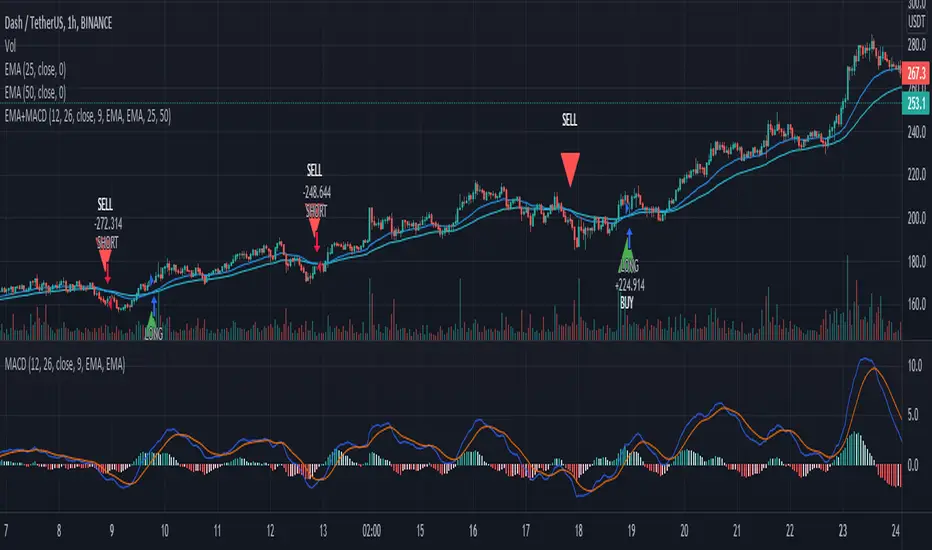
EMA+MACDA simple script using EMA 25 and EMA 50 with MACD. Enter long when EMA 25 crossover ema 50 and MACD line > 0, enter short when EMA 50 crossover ema 25 and MACD < 0
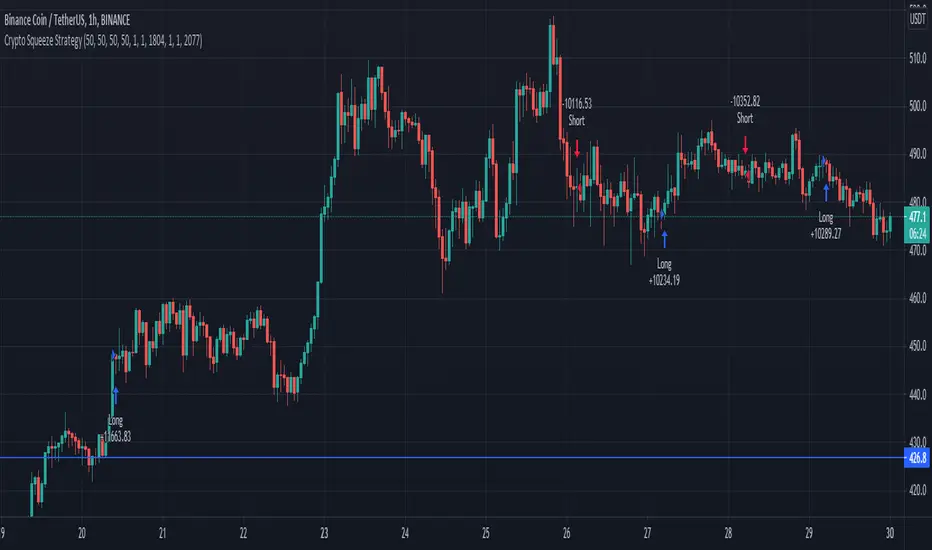
Crypto Squeeze StrategyThis strategy was inspired by two famous Trading View contributors. Shout out to Lazy Bear and Crypto Face!
The strategy includes a similar replication of the blue wave, and MFI indicator. The point of the strategy is to buy when the blue wave crosses up the zero value, and the MFI is greater than zero value. This indicates that there is strong bullish momentum and money flowing into the market.
Full Crypto Swing Strategy ALMA Cross with MACDThis is a full crypto swing strategy designed.
From my testing it looks like it perform the best on timeframes 4h +.
The below example has been adapted to BNB/USDT, using the entire period since 2017 until present day, with a comission of 0.03% ( which is the comission for the futures on binance).
Its components are :
ALMA Fast
ALMA Slow
MACD Histogram
Rules for entry
For long, we have a crossover of the fast alma with the slow one and the histogram is ascending.
For short, we have a crossunder of the fast alma with the slow one and the histogram is descending.
Rules for exit
We exit based on a risk management system for TP and SL, or when we receive an opposite condition than the initial one.
Regarding risk management
0.05 = 5% movement
2 = 200% movement
0.001 = 0.1% movement
If you have any questions, let me know !

Crypto Scalper Divergence Macd Psar Ema 200This is a very efficient crypto scalper adapted to very short timeframes, however it can be optimized for other timeframes and assests as well.
Its components are
MACD
P SAR
EMA 200
Risk management
Rules for entry:
For short : we have an uptrend on PSAR , histogram is positive (divergence MACD) and close of a candle is below EMA 200
For long : we dont have an uptrend on PSAR, histogram is negative(divergence MACD) and close of a candle is above EMA 200
Rules for exit:
We exit when we either find a reverse condition than the entry one, or based on stop loss/take profit that are calculated on % movements of the price.
If you have any questions, let me know !

[VJ]Phoenix Force of PSAR +MACD +RSIThis is a simple intraday strategy for working on Stocks or commodities based out on PSAR, MACD , RSI and chop index . You can modify the start time and end time based on your timezones. Session value should be from market start to the time you want to square-off
Important: The end time should be at least 2 minutes before the intraday square-off time set by your broker
Comment below if you get good returns
Strategy: Entry Exits using PSAR and momentum and trend using MACD and RSI. A chop index is used as filtering
Indicators used :
Parabolic SAR is a technical indicator that is used to determine the price direction of stocks and it also draws attention to the traders when the price is changing
PSAR helps you:
Identify when a certain price trend is going to change direction
Indicate the most effective level at which to enter into the trade
Indicate the most effective exit point for the trade
Moving average convergence divergence (MACD) is a trend-following momentum indicator that shows the relationship between two moving averages of a security's price. ... Traders may buy the security when the MACD crosses above its signal line and sell—or short—the security when the MACD crosses below the signal line
RSI is intended to chart the current and historical strength or weakness of a stock or market based on the closing prices of a recent trading period.
Buying/Selling
When trading with the parabolic SAR, you would buy a market when the dots move below the current asset price and are green in colour. Alternatively, you would sell a market when the dots move above the current asset price and are red in colour. We use MACD , RSI to ensure that a right trade is picked when PSAR gives an indication. CI is used to stay away from the range bound market as much as possible.
Usage & Best setting :
Choose a good volatile stock and a time frame - 5m.
MA length : 200
RSI threshold : 50
MACD: 12,26,9
There is stop loss and take profit that can be used to optimise your trade
The template also includes daily square off based on your time.

Aggresive Scalper/Swing Crypto StrategyThis is a simple yet very efficient scalper long strategy adapted for low timeframes for crypto. Can also be used with bigger timeframes as a swinger.
Its main components are:
Price oscillator swing
Vortex
Risk management for TP/SL
Rules for entry
We calculate the difference between the oscillator from the lowest low and the highest high. If the difference is positive, its a long potential. If its negative we exit from the long trade.
At the same time we check that the we have a crossover between the VIP vortex with the VIM vortex part.
Lastly we check that the current candle is bigger the second previous high.
Rules for exit
If we reach the take profit or the stop loss.
If we have a negative difference betwee LL and HH and VIP vortex crossunder with VIM vortex .
In this example I aimed for a 1:10 risk reward ratio, meaing that for every dollar lost, we will gain 10 when we win. Thus having a 10% minimum win rate will give us a profit over many trades.
If you have any questions, let me know !

MACD, EMA, Know sure thing, Chopy Market - high adaptabilityHey there :)
This is the free version of the script. The following indicators / settings are missing:
- Support and resistance zones
- dynamic textboxes for alarms when using bots (3 Commas, Alertatron, etc.)
- a table showing the current position, indicators and other important information
With this script there is the possibility to completely customize the MACD . Starting with the MACD and signal line, the histogram and the color of the histogram.
Since the Pinecoders team has previously deleted the script, I will mention the fee settings in a bit more detail:
In this script a fee of 0.01% and a slipage of 15 was used. With each trade the total capital (100%) is used with a risk reward of 1 to 1.5.
The total capital, i.e. the risk, can be changed at any time under the "Settings" tab at "Equity".
I also added an EMA , the Know sure thing indicator and the Chopy Market indicator (by TradingRush) to the script to filter out bad trades.
The EMA:
Since the EMA is very reliable and shows whether there is an upward or downward trend, it should be used with the indicators in any case. It prevents long trades in downward movements and vice versa.
The KST Indicator:
The KST indicator has a similar movement as the MACD, but is by and large a bit more time delayed. It filters out false swings of the MACD and thus prevents bad trades.
The Chopy Market Indicator by Tradingrush:
The Chopy Market indicator, which was introduced by TradingRush in one of its videos, has the ability to detect sideways markets and block zones below this line for trades by means of a fixed value (the line).
To exit the trades, I added the following options:
ATR Exits. Exits based on past candles (lowest low, highest high).
Static exits based on set percentages.
In the next days I will create a tutorial for the script, just have a look on my profile.
If you have any questions about the script, let me know.
Forex bot full strategy with risk managementThis is a full strategy designed for forex major pairs, specially EUR/USD using 1h time frame chart.
Its components are
200 EMA
MACD
OBV
PSAR
RIsk management with tp and sl movements
Rules for entry
For long = Previous histogram from MACD was below 0 and current one is above 0. CLose of a candle is above EMA 200 , OBV oscillator is negative and we have an uptrend from PSAR
For short = Previous histogram from MACD was above 0 and current one is below 0. CLose of a candle is below EMA 200 , OBV oscillator is positive and we have an downtrend from PSAR
Rules for exit
For tp and sl values we calculate the distance from the close of candle until the psar values.
If you have any questions, let me know !

Forex scalper 2xEMA + SRSI + MACDThis is a forex scalping strategy designed for the most liquid pairs, like major forex pairs.
Its made of
1 EMA 50
1 EMA 100
Stochastic RSI
MACD
Rules
For long :close of the candle is above moving average 50, moving average 50> moving average 100, macd histogram is positive and cross over of stochastic rsi with the oversold level.
For short :close of the candle is below moving average 50, moving average 50 < moving average 100, macd histogram is negative and cross under of stochastic rsi with the overbought level.
Exit
For exit we have take profit and stop loss using fixed pip points.
For this example on EURUSD we use 20 pips for both tp and sl
IF you have any questions let me know !

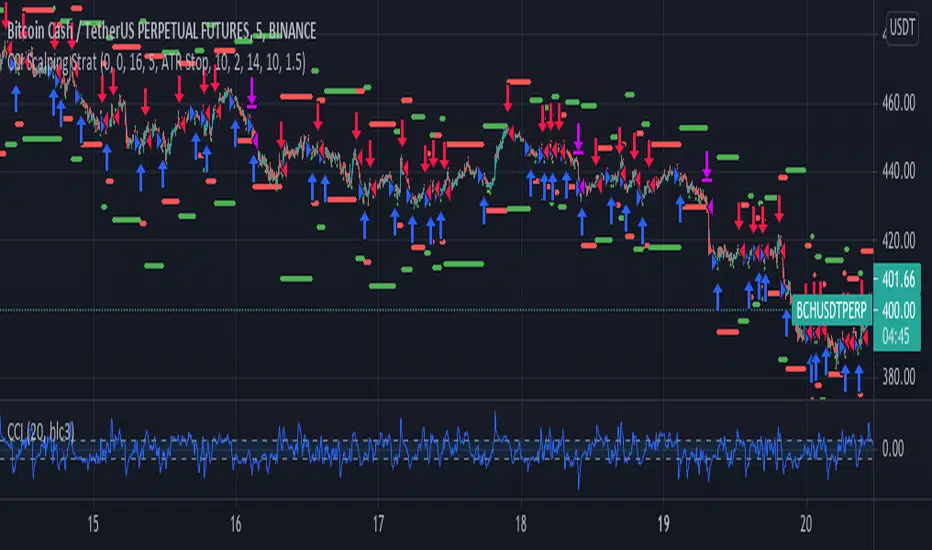
CCI Scalping Strategy---From the "Bitcoin Trading Strategies" book, by David Hanson---
After testing, works better with an ATR stop instead of the Strategy Stop. This parameter
can be changed from the strategy Inputs panel.
"CCI Scalping Strategy
Recommended Timeframe: 5 minutes
Indicators: 20 Period CCI, 20 WMA
Long when: Price closes above 20 WMA and CCI is below -100, enter when CCI crosses above -100.
Stop: Above 20 WMA"
Chaikin Money Flow + MACD + ATRHere I present you on of Trade Pro's Trading Idea: Chaikin Money Flow + MACD + ATR.
This strategy is not as profitable as it can be seen in one of his videos. In the forex market, the strategy could reach a maximum of 35% profitability.
I have, as some of my followers have requested, created an overview of the current position, risk and leverage settings in the form of a table.
Furthermore, one can again swap between short and long positions.
It is now possible to select or deselect individual indicators.
I have chosen the ATR alone as a take profit stop loss, as in his strategy.
A position is only triggered as soon as all prerequisites have been fulfilled and a command is executed. This prevents false triggering by bots and repainting.
-----------------------------------------------------------------------------------
How does the strategy work?
ENTRY
Long
The MACD indicator must be above the zero line.
Then the K line must cross the D line.
Finally, when this happens, the Money Flow Index must be above the zero line.
Short
Contrary to the premise of long positions.
EXIT
ATR Exit
The value of ATR at the time of buying is multiplied by the value entered in "Profit factor ATR" and "Stop factor ATR". As soon as the price reaches this value, it is closed.
Important
The script must be optimized for each coin or currency pair.
I will publish a guide to the strategy shortly. There I will explain how the table works and how to set the strategy correctly.
The results of the strategy are without commissions and leverage.
If you have any questions or feedback, please let me know in the comments.

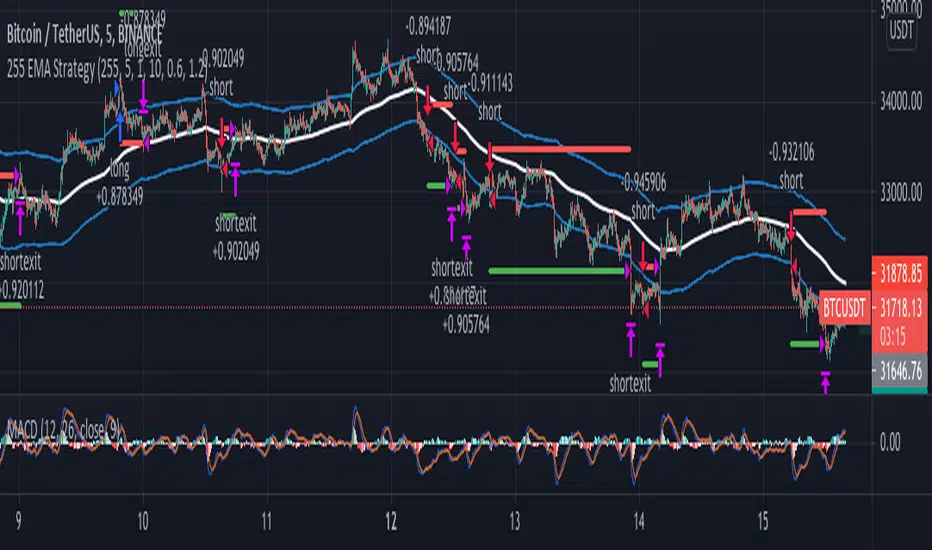
255 EMA Strategy//--- From 15 Trading Examples by Trader Alyx ---
// Seems like this strategy works better if we reverse the EMA filter logic.
// "Description: This basic scalping strategy allows you to enter the market based upon sentiment
// provided by the EMA, set at 255 periods. When price is trading below the 255 EMA, you would
// look to enter a LONG BUY positions, and when price is trading above the 255 EMA, you would
// look to enter a SELL SHORT position. The MACD lagging indicator will show you clear signals for
// when to do this. When the MACD lines cross in a bullish manner and price is below the 255
// EMA, buy. When the MACD lines cross in a bearish manner and price is above the 255 EMA,
// sell.
// NOTE: Make sure that price is trading away from the 255EMA before entering a LONG or SHORT
// position. As you can see in the chart below, the clearest signs for trade entry were presented
// when price was trading AWAY from the 255EMA"
CCI & EMA strategy by TradeswithashishThis strategy is extremely useful for positional traders or traders using timeframe 15-minute of higher. It uses following combo of values:
VWAP, CCI, Volume and Moving average (simple and exponential)
Caution:
Avoid taking trade if candle size is greater than twice the average candle size. for that wait for the retracement to near trailing stoploss

Dynamic Price SwingFinally, a price channel oscillator that works.
I programmed three flavors into this.
The first flavor uses the Fast and Slow EMA to check for the trend to ensure you don't trade in the wrong direction simply because the price crosses the previous highest high or lowest low (based on lookback bars).
The second flavor uses a seven point average of the Fibonacci bands to create an upper and lower central channel for quick trades (like DOGE).
The third flavor uses the golden Fibonacci ratio of 1.618 and trades when the price moves above or below this band.

Momentum Strategy IdeaThis strategy idea uses two, fast and slow, momentum indicators for trade setups and exits. This is a fast reacting strategy which is very useful in trending instruments on 1D and 4H timeframes. This is the implementation used in QuantCT app.
You can set operation mode to be Long/Short or long-only.
You also can set a fixed stop-loss or ignore it so that the strategy act solely based on entry and exit signals.
Trade Idea
When both momentum indicators are positive, asset is considered rising ( bullish ) and the plotted indicator becomes green.
When both momentum indicators are negative, asset is considered falling ( bearish ) and the plotted indicator becomes red.
Otherwise, asset is considered ranging and the plotted indicator becomes orange.
Entry/Exit rules
Enter LONG if both momentum indicators are greater than zero (i.e. when the plotted indicator becomes green).
Enter SHORT if both momentum indicators are lower than zero (i.e. when the plotted indicator becomes red).
EXIT market if none of the above (i.e. when the plotted indicator becomes orange).
CAUTION
It's just a bare trading idea - a profitable one. However, you can enhance this idea and turn it into a full trading strategy with enhanced risk/money management and optimizing it, and you ABSOLUTELY should do this!
DON'T insist on using Long/Short mode on all instruments! This strategy performs much better in Long-Only mode on many (NOT All) trending instruments (Like BTC , ETH, etc.).

Know Sure Thing and EMA Strategy by JLXThis is a simple strategy based in Know Sure Thing indicator and an Exponential moving average,
Rules are as follow:
- You can go long when the KST cross signal bellow 0 and price closes above the target EMA
- You can go short when the KST cross signal above 0 and price closes bellow the target EMA
I include a trailing stop loss, default its 0.5%
Hope you enjoy it

Coin Flipper Pro with strategy testerConverted the script "Coin Flipper Pro" into a Strategy. The same random "Coin Flip" trading fun with new features. Now users can run back test on the random trades and see how adjusting the risk to reward ratio affects the over all win rate and the profit of each trade. The Back test can be enabled or disabled in the settings along with the option to choose specific dates to run the test. Enjoy!

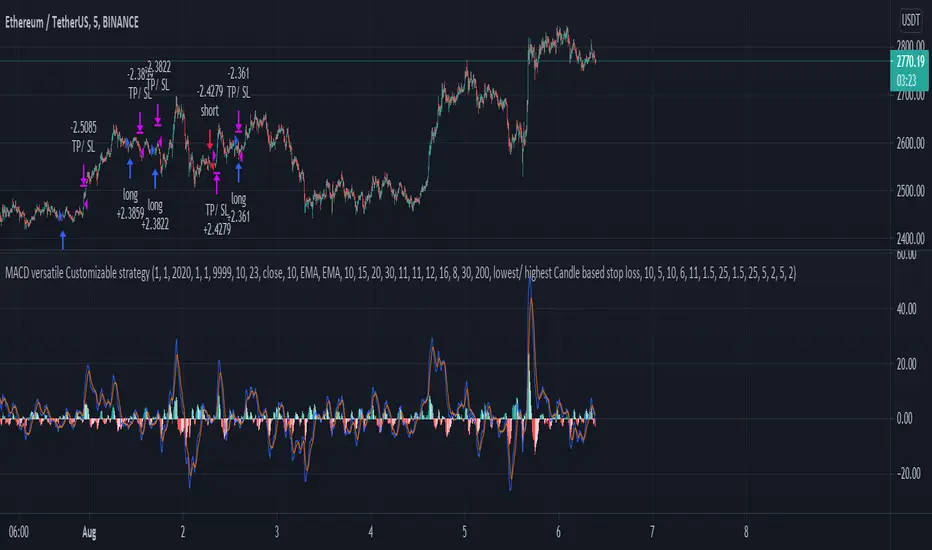
MACD EMA - TradingRush StrategyHey there!
Today I present you a rather simple, but very profitable MACD strategy. Since I trade it with cryptocurrencies, the settings have been adjusted.
I discovered the strategy on a YouTube channel and tried to transfer it as a strategy into a script.
Tested with the crypto pair ETH/USDT in the 15 minute chart.
There is the possibility to switch between short and long positions.
-----------------------------------------------------------------------------------
How does the strategy work?
ENTRY
The MACD indicator must cross below the histogram. If it crosses when the price is below the EMA, only short positions are traded. Above the EMA - long.
EXIT
The Lowest Low (long) / highest high (short) serves as the stop loss. The TP is formed on the basis of a factor. (SL multiplied by factor 2.1 = TP).
The red lines are used to illustrate the SL. Above for short positions below for long positions.
The results of the strategy are without commissions and levers.
If you have any questions or feedback, please let me know in the comments.
If you need more information about the strategy and want to know exactly how to apply it, check out my profile.
I wish you good luck with the strategy!

All in One Strategy no RSI Label - For higher dollar cryptoThis is the All in One Strategy without the RSI suggestion label that will work well for any of the crypto currencies trading above $500 so the overlay shows up better. I am using ETH as an example on this.
Based on some comments on my previously published script that has been replaced I have added Alert Conditions to this version that can be used in other bots. You can also copy and paste these alert conditions into the other All in One script I published for the lower priced cryptocurrencies.
To use the alert conditions I have in here, you will need to convert this strategy into a study to do so. Delete the entry and exit logic at the end (lines 299 through 351), delete line 18 and paste the following in place of line 18:
study(shorttitle='Ain1 No Label',title='All in One Strategy no RSI Label', overlay=true, scale=scale.left)
Here are the settings to mimic what you see here in the back test strategy I am publishing. Remember that previous results do not guarantee future results.
Chart Time = 30 Minutes (if you didn't read my original All in One post, read it. Shorter isn't better. You lose your money faster in a shorter amount of time and I learned that the hard way)
Start Time = 1 April 2021 00:00
End Time = 31 December 2021 00:00
Trade Type = Long/Short
Stop Loss % = 20.1
Take Profit % = 14.57
RSI Length = 20
Overbought = 44
Oversold = 45
EMA Fast Length = 5
EMA Slow Length = 15
Overbought Lookback Minimum Value = 62
Overbought Lookback Bars = 3
Oversold Minimum Value = 43
Oversold Lookback Bars = 5
Source = Close
Max Lookback Period = 5
Use EMA Only = True (check the box)
K = 9
D = 17
K Mode = SMA
High Source = ohlc4
Low Source = ohlc4
Properties - Starting Amount is $3500, everything else is the same.
Any questions, feel free to ask. I will answer as soon as I can.

Technicals Rating Strategy v420Ichimoku, HMA, RSI, Stoch, CCI, MACD, Technicals Rating Strategy is a trading Bot that looks at these chosen indicators and assigns a value to each, then calculates the result of adding each indicators result value to a overall rating, which is then compared to a user set level. Here seen on Bitcoin, it has the broker fee included in the testing result. If you choose to use it on Forex etc, perhaps remove the broker fee which is unrealistic for FX trading.
It has a Win/Loss ratio of only 40% wins, but it catches the big moves and thats the main thing, so if ELON MUSK had of used this strategy instead of BUY and HOLD, he could of made 700% instead of 7% (as is, may, 2021)
Mainly intended for use as Automated TRADE BOT.
(imagine if Elon Musk did use this bot with his 1.3 billion $ worth of BTC, the drawdown would be like, half a billion or something haha (p.s.- use smaller lotsize % to get smaller drawdown, but then smaller profit....) )
For use with any pair and timeframe. In fact there is a timeframe setting to set the strategy to look at alternative timeframe from chart, but as default will just be set to charts timeframe.

MACD Signal with RSI Indicating StrategyThis strategy looks for MACD signal crossover and RSI confirmation of oversold/overbought condition.
Tune to your crypto/stock for best results using the strategy and sent an alert. Currently set up to use 25% of equity at each buy signal and will sell 1/3 of position at each sell signal. Initial investment is $1000, but adjust as necessary.
Currently tuned to DOGEUSD on 30min chart.
If you like/use/profit, follow me or shoot me a donation. If you are looking for a script design, I can help.

TDI Hedge Strategy
This is the incomplete version but upon multiple requests, I have released it early. All of the strategy and alert functions are yet to be written and I'll get around to it soon.
This indicator aims to be the best TDI indicator on TradingView. It is a strategy or study. It will have all of the filter, entry, and exit conditions for the strategies around the TDI.
What is implemented
MFI or RSI: the MFI is a much better TDI baseline than the RSI, in my opinion, and very effective
EMA or SMA used for the moving averages on fast, slow, and volatility band
Dynamic timeframe: set a factor of current timeframe and indicator will analyse higher timeframe automatically
Manual timeframe: set a higher timeframe to analyse different to currently viewed
Features for later
conditions for TDI filters/entries/exits
Strategy functions to use built-in strategy tester
BTE signal plot for Backtesting & Trading Engine
alerts
Enjoy!
