EdgeXplorer - Liquidity ScopeLiquidity Scope by EdgeXplorer
Liquidity Scope is a real-time liquidity detection system developed for traders who want to track where the market is hunting stops, absorbing orders, and setting up traps — often before the average eye catches on. Built to identify the telltale behavior of liquidity sweeps and false breakouts, this tool highlights areas on the chart where price interacts with key swing points, including wicks, breaks, and retests.
⸻
🔍 What Does Liquidity Scope Do?
Liquidity Scope scans price action for swing highs and lows, tracks how price behaves around them, and visually plots zones where liquidity is likely being targeted. It tells you:
• When price wicks into a previous swing without breaking it (a liquidity probe),
• When price breaks past that level and returns (a potential retest),
• And when a sweep is complete or mitigated.
The result? A visual map of where liquidity was grabbed, where it hasn’t been yet, and where price might revisit — all drawn directly on your chart, in real time.
⸻
⚙️ How It Works – Technical Breakdown
Here’s the logic behind the engine:
1. Swing Detection
The script uses ta.pivothigh() and ta.pivotlow() to mark structural swing points, using your selected “Swings” length to define sensitivity.
2. Sweep Conditions
For each swing high or low:
• If price wicks into the level but fails to close beyond it → potential liquidity test.
• If price closes beyond the swing → it’s marked as broken.
• If price later retests the broken level from the other side → it’s tagged as a retest zone.
3. Visual Memory
Each swing level stores its own “memory state” (whether it was wicked, broken, retested, or mitigated), allowing the tool to update visuals live and avoid clutter.
4. Dynamic Zones
• When a sweep is detected, the tool draws a colored zone (box) at the sweep location, along with a supporting line.
• These zones extend forward until price clearly invalidates or mitigates them.
⸻
📈 Visual Components – What You See on the Chart
Element Meaning
Green Zones / Lines Bullish sweep: liquidity hunted below a swing low
Red Zones / Lines Bearish sweep: liquidity hunted above a swing high
Dotted Lines Wicks — price tested the level without breaking
Dashed Lines Retests — price returned to retest a broken level
Solid Lines Confirmed sweep levels with clean structure
Shaded Boxes Sweep zones extended into the future for monitoring
Faded Transparency Indicates mitigation or that the zone is cooling off
Every visual is tied to a logic branch in the code — nothing is decorative. Each shape or line has meaning tied to price behavior.
⸻
📊 Inputs & Settings Explained
Setting Description
Swings (len) Sets the pivot lookback range. Higher = fewer, stronger swing levels.
Options (opt) Controls what sweep types you want to see:
• Only Wicks → Focus on traps and fakeouts
• Only Outbreaks & Retest → Focus on confirmed moves
• Wicks + Outbreaks & Retest → See it all |
| Bull/Bear Colors | Customize how bullish vs. bearish sweeps are drawn |
| Extend Zones (extend) | When on, boxes stretch forward in time until price touches or invalidates them |
| Max Bars (maxB) | Sets how long (in bars) sweep zones will stay active before expiring |
⸻
🧠 How to Read It in Live Markets
Liquidity Scope doesn’t tell you what to do — it tells you what the market just did in relation to liquidity and structure.
Here’s how to use it:
• Green Zones (Bullish Sweeps):
Price just grabbed liquidity under a low. Watch for:
• A bounce → potential reversal
• A retest → possible long entry confirmation
• Red Zones (Bearish Sweeps):
Price swept above a high. Watch for:
• Immediate rejection → potential short zone
• Pullback and retest → trend continuation trap or fake breakout
• Wick Sweeps Only:
Often seen in range-bound markets or when market makers are testing stops.
• Retest Sweeps:
Often seen in trending markets, validating breakouts or signaling exhaustion.
⸻
🧪 Optional Use Cases & Strategy Tips
Here’s how traders on the EdgeXplorer platform use Liquidity Scope:
• 🔄 Smart Money Concepts: Use sweep zones alongside order blocks, FVGs, and breakers to confirm institutional movement.
• ⚠️ Trap Zones: Spot liquidity fakeouts where retail might be chasing early breakouts.
• 🎯 Entry/Exit Filtering: Use zones to validate entries only when price reacts cleanly around them — or exits when mitigation completes.
• 🧠 Confluence Layer: Combine with trend indicators or volume to add strength to directional bias.
⸻
🔒 Final Note on Use & Compliance
Liquidity Scope is a market behavior visualizer, not a signal generator. It helps you understand where the market might be trapping liquidity, but you are the strategy. Always pair with proper confirmation, risk management, and your own discretion.
All logic, structure, and assets in this script are © protected under ETAPX Inc. and the EdgeXplorer platform. Unauthorized sharing or monetization of this code is prohibited under company and platform policy.
Chart patterns

Daily High-Low RangeThis Pine Script calculates the daily range (High - Low) for each trading day to measure intraday volatility.
The orange line shows the actual daily high-low range.
The purple line represents the 10-day simple moving average of the daily range, smoothing out fluctuations for trend observation.
This indicator helps identify whether intraday volatility is increasing or decreasing over time and can be used to assess market momentum or risk.
이 Pine Script는 각 거래일의 고가와 저가의 차이 (일중 변동폭)을 계산하여 일중 변동성을 시각화합니다.
주황색 선은 매일의 고가-저가 범위를 나타냅니다.
보라색 선은 일중 변동폭의 10일 단순 이동평균(SMA)으로, 변동성의 추세를 부드럽게 보여줍니다.
이 지표를 통해 최근 시장의 변동성이 커지고 있는지 줄어들고 있는지를 파악할 수 있으며, 시장 리스크 또는 모멘텀 판단에 활용될 수 있습니다.

Price Deviation from MA5 (%)This Pine Script calculates and visualizes the percentage deviation of the current price from the 5-day simple moving average (SMA5).
The blue line represents the daily deviation (%) from the 5-day moving average.
The orange line shows the 10-day average of the deviation, providing a smoother trendline for volatility analysis.
A gray baseline at 0% helps identify whether the price is trading above or below the SMA5.
This indicator is helpful for identifying short-term overbought or oversold conditions and tracking intraday volatility behavior.
이 Pine Script는 현재 종가가 5일 이동평균선(MA5)으로부터 얼마나 떨어져 있는지(이격률, %)를 계산하고 시각화합니다.
파란색 선은 매일의 이격률(%)을 나타냅니다.
주황색 선은 이격률의 10일 평균값으로, 보다 부드러운 추세선을 제공합니다.
**0% 기준선(회색)**을 통해 현재 가격이 MA5 위에 있는지 아래에 있는지를 한눈에 파악할 수 있습니다.
이 지표는 단기 과열/과매도 구간을 파악하거나, 일중 변동성의 흐름을 분석할 때 유용합니다.

Custom Median MAThe 50-day moving average (50-DMA) is a popular technical analysis indicator used to identify the intermediate-term trend of a financial asset. It is calculated by averaging the closing prices of the asset over the past 50 trading days. As a lagging indicator, it smooths out price fluctuations and helps traders and investors identify potential support and resistance levels.
When the price is consistently above the 50-DMA, it often signals an uptrend or bullish market sentiment. Conversely, if the price remains below the 50-DMA, it may indicate a downtrend or bearish sentiment. Crossovers involving the 50-DMA are also closely watched. For instance, a "golden cross" occurs when a shorter-term moving average (e.g., 20-day) crosses above the 50-DMA, suggesting potential upward momentum. A "death cross" is the opposite and can signal a downward trend.
The 50-DMA is widely used because it strikes a balance between short-term sensitivity and long-term stability. It is applicable across various markets and timeframes, including stocks, indices, and cryptocurrencies.


5/21 EMA Crossover AlertThis is a basic indicator which shows when the 5 EMA crosses through the 21 indicating a possible buy or sell signal. remember, this is only an indicator—indicators indicate and the mroe indicators you have, the more confirmation you may find...all to say, don't just rely on any one "holy grail" indicator.

Zen Open - 18 Bar v2Zen Open – 18 Bar Box (RTH Study Tool)
📄 Description:
This script highlights the first 18 bars of each Regular Trading Hours (RTH) session with a visual box and optional range label. It is intended as a study aid for traders analyzing early session structure.
Features:
• Draws a box around the first 18 bars of the RTH session
• Displays the total range as a label (optional)
• Fully customizable box color and transparency
Intended Use:
This is an educational and visual analysis tool to help traders research how the RTH open influences the rest of the session.
Tight opening range may suggest range expansion
Wide opening range may indicate reduced movement or reversal risk
This script does not generate trading signals, does not offer financial advice, and does not promote any service. It is provided for discretionary study and chart analysis only.

EMA TableSimple price vs. EMA state table describing where price resides relative to the 20, 50, 100, 200 EMA bands

Gaussian Volatility Adjusted Key Features:Gaussian Smoothing: Applies a Gaussian filter to smooth price data (based on EMA or raw close prices), reducing noise while preserving trend information.
Volatility Adjustment: Uses ATR and standard deviation to create dynamic upper and lower bands around the smoothed price, adapting to market volatility.
Trend Detection: Identifies bullish (price above lower band) or bearish (price below upper band) trends, with additional confirmation using standard deviation thresholds.
Momentum Analysis: Measures momentum by calculating the price difference from key levels (upper band for bullish, Gaussian + standard deviation for bearish).
EMA Confluence: Optionally integrates an EMA of the momentum difference to confirm trend signals, enhancing accuracy.
Visual Output: Plots a zero line and an EMA line colored green (bullish) or red (bearish), with bar coloring to visually indicate trend direction.


Rubab's Buy/Sell + Reversal SignalThis indicstor helps to identify the reversal and provides entry exit signal.

The Strat Entry Indicator [1/5/15 Min]The Strat 1,5 and 15 minute. This indicator is to give entries on the 1, 5 and 15 minute time frames

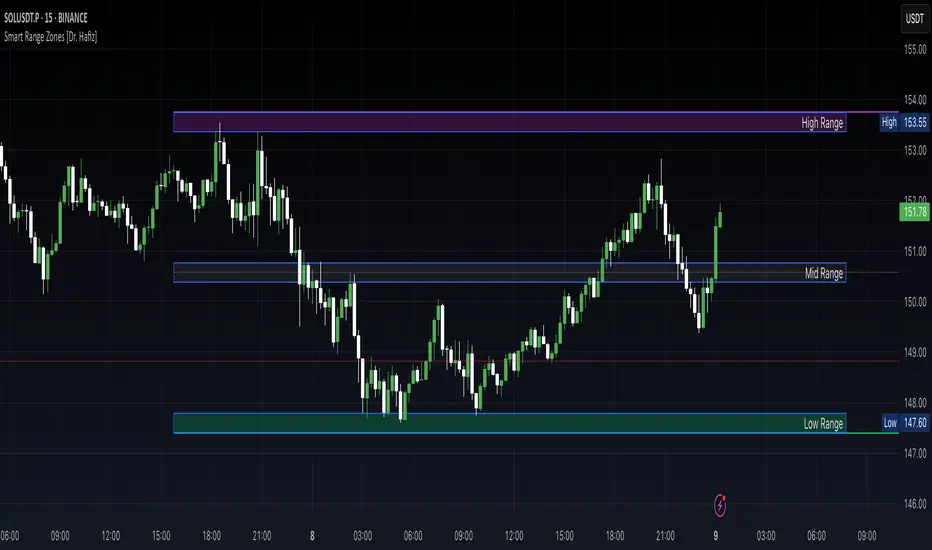
Smart Range Zones [Dr. Hafiz]Smart Range Zones
Description:
This indicator highlights key market zones — High Range, Mid Range, and Low Range — to help traders visually understand dynamic support and resistance levels.
✅ High Range: Potential supply/resistance area
✅ Mid Range: Fair value or equilibrium zone
✅ Low Range: Potential demand/support area
The zones are calculated based on the highest and lowest price over a user-defined period (default: 130 bars) and dynamically projected forward.
🔸 EMA 15 Line is included as an optional trend filter — helping confirm direction or trend alignment.
🔧 Features:
Auto-calculated High/Mid/Low zones
Real-time dynamic projections
Right-aligned zone labels inside each box
Clean visual structure
Toggle for showing/hiding EMA 15
📌 Best suited for:
Intraday & swing traders
Range breakouts and rejections
Trend confirmation with EMA
Created and published by Dr. Hafiz, modified under the MPL 2.0 license.
סשנים TARgive you al the sessions times in eazy way to see them very clean very helpful such a great indicator to start the life with it

Breaker BlockA brand new script that correctly displays the current breaker block in play but also shows the previous 2 breaker blocks for both bullish and bearish scenarios.
This greatly improves my previous code that was used for Unicorn setups, I was not happy with the logic around the production of the breaker blocks.
A new Unicorn version will be published using this new logic soon.

Padre's FVG (Dynamic + Fill Shrink)a dynamic FVG fill up. Marks out FVGs and shrinks them as the gap is filled.

ICT Killzones & Pivots [TFO]Italian time: Traccia dei box per le tre time zone principali: Asia, Europa e America

Previous Hour High/Low + Current Hour OpenPlots the previous hour high and low, as well as the current hour open

PRO-ZLMA RSI MACD [XAUUSD]Effective Scalping Strategy for XAUUSDStrategy LogicZLMA to catch reversals early but smoothlyEMA 200 as a trend filter (confirms Long/Short more accurately)RSI filters overbought/oversold price areasMACD confirms momentumoptimize and analyze your indicator strategy — aiming for the highest profits across various time frames (1M, 5M, 30M, 1H, 4H, 1D) when trading XAU/USD:

FVG + RSI Sweep M15FVG + RSI Sweep M15 – Smart Liquidity Trading Indicator
This indicator is designed for high-probability intraday trading, optimized for the 15-minute timeframe (M15). It combines:
Fair Value Gap (FVG) detection – reveals price imbalance zones
RSI reversal signals – identifies overbought/oversold exhaustion
Liquidity sweep logic – confirms fakeouts beyond recent highs/lows
Time filter – focuses only on high-volume London & New York sessions
When all conditions align, it generates clean Buy/Sell signals, with automatic TP and SL levels based on risk–reward logic. Ideal for traders seeking 1–2 precise trades per day with minimal noise.

Lum3n Trend CloudLum3n Trend Cloud
The Lum3n Trend Cloud is a lightweight, easy-to-read trend indicator that helps traders quickly identify bullish, bearish, or neutral conditions using two customizable EMAs (Exponential Moving Averages).
How It Works:
The indicator uses a short-term EMA and a long-term EMA to determine trend direction.
A bullish trend is confirmed when:
Price is above both EMAs
The short-term EMA is above the long-term EMA
A bearish trend is confirmed when:
Price is below both EMAs
The short-term EMA is below the long-term EMA
All other cases are considered neutral or consolidating.
Visual Features:
Candle Color:
🟢 Lime = Bullish
🔴 Red = Bearish
🟠 Orange = Neutral
Trend Cloud Fill:
A color-coded band fills the space between the EMAs:
Green when bullish
Red when bearish
Orange when neutral
EMAs:
Green = Short-term EMA
Red = Long-term EMA
How to Use It:
Use trend direction for trade confirmation or directional bias.
Combine with price action, support/resistance, or volume for entries.
Neutral zones may signal consolidation, transitions, or chop — avoid overtrading here.
Inputs:
Short-Term EMA Length (default: 8)
Long-Term EMA Length (default: 21)

Price Action Breakout – CALL/PUT AlertsThis strategy generates CALL or PUT alerts based on price breakouts confirmed by EMA and volume filters.
🔍 Breakout Logic
📈 CALL Alert (Bullish Breakout):
Price closes above EMA
Price breaks above previous high
Volume is above average × multiplier
📉 PUT Alert (Bearish Breakout):
Price closes below EMA
Price breaks below previous low
Volume is above average × multiplier
🎯 Alert Structure
CALL 📈 / PUT 📉
Entry Price
Take Profit (TP) – Based on risk/reward ratio
Stop Loss (SL) – Based on percentage distance from entry
📊 Chart Elements
Labels on breakout candle with full alert info
Horizontal lines for TP and SL levels
Works on any timeframe (e.g., 15min for intraday)
✅ Use Case
Ideal for options traders, scalpers, and automated alerts

TWI Jedi Order Block TrackerJedi script helps you find perfect entry
use chart pattern and price action
