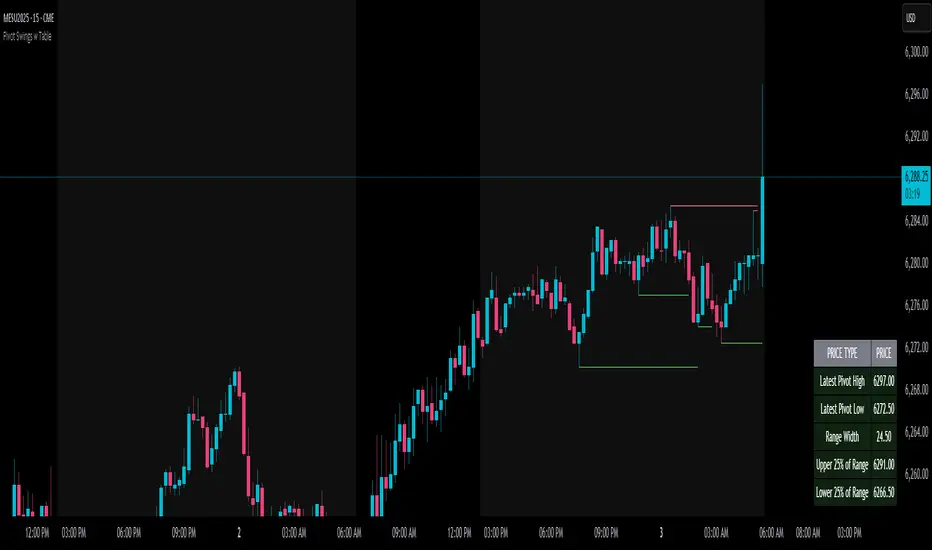
Pivot Swings w Table Pivot Swings w Table — Intraday Structure & Range Analyzer
This indicator identifies key pivot highs and lows on the chart and highlights market structure shifts using a real-time table display. It helps traders visually confirm potential trade setups by tracking unbroken swing points and measuring the range between the most recent pivots.
🔍 Features:
🔹 Automatic Pivot Detection using configurable left/right bar logic.
🔹 Unbroken Pivot Filtering — only pivots that haven't been invalidated by price are displayed.
🔹 Dynamic Range Table with:
Latest valid Pivot High and Pivot Low
Total Range Width
Upper & Lower 25% range thresholds (useful for value/imbalance analysis)
🔹 Trend-Based Color Coding — the table background changes based on which pivot (high or low) occurred more recently:
🟥 Red: Downward bias (last pivot was a lower high)
🟩 Green: Upward bias (last pivot was a higher low)
🔹 Optional extension of pivot levels to the right of the chart for support/resistance confluence.
⚙️ How to Use:
Adjust the Left Bars and Right Bars inputs to fine-tune how swings are defined.
Look for price reacting near the Upper or Lower 25% zones to anticipate mean reversion or breakout setups.
Use the trend color of the table to confirm directional bias, especially useful during consolidation or retracement periods.
💡 Best For:
Intraday or short-term swing traders
Traders who use market structure, support/resistance, or trend-based strategies
Those looking to avoid low-quality trades in tight ranges
✅ Built for overlay use on price charts
📈 Works on all symbols and timeframes
🧠 No repainting — pivots are confirmed with completed bars
Chart patterns
Avg High/Low Lines with TP & SL아래 코드는 TradingView Pine Script v6으로 작성된 스크립트로, 주어진 캔들 수 동안의 평균 고가와 저가를 계산해서 그 위에 수평선을 그리며, 해당 수평선 돌파 시 진입 가격을 기록하고, 손절가(SL)와 목표가(TP)를 자동으로 계산하여 표시하는 전략입니다. 알림(alert) 기능도 포함되어 있습니다.
코드 주요 기능 요약
length 기간 동안 평균 고가, 저가를 단순 이동평균(SMA)으로 계산
평균 고가선, 저가선 수평선을 일정 바 개수만큼 좌우 연장하여 차트에 표시
평균 고가 돌파 시 매수 진입, 평균 저가 돌파 시 매도 진입 처리
진입 가격 저장 및 상태 관리 (inLong, inShort 플래그)
손절가(SL): 롱이면 평균 저가, 숏이면 평균 고가
목표가(TP): 진입가에서 손절 거리의 1.5배만큼 설정
진입가 기준으로 TP, SL 라인과 라벨 표시
상단 돌파 후 종가 마감 시 매수 알림, 하단 돌파 후 종가 마감 시 매도 알림
Sure! Here’s the English explanation of your TradingView Pine Script v6 code:
Summary of Key Features
Calculates the simple moving average (SMA) of the high and low prices over a user-defined number of candles (length).
Draws horizontal lines for the average high and average low, extending them a specified number of bars to the left and right on the chart.
Detects breakouts above the average high to trigger a long entry, and breakouts below the average low to trigger a short entry.
Records the entry price and manages trade states using flags (inLong, inShort).
Sets the stop loss (SL) at the average low for long positions, and at the average high for short positions.
Calculates the take profit (TP) level based on the entry price plus 1.5 times the stop loss distance.
Draws lines and labels for the TP and SL levels starting from the entry bar, extended to the right.
Sends alerts when the price closes above the average high after a breakout (long signal), or closes below the average low after a breakout (short signal).
-onestar-

Khalid's Custom ForecastThe indicator printed on the chart is as expected beads on the information for last 5 years , this indicator could be linked to others to give future price actions

Simple Volume Profile with POC, VAH, VAL + nPOCVRVP by Kolesnik
This indicator halp you with analitick

EMA 21, 55, 200 with Small LabelsThis is a combination of ema21/50/200. Helps to identify market trends. It comes with small labels so it won't confuse which line is which. I hope it helps and good luck with your trading!

Price Change Rate with Pivot Labels (%)Bull/Bear labels to show the exact price change percentage at the pivot.
1. Calculates Price Change %
Measures the percentage change in closing price over a user-defined number of bars.
2. Identifies Pivot Points
Finds local highs (pivot highs) and lows (pivot lows) using configurable left/right bar settings.
3. Labels Bullish/Bearish Trends
Bull label: Appears at pivot lows if price is rising and forming higher lows.
Bear label: Appears at pivot highs if price is falling and forming lower highs.
4. Displays % on Labels
Each label includes the current price change percentage, e.g.,
"Bull +2.34%"
"Bear -1.78%"
5. Optional Visuals
Pivot shapes (triangles) are plotted for clarity.


Indicador Strong Buy + Volume
Association of several bullish indicators with a trigger on a sudden increase in volume

All SMAs Bullish/Bearish Screener (Visually Enhanced)Title: All SMAs Bullish/Bearish Screener Enhanced: Uncover Elite Trend Opportunities with Confidence & Clarity
Description:
Are you striving to master the art of trend-following, but often find yourself overwhelmed by market noise and ambiguous signals? Do you yearn for a trading edge that clearly identifies high-conviction opportunities and equips you with robust risk management principles? Look no further. The "All SMAs Bullish/Bearish Screener Enhanced" is your ultimate solution – a meticulously crafted Pine Script indicator designed to cut through the clutter, pinpointing stocks where the trend is undeniably strong, and providing you with the clarity you need to trade with confidence.
The Pinnacle of Confluence: Beyond Simple Averages
This is not just another moving average indicator. This is a sophisticated, multi-layered analytical engine built on the profound principle of Confluence. While our core strength lies in tracking a comprehensive suite of six critical Simple Moving Averages (5, 10, 20, 50, 100, and 200-period SMAs), this Enhanced version elevates signal reliability by integrating powerful, independent confirmation layers:
Momentum (Rate of Change - ROC): A true trend isn't just about direction; it's about the force and persistence of price movement. The Momentum filter ensures that the trend is backed by accelerating buying (for bullish signals) or selling (for bearish signals) pressure, validating its underlying strength.
Volume Confirmation: Smart money always leaves a trail. Significant price moves, especially trend continuations or reversals, demand genuine participation. This enhancement confirms that the "All SMAs" alignment is accompanied by above-average volume, signaling institutional conviction and differentiating authentic moves from mere whipsaws.
Relative Strength Index (RSI) Bias: The RSI helps gauge the health of the trend. For a bullish signal, we confirm RSI maintains a bullish bias (above 50), while for a bearish signal, we look for a bearish bias (below 50). This adds another layer of qualitative validation, ensuring the trend isn't overextended without confirmation.
When a stock's price is trading above ALL six critical SMAs, and is simultaneously confirmed by strong positive Momentum, robust Volume, and a bullish RSI bias, you are witnessing a powerful "STRONGLY BULLISH" signal. This rare alignment often precedes sustained upward moves and signifies a prime accumulation phase across all time horizons. Conversely, a "STRONGLY BEARISH" signal, where price is below ALL SMAs with compelling negative Momentum, validating Volume, and a bearish RSI bias, indicates significant distribution and potential for substantial downside.
Seamless Usage & Unmatched Visual Clarity:
Adding this script to your TradingView chart is simple, and its visual design has been meticulously optimized for maximum readability:
Easy Integration: Paste the script into your Pine Editor and click "Add to Chart."
Full Customization: All SMA lengths, RSI periods, Volume SMA periods, and Momentum periods are easily adjustable via user-friendly input settings, allowing you to fine-tune the strategy to your precise preferences.
Optimal Timeframes:
For identifying robust, actionable trends for swing and position trading, Daily (1D) and 4-Hour (240 min) timeframes are highly recommended. These capture significant market movements with reduced noise.
While the script functions on shorter timeframes (e.g., 15min, 60min), these are best reserved for highly active day traders seeking precise entry triggers within broader trends, as shorter timeframes are prone to increased volatility and noise.
Important Note on Candle Size: The width of candles on your chart is controlled by TradingView's platform settings and your zoom level, not directly by Pine Script. To make candles appear larger, simply zoom in horizontally on your chart or adjust the "Bar Spacing" in your Chart Settings (Right-click chart > Settings > Symbol Tab).
Crystal-Clear Visual Signals:
Subtle Background Hues: The chart background will subtly tint lime green for "STRONGLY BULLISH" and red for "STRONGLY BEARISH" conditions. This transparency ensures your underlying candles remain perfectly visible.
Distinct Moving Averages: SMAs are plotted with increased line thickness and a carefully chosen color palette for easy identification.
Precise Signal Triangles: Small, clean green triangles below the bar signify "STRONGLY BULLISH," while small red triangles above the bar mark "STRONGLY BEARISH" conditions. These are unobtrusive yet clear.
Dedicated Indicator Panes: RSI and Momentum plots, along with their key levels, now appear in their own separate, clean sub-panes below the main price chart, preventing clutter and allowing for focused analysis.
On-Chart Status Table: A prominent table in your chosen corner of the chart provides an immediate, plain-language update on the current trend status.
Real-Time Screener Power (via TradingView Alerts): This is your ultimate automation tool. Set up custom alerts for "Confirmed Bullish Trade" or "Confirmed Bearish Trade" conditions. Receive instant notifications (email, app, webhook) for any stock in your watchlist that meets these stringent, high-conviction criteria, allowing you to react swiftly to premium setups across the market without constant chart monitoring.
Mastering Risk & Rewards: The Trader's Edge
Finding a signal is only the first step. This script helps you trade intelligently by guiding your risk management:
Strategic Stop-Loss Placement: Your stop-loss is your capital protector. For a "STRONGLY BULLISH" trade, place it just below the most recent significant swing low (higher low). This is where the uptrend's structure is invalidated. For "STRONGLY BEARISH" trades, place it just above the most recent significant swing high (lower high). As an alternative, consider placing your stop just outside the 20-period SMA; a close beyond this mid-term average often signals a crucial shift. Always ensure your chosen stop-loss aligns with your strict risk-per-trade rules (e.g., risking no more than 1-2% of your capital per trade).
Disciplined Profit Booking: Don't just let winners turn into losers. Employ a strategy to capture gains:
Trailing Stop-Loss: As your trade moves into profit, dynamically move your stop-loss upwards (for longs) or downwards (for shorts). You can trail it by following subsequent swing lows/highs or by using a faster Moving Average like the 10 or 20-period SMA as a dynamic exit point if price closes beyond it. This allows you to ride extended trends while protecting accumulated gains.
Target Levels: Identify potential profit targets using traditional support/resistance levels, pivot points, or Fibonacci extensions. Consider taking partial profits at these key junctures to secure gains while letting a portion of your position run.
Loss of Confluence: A unique exit signal for this script is the breakdown of the "STRONGLY BULLISH" or "STRONGLY BEARISH" confluence itself. If the confirmation layers or even a few of the core SMAs are no longer aligned, it might be time to re-evaluate or exit, even if your hard stop hasn't been hit.
The "All SMAs Bullish/Bearish Screener Enhanced" is more than just code; it's a philosophy for disciplined trend trading. By combining comprehensive multi-factor confluence with intuitive visuals and robust risk management principles, you're equipped to make smarter, higher-conviction trading decisions. Add it to your favorites today and transform your approach to the markets!
#PineScript #TradingView #SMA #MovingAverage #TrendFollowing #StockScreener #TechnicalAnalysis #Bullish #Bearish #MarketScanner #Momentum #Volume #RSI #Confluence #TradingStrategy #Enhanced #Signals #Analysis #DayTrading #SwingTrading

All SMAs Bullish/Bearish Screener (Enhanced)All SMAs Bullish/Bearish Screener Enhanced: Uncover High-Conviction Trend Alignments with Confidence
Description:
Are you ready to elevate your trading from mere guesswork to precise, data-driven decisions? The "All SMAs Bullish/Bearish Screener Enhanced" is not just another indicator; it's a sophisticated, yet user-friendly, trend-following powerhouse designed to cut through market noise and pinpoint high-probability trading opportunities. Built on the foundational strength of comprehensive Moving Average confluence and fortified with critical confirmation signals from Momentum, Volume, and Relative Strength, this script empowers you to identify truly robust trends and manage your trades with unparalleled clarity.
The Power of Multi-Factor Confluence: Beyond Simple Averages
In the unpredictable world of financial markets, true strength or weakness is rarely an isolated event. It's the harmonious alignment of multiple technical factors that signals a high-conviction move. While our original "All SMAs Bullish/Bearish Screener" intelligently identified stocks where price was consistently above or below a full spectrum of Simple Moving Averages (5, 10, 20, 50, 100, 200), this Enhanced version takes it a crucial step further.
We've integrated a powerful three-pronged confirmation system to filter out weaker signals and highlight only the most compelling setups:
Momentum (Rate of Change - ROC): A strong trend isn't just about price direction; it's about the speed and intensity of that movement. Positive momentum confirms that buyers are still aggressively pushing price higher (for bullish signals), while negative momentum validates selling pressure (for bearish signals).
Volume: No trend is truly trustworthy without the backing of smart money. Above-average volume accompanying an "All SMAs" alignment signifies strong institutional participation and conviction behind the move. It separates genuine trend starts from speculative whims.
Relative Strength Index (RSI): This versatile oscillator ensures the trend isn't just "there," but that it's developing healthily. We use RSI to confirm a bullish bias (above 50) or a bearish bias (below 50), adding another layer of confidence to the direction.
When the price aligns above ALL six critical SMAs, and is simultaneously confirmed by robust positive momentum, healthy volume, and a bullish RSI bias, you have an exceptionally strong "STRONGLY BULLISH" signal. This confluence often precedes sustained upward moves, signaling prime accumulation phases. Conversely, a "STRONGLY BEARISH" signal, where price is below ALL SMAs with negative momentum, confirming volume, and a bearish RSI bias, indicates powerful distribution and potential for significant downside.
How to Use This Enhanced Screener:
Add to Chart: Go to TradingView's Pine Editor, paste the script, and click "Add to Chart."
Customize Parameters: Fine-tune the lengths of your SMAs, RSI, Momentum, and Volume averages via the indicator's settings. Experiment to find what best suits your trading style and the assets you trade.
Choose Your Timeframe Wisely:
Daily (1D) and 4-Hour (240 min) are highly recommended. These timeframes cut through intraday noise and provide more reliable, actionable signals for swing and position trading.
Shorter timeframes (e.g., 15min, 60min) can be used by advanced day traders for very short-term entries, but be aware of increased volatility and noise.
Visual Confirmation:
Green/Red Triangles: Appear on your chart, indicating confirmed bullish or bearish signals.
Background Color: The chart background will subtly turn lime green for "STRONGLY BULLISH" and red for "STRONGLY BEARISH" conditions.
On-Chart Status Table: A clear table displays the current signal status ("STRONGLY BULLISH/BEARISH," or "SMAs Mixed") for immediate feedback.
Set Up Alerts (Your Primary Screener Tool): This is the game-changer! Create custom alerts on TradingView based on the "Confirmed Bullish Trade" and "Confirmed Bearish Trade" conditions. Receive instant notifications (email, pop-up, mobile) for any stock in your watchlist that meets these stringent criteria. This allows you to scan the entire market effortlessly and act decisively.
Strategic Stop-Loss Placement: The Trader's Lifeline
Even the most robust signals can fail. Protecting your capital is paramount. For this trend-following strategy, your stop-loss should be placed where the underlying trend structure is broken.
For a "STRONGLY BULLISH" Trade: Place your stop-loss just below the most recent significant swing low (higher low). This is the last point where buyers stepped in to support the price. If price breaks below this, your bullish thesis is invalidated.
For a "STRONGLY BEARISH" Trade: Place your stop-loss just above the most recent significant swing high (lower high). If price breaks above this, your bearish thesis is invalidated.
Alternatively, consider placing your stop-loss just below the 20-period SMA (for bullish trades) or above the 20-period SMA (for bearish trades). A significant close beyond this intermediate-term average often indicates a critical shift in momentum. Always ensure your chosen stop-loss adheres to your pre-defined risk per trade (e.g., 1-2% of capital).
Disciplined Profit Booking: Maximizing Gains
Just as important as knowing when you're wrong is knowing when to take profits.
Trailing Stop-Loss: As your trade moves into profit, trail your stop-loss upwards (for longs) or downwards (for shorts). You can trail it using:
Previous Swing Lows/Highs: Move your stop to just below each new higher low (for longs) or just above each new lower high (for shorts).
A Moving Average (e.g., 10-period or 20-period SMA): If price closes below your chosen trailing SMA, exit. This allows you to ride the trend while protecting accumulated profits.
Target Levels: Identify potential resistance levels (for longs) or support levels (for shorts) using pivot points, previous highs/lows, or Fibonacci extensions. Consider taking partial profits at these levels and letting the rest run with a trailing stop.
Loss of Confluence: If the "STRONGLY BULLISH/BEARISH" condition ceases to be met (e.g., RSI crosses below 50, or volume drops significantly), this can be a signal to reduce or exit your position, even if your stop-loss hasn't been hit.
The "All SMAs Bullish/Bearish Screener Enhanced" is your comprehensive partner in navigating the markets. By combining robust trend identification with critical confirmation signals and disciplined risk management, you're equipped to make smarter, more confident trading decisions. Add it to your favorites and unlock a new level of precision in your trading journey!
#PineScript #TradingView #SMA #MovingAverage #TrendFollowing #StockScreener #TechnicalAnalysis #Bullish #Bearish #QQQ #Momentum #Volume #RSI #SPY #TradingStrategy #Enhanced #Signals #Analysis #DayTrading #SwingTrading

TSLA Reversal Alert: Harmonic + VWAP + RSI DivergenceWorking on a Bearish Harmonic Alert, and Bullish Harmonic Alert

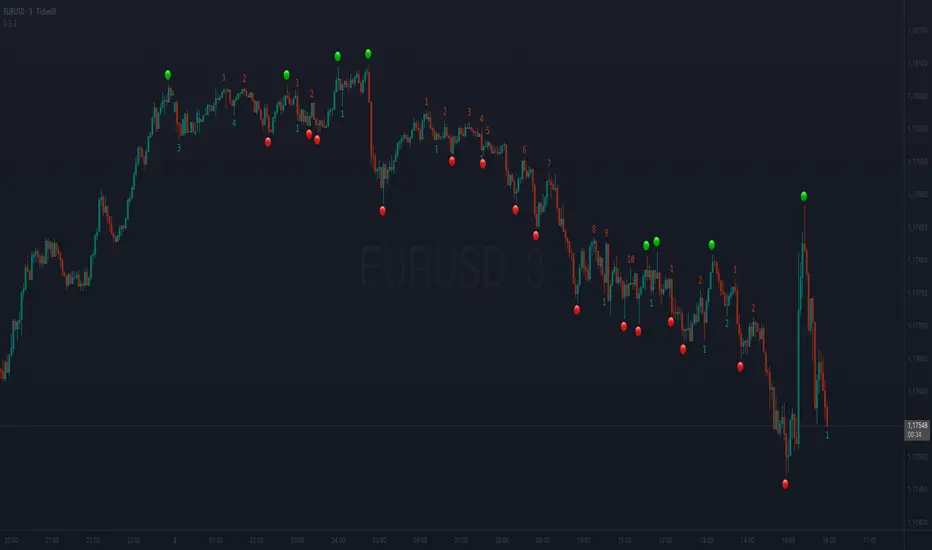
[eLm] 0-1-2# 📈 Market Structure Indicator – Counter System
This indicator dynamically analyzes price action to detect key market structure shifts and trend strength using four essential formations:
## 🔍 Detected Structures
- **Higher High (HH):** A candle forming a new high above recent peaks
- **Lower Low (LL):** A candle forming a new low below recent bottoms
- **Higher Low (HL):** A higher dip, indicating potential trend continuation
- **Lower High (LH):** A lower peak, signaling potential weakness
## 🧠 Structure Protection Logic
After a HH or LL is formed, if price does not breach that level within a user-defined number of candles, the level is considered **"protected."**
This provides insight into trend strength and market reaction.
## 🔢 HL / LH Counter System
- Each HL or LH increases a counter.
- A new HH or LL **resets** the corresponding counter to zero.
> This helps visualize how many consecutive HL or LH structures have occurred — useful for measuring trend momentum.
## 🎯 Use Cases
- Trend following and confirmation
- Early trend reversal detection
- Building structure-based trading strategies
- Understanding price behavior and market intent
---
> **Note:** This indicator does not provide financial advice. It is designed to support technical analysis with clear, structure-based visual signals.
Dual SMA/EMA Strategy with Alerts200 SMA 9/21 EMA with EMA Golden Crossover warning. Helps with detecting when a GoldenCross has been triggered.

تنبؤ حركة الشارت (حجم وخطوط اتجاه)A forecast for the movement of the prices is helpful to add to the peviouse indicator

AZ Dynamic Trend Indicator with Heikin-Ashi### Dynamic Trend Indicator with Heikin-Ashi (v2.7)
**Effortlessly identify trends and reversals** with this versatile tool combining multi-timeframe analysis, adaptive moving averages, and Heikin-Ashi smoothing. Here's what it offers:
#### 🔍 **Core Features**
1. **Dual Timeframe Analysis**:
- Track trends on higher timeframes (e.g., 1H/D) while viewing signals on your current chart.
- Toggle between **Heikin-Ashi** or standard candles for cleaner trend visualization.
2. **8 Customizable MAs**:
- Choose from **ALMA, HMA, SMA, SWMA, VWMA, WMA, ZLEMA, or EMA** with adjustable periods.
- Unique "Trend Strength" metric: `(MA_Close - MA_Open) / (MA_High - MA_Low)` highlights momentum direction.
3. **Smart Signals**:
- **Entry/Exit**: Triangles mark crossovers between MA Close/Open.
- **Reversal Alerts**: Detects counter-trend moves within a user-defined window (default: 3 bars) after signals.
- Color-coded plots: Bullish (🟢), Bearish (🔴), Reversal Bull (🔵), Reversal Bear (🟠).
#### 🎨 **Visual Customization**
- Toggle **High/Low MA lines**, **Close line**, and **fill colors**.
- Adjust colors for all elements to match your chart theme.
- Hide signals or reversal markers as needed.
#### ⚙️ **Practical Use**
- **Trend Following**: Use the MA Close/Open crossover with trend fill colors to confirm direction.
- **Reversal Trading**: Capitalize on pullbacks with reversal signals (e.g., after a bearish signal, watch for Bull Reversal markers).
- **Multi-Timeframe Confirmation**: Avoid false signals by aligning higher-timeframe trends with your entries.
*Ideal for swing traders and trend riders!*
**Note**: Adjust `MA Period`, `Reversal Window`, and `Trend Timeframe` for your strategy. Disable Heikin-Ashi in choppy markets for faster reactions.
---
*Code v2.7 updates: Optimized reversal logic, added ALMA/ZLEMA support, and enhanced visual controls.*


Overnight High/Low, Session High/LowGives you the following information:
- Previous session(s) high and low (up to 10)
- The current session overnight high and low
- The previous session open and close
When any prior day high or low is broken, the line for it will stop extending to the right.

Alt Market Index (Halving-Adjusted BTC Supply, EMA)
암호화폐 알트코인 시총 상위 125개를 모아서
나스닥 기반의 계산식을 활용한 알트코인지수125를 만들었습니다.
반감기에 따른 비트코인 하루 채굴량 갯수 추가까지 포함한 버전입니다.
일봉이 기준이 됩니다.
I created the Altcoin Index 125 by compiling the top 125 altcoins by market capitalization in the cryptocurrency market, using a calculation method based on the Nasdaq index.
This version also includes adjustments for Bitcoin’s halving events, reflecting changes in daily mining output. The index is based on daily candles.

Simple RSIThe Relative Strength Index (RSI) is a momentum oscillator that measures the speed and change of price movements. It helps traders identify overbought or oversold conditions in the market.
This script plots the 14-period RSI, which is one of the most commonly used settings.
How It Works:
The RSI ranges from 0 to 100.
Values above 70 suggest the asset may be overbought (a potential sell area).
Values below 30 suggest the asset may be oversold (a potential buy area).

Dynamic Sniper ProDynamic Sniper Pro - Binary Options Signal
Description:
Dynamic Sniper Pro is a powerful Pine Script v6 indicator designed for binary options trading. It combines Exponential Moving Averages (EMAs), Relative Strength Index (RSI), and an optional ATR filter to generate precise buy and sell signals. Ideal for short-term charts like 1-minute, this indicator helps traders spot trend reversals and breakouts with clear visual arrows. Tested on CAD/JPY, it recently delivered actionable signals during the morning session on July 01, 2025.
How It Works:
Buy Signal (Green Arrow): Triggered when the closing price exceeds both the 3-period Fast EMA and 8-period Slow EMA, RSI drops below the oversold level (default 40), and (if ATR filter is on) the price breaks above the Slow EMA + 0.15 * ATR. Enter a call option at the next candle open.
Sell Signal (Red Arrow): Triggered when the closing price falls below both EMAs, RSI rises above the overbought level (default 60), and (if ATR filter is on) the price breaks below the Slow EMA - 0.15 * ATR. Enter a put option at the next candle open.
Key Features:
Customizable parameters: Adjust EMA lengths, RSI periods, oversold/overbought levels, and ATR multiplier.
Optional ATR filter to reduce whipsaw entries.
Visual alerts with arrows and background highlights.
Compatible with any forex pair or timeframe—optimize for your strategy!
Settings:
Fast EMA Length: 3 (short-term trend)
Slow EMA Length: 8 (trend confirmation)
RSI Length: 14 (default smoothness)
Oversold Level: 40 (tweak for sensitivity)
Overbought Level: 60 (tweak for sensitivity)
Use ATR Filter: True (optional)
ATR Length: 14
ATR Multiplier: 0.3 (adjust for breakout strength)
Performance:
Backtesting on CAD/JPY 1-minute from 10:34–11:34 AM PDT on July 01, 2025, showed promising signal frequency. Results may vary—test on your preferred asset.
Tips:
Set alerts via the "Alerts" tab for real-time notifications.
Adjust oversold/overbought levels (e.g., 45/55) for fewer/more signals.
Best on volatile pairs like CAD/JPY or EUR/USD.
Disclaimer:
This indicator is for educational purposes only. Past performance is not indicative of future results. Use at your own risk, and consider market conditions and risk management.

LaCrazy Smash CandleLaCrazy Smash Candle highlights powerful engulfing candles that signal potential momentum reversals or breakout continuation.
Smash Long: The candle's low touches or dips below the prior candle's low, then closes above the previous high with a strong body (minimum % of the candle range).
Smash Short: The candle's high touches or exceeds the prior high, then closes below the previous low with a strong body.
These “Smash” moves often occur at key pivot points, signaling decisive rejections or trend continuation. Customize the body strength filter to match your strategy needs.

Avg 30-min High-Low Pips (Bar Chart)Analyses movements over 30 days and plots possible movement windows.
