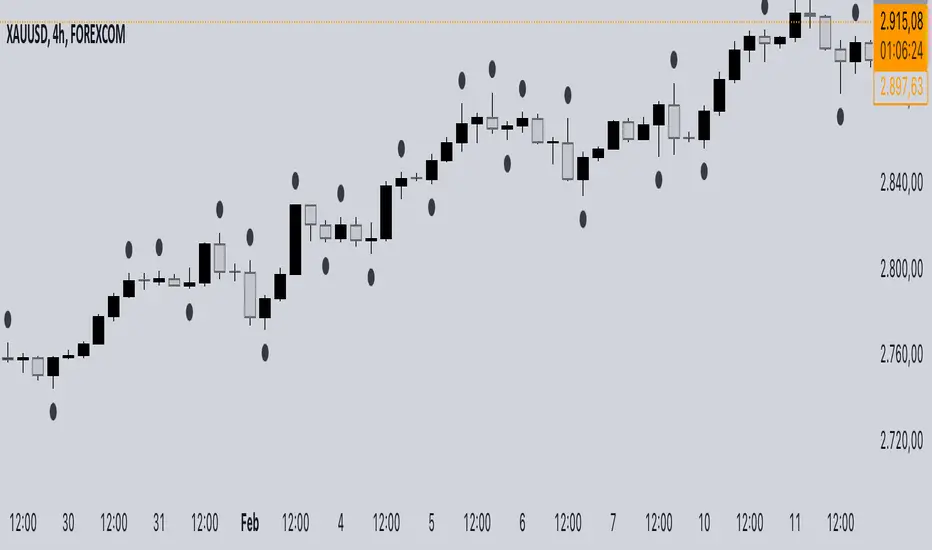
3cfThis indicator identifies and signals the points of swing highs and swing lows on the price chart using an algorithm based on market structure. Local highs and lows are highlighted with a colored dot, making it easier to perform technical analysis and recognize trend reversals.
The indicator analyzes a predefined number of bars (e.g., 5 candles) to determine relative highs and lows:
Swing High (Local High) → The current candle has a higher high compared to the previous and subsequent candle.
Swing Low (Local Low) → The current candle has a lower low compared to the previous and subsequent candle.
When a candle meets one of these conditions, a visual dot is placed to indicate the potential reversal point.
Chart patterns
Candle Range-BarsThe Candle Range Bars indicator visually represents the range of each candlestick in either pips or ticks, depending on your preference. It plots vertical bars to show the size of each candle, making it easy to identify periods of high or low volatility. The indicator also displays the exact range value (in pips or ticks) above each bar, with customizable text size and color for better readability.
Key Features
Pips or Ticks Mode:
Choose to display the candle range in pips (for forex traders) or ticks (for other instruments).
Customizable Text:
Adjust the text color and text size (Tiny, Small, Normal, Large) to suit your chart style.
Clear Visuals:
Bars are colored green for bullish candles and red for bearish candles, making it easy to distinguish between up and down moves.
Flexible Use:
Ideal for analyzing volatility, identifying consolidation zones, and comparing candle ranges across different timeframes.
How to Use:
Add the indicator to your chart.
Customize the settings:
Choose between pips or ticks.
Adjust the text color and text size for the range values.
Observe the bars and their corresponding range values to analyze market volatility.
Why Use This Indicator?:
Simplify Range Analysis: Quickly see the size of each candlestick without manual calculations.
Customizable: Tailor the appearance to match your trading style.
Versatile: Works on any instrument and timeframe.
Settings:
Show Pips (Otherwise Ticks): Toggle between pips and ticks mode.
Text Color: Choose the color of the range value text.
Text Size: Select the size of the range value text (Tiny, Small, Normal, Large).
Ideal For:
Forex, stocks, commodities, and crypto traders.
Traders who focus on volatility and range analysis.
Anyone looking for a clear and customizable way to visualize candle ranges.
This description highlights the key features, benefits, and usability of your indicator, making it appealing to other TradingView members. Let me know if you'd like to tweak it further! 😊

Electronic Trading Hours Session/CandlesThis indicator visually distinguishes the electronic trading session, spanning from the prior day's close (e.g., 5:00 PM EST) through the overnight period until the next day's opening bell (e.g., 9:30 AM EST).
It can be customized to highlight this period with a shaded zone or colored candles depending on the trader’s preference.
The overnight levels that create the opening range gap often act as critical zones of liquidity.
The indicator provides a clear visual cue of potential price magnets that smart money (institutional traders) may target during the opening bell session to trigger liquidity sweeps.

Trend CounterTREND COUNTER is a Trend Exhaustion Indicator that tracks the persistence of price movements over a series of bars, helping traders identify potential trend exhaustion and reversals.
It compares each bar's value (typically the closing price) to a previous bar from a set lookback period (the lookback bar), counting consecutive bullish or bearish price movements.
The count resets when the trend reverses, signaling a potential shift in momentum.
• Price movement is considered bullish if the current price exceeds the lookback bar's price, incrementing the bullish count with each consecutive occurrence.
• Price movement is considered bearish if the current price is lower than the lookback bar's price, incrementing the bearish count with each consecutive occurrence.
• The count resets when the trend reverses.
• The user sets the threshold for sequence resets by defining the maximum number of consecutive occurrences.
• The count may reset before a trend reversal if it surpasses the user-defined threshold.
This type of indicator is useful for detecting trends, trend exhaustion, overbought or oversold conditions, and potential reversal points, helping traders anticipate market turns.
• Sequential occurrences gauge trend strength.
A long sequence of bullish bars suggests strong upward momentum, while consecutive bearish bars indicate sustained downward pressure.
This helps traders assess whether a trend is likely to continue or weaken.
• Identify thresholds for potential reversal points.
Counting consecutive bullish or bearish price movements can highlight overextended trends.
A trend reaching a predefined threshold may signal an upcoming reversal or momentum slowdown.
• Identify potential entry or exit points.
If trends are showing signs of exhaustion after a certain number of consecutive price movements, traders may use this for timing adjustments to their position.
• Assess risk.
Understanding trend strength helps traders better adjust stop-loss or take-profit levels.
Sequential counting provides a structured approach to trade management.
Visualization & Customization
The Sequential Momentum indicator visually represents consecutive bullish or bearish price movements to define trends and highlight key shifts.
• The bullish/bearish bar sequences are based on user-defined thresholds.
• Customizable bar coloring, labels, and plot shapes enhanced trend visualization.
• Dynamic color transitions make trend shifts easily identifiable.
Tracking consecutive bullish or bearish price movements can be effective when combined with other indicators or applied in specific market conditions (e.g., trending or volatile markets).
However, its reliability depends on market conditions and the trader’s interpretation.
This indicator is best used as a complementary tool rather than a standalone signal, helping traders visualize and quantify market momentum within a broader strategy.
DCSessionStatsOHLC_v1.0DCSessionStatsOHLC_v1.0
© dc_77 | Pine Script™ v6 | Licensed under Mozilla Public License 2.0
This indicator overlays customizable session-based OHLC (Open, High, Low, Close) statistics on your TradingView chart. It tracks price action within user-defined sessions, calculates average manipulation and distribution levels based on historical data, and visually projects these levels with lines and labels. Additionally, it provides a session count table to monitor bullish and bearish sessions.
Key Features:
Session Customization: Define session time (e.g., "0000-1600") and time zone (e.g., UTC, America/New_York). Analyze up to 20 historical sessions.
Anchor Line: Displays a vertical line at session start with customizable style, color, and optional label.
Session Open Line: Plots a horizontal line at the session’s opening price with adjustable appearance and label.
Manipulation Levels: Calculates and projects average price extensions (high/low relative to open) for manipulative moves, shown as horizontal lines with labels.
Distribution Levels: Displays average price ranges (high/low beyond open) for distribution phases, with customizable lines and labels.
Visual Flexibility: Adjust line styles (solid, dashed, dotted), colors, widths, label sizes, and projection offsets (bars beyond session start).
Session Stats Table: Optional table showing counts of bullish (close > open) and bearish (close < open) sessions, with configurable position and size.
How It Works:
Tracks OHLC data within each session and identifies session start/end based on the specified time range.
Computes averages for manipulation (e.g., low below open in bullish sessions) and distribution (e.g., high above open) levels from past sessions.
Projects these levels forward as horizontal lines, extending them by a user-defined offset for easy reference.
Updates a table with real-time bullish/bearish session counts.
Use Case:
Ideal for traders analyzing intraday or custom session behavior, identifying key price levels, and gauging market sentiment over time.
Toggle individual elements on/off and fine-tune visuals to suit your trading style.

LineReg Candles with Hma filterOverview
Purpose:
The indicator creates “LinReg Candles” by recalculating OHLC values using linear regression (to smooth out noise) and overlays additional features such as a customizable signal line and an HMA (Hull Moving Average) filter for trend detection. It also plots buy/sell signals and supports alerts.
Customization:
Users can adjust settings for signal smoothing (choosing SMA, EMA, or WMA), HMA periods (preset for Scalping/Intraday or custom values), linear regression length, colors, display options, and alert messages. Inputs are organized into groups for clarity.
Input Definitions
Signal Settings:
signal_length and smoothingType define the period and method used to smooth the close price, creating a signal line.
HMA Filter Settings:
A dropdown (t_type) lets you choose between Scalping, Intraday, or Custom. Based on this, three HMA periods (hma1, hma2, hma3) are set either to fixed values or user-defined custom inputs.
LinReg Settings:
Users can toggle linear regression for OHLC values (lin_reg) and set its period (linreg_length) to reduce price noise.
Color and Display Settings:
These control the colors for buy/sell candles, default bullish/bearish candles, markers, and background highlighting. Display toggles decide whether to show the background, signal line, HMA filter, and the recalculated candles.
Alert and Plot Customization:
Alerts can be enabled with custom messages. Additionally, line width and transparency for the plotted signal and HMA lines are adjustable.
Function Definitions
calcOHLC Function:
Computes OHLC values using linear regression if enabled. Otherwise, it returns the raw price values. This helps in reducing noise.
calcSignalLine Function:
Applies the chosen moving average (SMA, EMA, or WMA) to smooth the recalculated close values and generate a signal line.
getBaseCandleColor Function:
Determines the candle’s base color. It assigns buy/sell colors if specific crossover conditions are met; if not, it defaults to bullish (green) or bearish (red) based on the open/close relationship.
HMA Filter Calculations
HMA Computation:
The script calculates three HMAs (ma1, ma2, ma3) for different periods.
Trend Determination:
It sets a bullish condition (bcn) when ma3 is lower than both ma1 and ma2 with ma1 above ma2. Conversely, a bearish condition (scn) is set when ma3 is higher and the order of the HMAs indicates a downtrend.
Color Coding:
The HMA filter line color changes dynamically (green for bullish, red for bearish) based on these conditions.
Main Calculations
LinReg Candles:
Using the calcOHLC function, the script calculates the new open, high, low, and close values that reduce price noise.
Signal Line:
The signal line is computed on the basis of the smoothed close values using the selected moving average.
Buy/Sell Conditions:
Initial conditions are determined by checking if the recalculated close price crosses over (buy) or under (sell) the signal line.
The base candle color is then adjusted: if the HMA filter confirms the trend (bullish for buy or bearish for sell), the respective buy/sell colors are enforced.
A change in candle color compared to the previous bar triggers a buy or sell signal.
Plotting and Alerts
Visual Elements:
Background: Highlights the chart with a custom color when buy or sell conditions are met.
HMA Filter Line: Plotted (if enabled) with the dynamic color determined earlier.
Candles: The recalculated LinReg candles are drawn with colors based on the combined conditions.
Signal Line: Plotted over the candles with adjustable transparency and width.
Markers: Buy and sell markers are added to visually indicate signal points on the chart.
Alerts:
Alert conditions are set to trigger with predefined messages when a buy or sell signal is generated.
Modularity & Flexibility:
The code is structured with modular functions and clear grouping of inputs, making it highly customizable and user-friendly for open-source TradingView users.
Important how to track the real price on chart:
Locate the Chart Type Menu:
At the top of your TradingView chart, you’ll see a button showing the current chart type (likely a candlestick icon).
Select “Line” from the Dropdown:
Click that button and choose “Line” in the dropdown menu. This changes the main chart to a line chart of the real price.
Screenshots:

Volatility-Driven CandleThis indicator identifies and highlights "volatility-driven candles" on a price chart, based on their body size relative to market volatility. It calculates the Average True Range (ATR) over a 14-period window to measure volatility. A candle is considered "volatility-driven" if its body (the difference between the close and open prices) exceeds a user-defined threshold, which is specified as a multiple of the ATR.
The script distinguishes between bullish and bearish volatility-driven candles:
Bullish volatility-driven candles (where the close is greater than the open) are marked with a blue label.
Bearish volatility-driven candles (where the close is less than the open) are marked with an orange label.
Additionally, the background color of the chart is shaded:
Blue for bullish volatility-driven candles.
Orange for bearish volatility-driven candles.
This script helps traders easily spot significant price movements relative to volatility, highlighting potential reversal points based on candle body size.

Market DNA: Structure, Volume, Range, and SessionsMarket DNA: Structure, Volume, Range, and Sessions**
The Market DNA indicator combines market structure, volume analysis, trading ranges, and global trading sessions into a single, comprehensive tool for traders. It helps identify key price levels, volume patterns, consolidation phases, and active market periods, enabling informed trading decisions.
Market Structure Detects swing highs and lows using `ta.pivothigh` and `ta.pivotlow`, plotting them as red/green triangles to highlight support/resistance and trend reversals.
- Fractal Volume Zones (FVG): Highlights areas of significant buying/selling pressure by comparing current volume to an average over a lookback period; high-volume zones are marked with a semi-transparent blue background.
- Trading Range: Defines a price channel using the Average True Range (ATR) and a multiplier, creating upper/lower bands to identify consolidation, breakouts, and potential trade levels.
- Market Sessions: Highlights major global trading sessions (Asia, Europe, US) with colored backgrounds (purple, teal, yellow) to indicate liquidity and volatility shifts.
How It Works
- Swing points help analyze trends and reversals.
- FVG confirms price movements with high volume for stronger signals.
- Trading range bands assist in identifying breakout opportunities and setting stops/take-profits.
- Session highlights allow traders to adapt strategies based on regional activity.
Customization
- Adjust `swing_length` for sensitivity in detecting turning points.
- Modify `volume_lookback` to control volume averaging.
- Tune `range_multiplier` for wider/narrower trading bands.
- Enable/disable session highlighting via `session_highlight`.
Use Cases
- Identify trends and key levels using swing points and FVG.
- Spot breakout opportunities with trading range bands.
- Adapt strategies to regional trading sessions for optimal timing.
This all-in-one indicator provides a clear, customizable view of the market, empowering traders to make data-driven decisions across asset classes and timeframes.

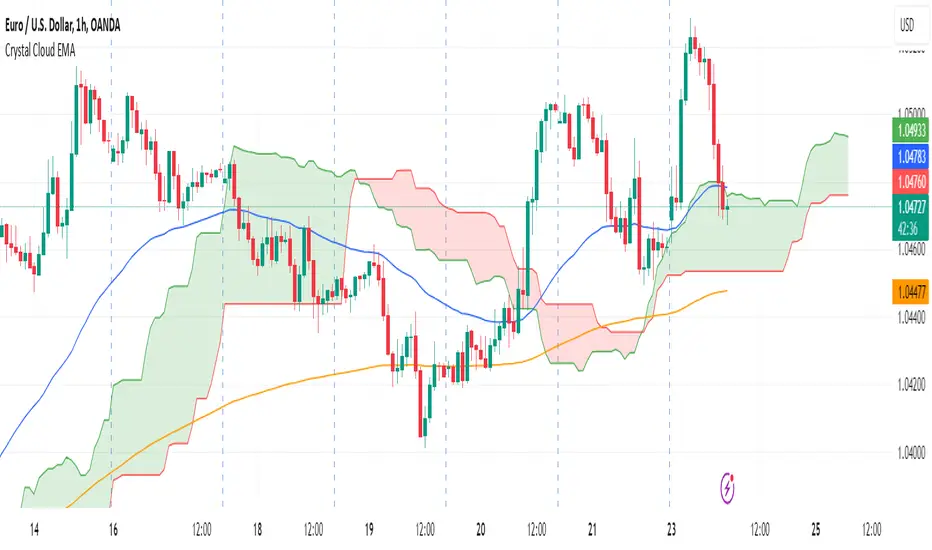
Crystal Cloud EMA# Crystal Cloud EMA Indicator 🚀
The **Crystal Cloud EMA Indicator** is a hybrid technical analysis tool that uniquely merges the multi-dimensional perspective of the Ichimoku Cloud with the precision of EMA crossovers (EMA 50 & EMA 200). This integration is designed to help traders identify key market trends, dynamic support and resistance zones, and potential momentum shifts with enhanced clarity and reliability.
---
## Key Components & Originality
### Ichimoku Cloud
- **Dynamic Support & Resistance:**
Utilizes standard Ichimoku calculations to form a cloud (Kumo) that highlights areas where price may find support or resistance.
- **Visual Clarity:**
The cloud’s upper and lower boundaries provide clear visual cues of market sentiment, helping to identify potential reversal or consolidation zones.
### EMA 50 & EMA 200
- **Trend Confirmation:**
These exponential moving averages smooth price data to reveal underlying trends.
- **Crossover Signals:**
A crossover of EMA 50 and EMA 200 is used as a signal confirmation—when EMA 50 crosses above EMA 200, it suggests a bullish trend; when it crosses below, it indicates a bearish trend.
### Unique Integration
- **Combined Analysis for Enhanced Accuracy:**
By fusing the Ichimoku Cloud’s dynamic support/resistance zones with the precise timing of EMA crossovers, the indicator minimizes false signals.
- **Confluence of Methods:**
Only when both the cloud position and EMA crossover align does the indicator generate a trading signal, offering a more robust framework than using either method in isolation.
---
## How It Works
1. **Cloud Evaluation:**
- The indicator calculates the Ichimoku Cloud using traditional parameters, establishing dynamic zones where price reactions are likely.
- It monitors how price interacts with these zones, signaling potential momentum shifts when the price moves in or out of the cloud.
2. **EMA Crossover Analysis:**
- Simultaneously, it computes EMA 50 and EMA 200.
- **Bullish Condition:** When price is above the cloud and EMA 50 crosses above EMA 200.
- **Bearish Condition:** When price is below the cloud and EMA 50 crosses below EMA 200.
3. **Signal Confirmation:**
- A breakout from the cloud, in conjunction with a crossover, further validates the strength of the trend.
- This dual confirmation approach filters out market noise and increases the reliability of the signals.
---
## Trading Strategy & Usage
### Buy Signal
- **Conditions:**
- Price is trading above the Ichimoku Cloud.
- EMA 50 crosses above EMA 200.
- A confirmed breakout above the cloud supports the bullish trend.
- **Application:**
- Enter long positions when these conditions align.
- Use the cloud’s lower boundary for potential stop-loss placement and set profit targets based on key resistance levels identified by the cloud.
### Sell Signal
- **Conditions:**
- Price is trading below the Ichimoku Cloud.
- EMA 50 crosses below EMA 200.
- A breakdown below the cloud reinforces the bearish trend.
- **Application:**
- Enter short positions under these conditions.
- Use the cloud’s upper boundary as a reference for setting stop-loss orders and profit targets.
### Best Timeframes & Trading Styles
- **Timeframes:**
Optimally used on M30 and higher timeframes to ensure trend reliability and reduce market noise.
- **Trading Styles:**
Suitable for swing trading, intraday trading, and momentum-based strategies.
- **Risk Management:**
Always complement indicator signals with additional analysis (like volume or price action) and apply proper risk management techniques.
---
## Important Note
This indicator is a **technical analysis tool** designed to assist traders in identifying market trends and potential reversal points. It should be used in conjunction with comprehensive market analysis and proper risk management. Trading decisions should not rely solely on this indicator.
Pre-London High-Low Breakout IndicatorOverview
The Pre-London High-Low Breakout Indicator helps traders identify breakout opportunities at the London session open. It marks the high and low one hour before London opens (5 PM - 6 PM AEST) and incorporates a 200 SMA filter to confirm trade direction. The indicator also provides real-time breakout markers for precise entries.
How the Indicator Works
1. Pre-London High & Low Identification (5 PM - 6 PM AEST)
The indicator tracks the highest and lowest price levels within this period.
These levels act as key breakout zones once London opens.
The high and low remain visible until 12 AM AEST for reference.
2. 200 SMA as a Trend Filter
A 200 SMA (yellow, thick line) is plotted to filter breakout trades.
Only long (buy) trades are valid if price is above the 200 SMA.
Only short (sell) trades are valid if price is below the 200 SMA.
3. Real-Time Breakout Confirmation
Buy Signal (Green Diamond):
Price breaks above the pre-London high.
Price is above the 200 SMA.
Sell Signal (Red Diamond):
Price breaks below the pre-London low.
Price is below the 200 SMA.
No signal appears if the breakout is against the SMA trend, reducing false trades.
How to Use the Indicator Properly
Step 1: Identify the Pre-London Range (5 PM - 6 PM AEST)
Observe price movements and note the session high & low.
Do not take trades within this period—wait for a clear breakout.
Step 2: Wait for a Breakout After 6 PM AEST
A breakout must occur beyond the session high or low.
The breakout should be clear and decisive, not hovering around the range.
Step 3: Confirm with the 200 SMA
If price is above the 200 SMA, only buy signals are valid.
If price is below the 200 SMA, only sell signals are valid.
If a breakout occurs against the SMA, ignore it.
Step 4: Enter the Trade and Manage Risk
Enter the trade after the breakout candle closes.
Set stop-loss just inside the pre-London range to minimize risk.
Take profit using a 1:2 or 1:3 risk-reward ratio, or trail the stop.
Why This Strategy Works
Pre-London Liquidity Grab: Institutional traders set positions before the London open, making this range significant.
Trend Confirmation with SMA: Reduces false breakouts by filtering trades in the direction of the trend.
Real-Time Breakout Detection: Green and red diamond markers highlight valid breakouts that meet all conditions.
Final Notes
If price breaks out but quickly reverses, it may be a false breakout—avoid impulsive trades.
The indicator works best when combined with other confluences such as volume analysis or key support/resistance levels.
Alerts can be added to notify traders when a valid breakout occurs.
This setup is ideal for traders looking for a structured, rule-based approach to trading London session breakouts with a strong trend confirmation mechanism.

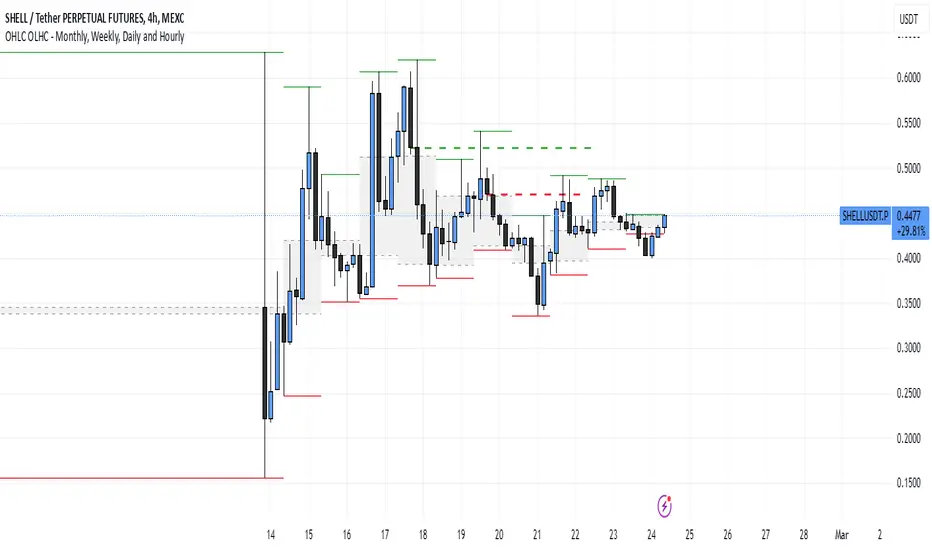
OHLC OLHC - Monthly, Weekly, Daily and HourlyThis indicator plots the previous day's (or any selected timeframe’s) Open, High, Low, and Close (OHLC) levels on the current chart. It helps traders analyze historical price levels to identify support and resistance zones.
Key Features:
Multi-Timeframe Support:
Users can select a timeframe (D, W, M, etc.) to fetch previous OHLC data.
The script requests OHLC values from the selected timeframe and overlays them on the current chart.
Customizable Display Options:
Users can choose to display only the last OHLC levels instead of all past session levels.
Users can extend the OHLC lines across the chart.
Background Highlighting:
The script fills the background only for the Previous Open and Previous Close levels, making them visually distinct.
Previous High and Low levels do not have background color.
This script is particularly useful for day traders and swing traders who rely on key price levels to make trading decisions. Let me know if you need further refinements!
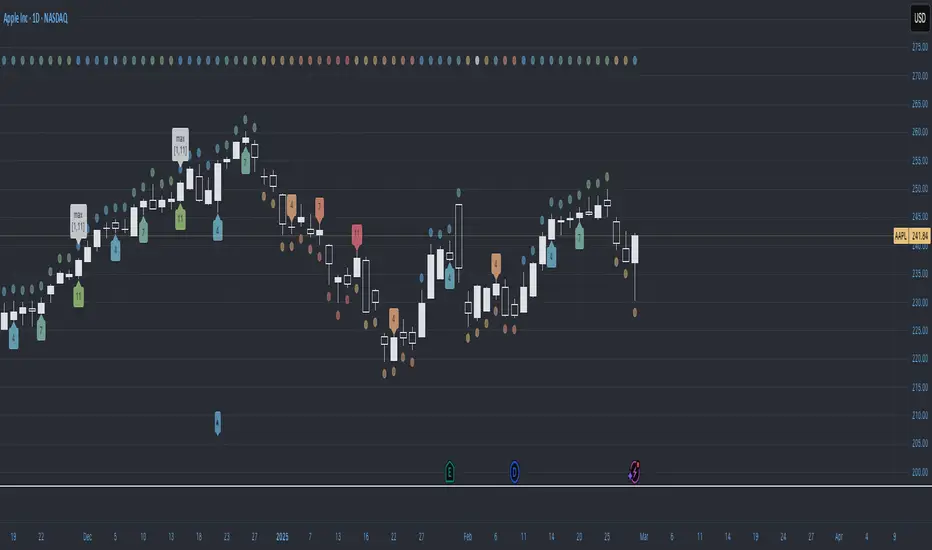
Combined Sequences (Tribonacci, Tetranacci, Lucas)🎯 Combined Sequences (Tribonacci, Tetranacci, Lucas) Indicator 🎯
Unlock the power of advanced mathematical sequences in your trading strategy with the **Combined Sequences Indicator**! This tool integrates **Tribonacci**, **Tetranacci**, and **Lucas** levels to help you identify key support and resistance zones with precision. Whether you're a day trader, swing trader, or long-term investor, this indicator provides a unique perspective on price action by combining multiple sequence-based levels.
---
### **Key Features:**
1. **Multiple Sequence Levels**:
- **Tribonacci Levels**: Based on the Tribonacci sequence, these levels are ideal for identifying dynamic support and resistance.
- **Tetranacci Levels**: A more advanced sequence that adds depth to your analysis.
- **Lucas Levels**: Derived from the Lucas sequence, these levels offer additional insights into market structure.
2. **Customizable Levels**:
- Choose the number of levels to display (up to 20).
- Toggle between **positive** and **negative** levels for each sequence.
3. **Flexible Price Source**:
- Select your preferred price type: **Open**, **High**, **Low**, **Close**, **HL2**, **HLC3**, or **HLCC4**.
4. **Customizable Line Styles**:
- Choose from **Solid**, **Dashed**, or **Dotted** lines.
- Adjust line width and extension type (**Left**, **Right**, or **Both**).
5. **Dynamic Labels**:
- Add labels to levels for better readability.
- Customize label position (**Left**, **Center**, or **Right**) and text size (**Normal**, **Small**, or **Tiny**).
6. **Timeframe Flexibility**:
- Works on any timeframe, from **1-minute** charts to **monthly** charts.
---
### **How It Works:**
- The indicator calculates **Tribonacci**, **Tetranacci**, and **Lucas** levels based on the selected price source and timeframe.
- These levels are plotted on the chart, providing clear visual cues for potential support and resistance zones.
- You can toggle each sequence on or off, allowing you to focus on the levels that matter most to your strategy.
---
### **Why Use This Indicator?**
- **Enhanced Market Analysis**: Combine multiple mathematical sequences to gain a deeper understanding of price action.
- **Customizable**: Tailor the indicator to your trading style with flexible settings.
- **User-Friendly**: Easy-to-use interface with clear visual outputs.
- **Versatile**: Suitable for all trading styles and instruments (stocks, forex, crypto, commodities, etc.).
---
### **How to Use:**
1. Add the indicator to your chart.
2. Configure the settings in the **Inputs** tab:
- Choose which sequences to display (Tribonacci, Tetranacci, Lucas).
- Adjust the number of levels, line styles, and label settings.
3. Use the levels to identify potential entry, exit, and stop-loss points.
---
### **Perfect For:**
- Traders looking for advanced support and resistance levels.
- Those who want to incorporate mathematical sequences into their analysis.
- Anyone seeking a customizable and versatile trading tool.
---
**🚀 Take Your Trading to the Next Level with Combined Sequences! 🚀**
---
### **Disclaimer**:
This indicator is a tool to assist in your trading decisions. It does not guarantee profits or predict market movements. Always use proper risk management and combine this tool with other analysis techniques.
---
**📈 Ready to Elevate Your Trading? Add the Combined Sequences Indicator to Your Chart Today! 📉**

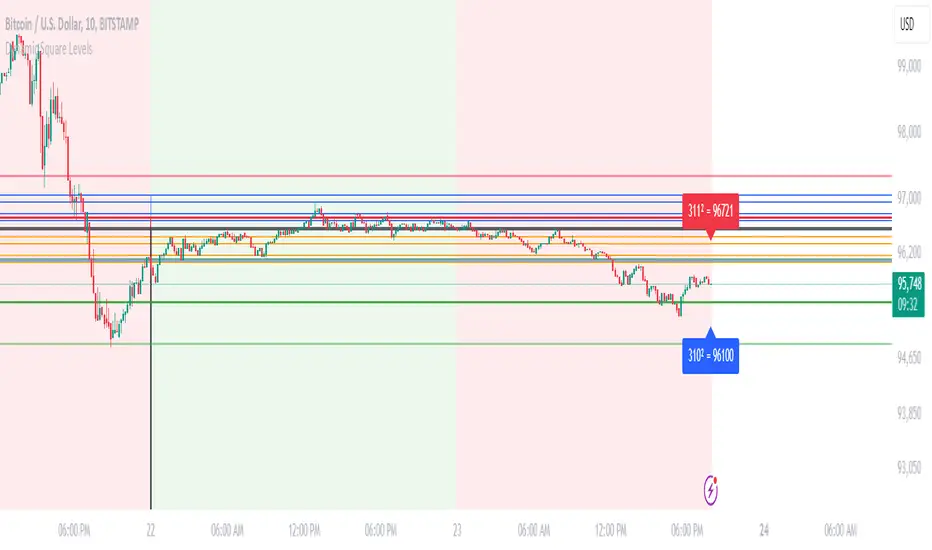
Dynamic Square Levels**Dynamic Square Levels with Strict Range Condition**
This script is designed to help traders visualize dynamic price levels based on the square root of the current price. It calculates key levels above and below the current price, providing a clear view of potential support and resistance zones. The script is highly customizable, allowing you to adjust the number of levels, line styles, and label settings to suit your trading strategy.
---
### **Key Features**:
1. **Dynamic Square Levels**:
- Calculates price levels based on the square root of the current price.
- Plots levels above and below the current price for better market context.
2. **Range Condition**:
- Lines are only drawn when the current price is closer to the base level (`square(base_n)`) than to the next level (`square(base_n + 1)`).
- Ensures levels are only visible when they are most relevant.
3. **Customizable Levels**:
- Choose the number of levels to plot (up to 20 levels).
- Toggle additional levels (e.g., 0.25, 0.5, 0.75) for more granular analysis.
4. **Line and Label Customization**:
- Adjust line width, style (solid, dashed, dotted), and extend direction (left, right, both, or none).
- Customize label text, size, and position for better readability.
5. **Background Highlight**:
- Highlights the background when the current price is closer to the base level, providing a visual cue for key price zones.
---
### **How It Works**:
- The script calculates the square root of the current price and uses it to generate dynamic levels.
- Levels are plotted above and below the current price, with customizable spacing.
- Lines and labels are only drawn when the current price is within a specific range, ensuring clean and relevant visuals.
---
### **Why Use This Script?**:
- **Clear Visuals**: Easily identify key support and resistance levels.
- **Customizable**: Tailor the script to your trading style with adjustable settings.
- **Efficient**: Levels are only drawn when relevant, avoiding clutter on your chart.
---
### **Settings**:
1. **Price Type**: Choose the price source (Open, High, Low, Close, HL2, HLC3, HLCC4).
2. **Number of Levels**: Set the number of levels to plot (1 to 20).
3. **Line Style**: Choose between solid, dashed, or dotted lines.
4. **Line Width**: Adjust the thickness of the lines (1 to 5).
5. **Label Settings**: Customize label text, size, and position.
---
### **Perfect For**:
- Traders who rely on dynamic support and resistance levels.
- Those who prefer clean and customizable chart visuals.
- Anyone looking to enhance their price action analysis.
---
**Get started today and take your trading to the next level with Dynamic Square Levels!** 🚀
DCStatCalcs_v0.1DCStatCalcs_v0.1 - Session-Based Statistical Projections
This Pine Script indicator overlays customizable horizontal lines on your chart to visualize a session's opening price and its statistical projections based on historical standard deviation (SD). Designed for traders who want to analyze price behavior within defined time sessions, it calculates and plots the session open price along with optional projection lines at 0.5, 1.0, 1.5, 2.0, and 2.5 standard deviations above and below the open, derived from past session data.
Key Features:
Customizable Sessions: Define your session time (e.g., 0600-1500) and timezone (e.g., America/New_York).
Historical Analysis: Uses a user-specified number of past sessions (default: 20) to compute the standard deviation of price movements relative to the session open.
Projection Lines: Displays toggleable lines at multiple SD levels with adjustable styles, colors, and widths for easy visualization.
Flexible Display: Extend lines beyond the current bar with an offset setting, and adjust label sizes for clarity.
Real-Time Updates: Lines dynamically extend as the session progresses, keeping projections relevant to the current bar.
How It Works:
At the start of each user-defined session, the indicator records the opening price and calculates the SD based on price deviations from the open across historical sessions. It then plots the open price line and, if enabled, projection lines at the specified SD intervals. These lines help traders identify potential support, resistance, or volatility zones based on statistical norms.
Use Case:
Ideal for day traders or analysts working with intraday charts to gauge price ranges and volatility within specific trading sessions, such as market opens or key economic hours.
Published under the Mozilla Public License 2.0. Created by dc_77.

Daily True Range (DTR) vs Average True Range (ATR)Overview
The "DTR vs ATR with Color-Coded Percentage" indicator is a powerful volatility analysis tool designed for traders who want to understand daily price movements in the context of historical volatility. It calculates the Daily True Range (DTR)—the raw measure of a single day’s volatility—and compares it to the Average True Range (ATR), which smooths volatility over a user-defined period (default 14 days). The indicator presents this data in an intuitive table, featuring a color-coded percentage that visually represents how the current day’s move (DTR) stacks up against the average volatility (ATR). This helps traders quickly assess whether the current day’s price action is unusually volatile, average, or subdued relative to recent history.
Purpose
Volatility Comparison: Visualize how the current day’s price range (DTR) relates to the average range (ATR) over a specified period.
Decision Support: Identify days with exceptional movement (e.g., breakouts or reversals) versus normal or quiet days, aiding in trade entry/exit decisions.
Risk Management: Gauge daily volatility to adjust position sizing or stop-loss levels based on whether the market is exceeding or falling short of typical movement.
Features
Daily True Range (DTR) Calculation:
Computes the True Range for the current day as the greatest of:
Current day’s High - Low
High - Previous Close
Low - Previous Close
Aggregates data on any timeframe to ensure accurate daily values.
Average True Range (ATR):
Calculates the smoothed average of DTR over a customizable period (default 14 days) using Wilder’s smoothing method.
Updates in real-time as the day progresses.
Timeframe Flexibility: Works on any chart timeframe (e.g., 1-minute, 1-hour) while always calculating DTR and ATR based on daily data.
Color-Coded Display in either compact or table mode
The percentage value is color-coded in the table based on configurable thresholds:
Safe (default 75): Normal range, within typical volatility
Warning: (default 75-125): Above-average volatility.
Danger (default 125): Exceptionally high volatility

SMC Liquidity & Order Blocks🔹 1. Moving Averages for Trend Confirmation
Uses Exponential Moving Averages (EMA) to determine trend direction.
9-period EMA (blue) and 15-period EMA (red) are plotted.
🔹 2. Liquidity Zones (Swing Highs & Lows)
Identifies liquidity zones where price is likely to react.
Buy-Side Liquidity: Highest high over 20 periods (Green line).
Sell-Side Liquidity: Lowest low over 20 periods (Red line).
🔹 3. Order Block Detection
Detects bullish and bearish order blocks (key price zones of institutional activity).
Bullish Order Block (OB): Formed when the highest close over 5 bars exceeds the highest high.
Bearish Order Block (OB): Formed when the lowest close over 5 bars is lower than the lowest low.
Plotted using green (up-triangle) for bullish OB and red (down-triangle) for bearish OB.
🔹 4. Fair Value Gaps (FVG)
Detects price inefficiencies (gaps between candles).
FVG Up: When a candle's high is lower than a candle two bars ahead.
FVG Down: When a candle's low is higher than a candle two bars ahead.
Plotted using blue circles (FVG Up) and orange circles (FVG Down).

Previous Day's Close Indicator (Regular Hours)This indicator was developed to replace TradingView's built-in previous close indicator—which erroneously uses the close from two trading days prior. By capturing the actual last trade during the standard session, this script provides a reliable and precise previous close level.
Key features include:
Accurate Previous Close: This indicator locks in the last trade of the regular session, ensuring you always see the true previous day close.
Customizable Display Options: Users can choose between a line or circle plot, with adjustable size settings to suit their charting preferences.
Enjoy!

VWAP [cryptalent]VWAP Indicator with Adjustable Source
Overview
This TradingView indicator calculates Daily, Weekly, and Monthly VWAP (Volume Weighted Average Price) with the flexibility to select different price sources (Open, High, Low, Close, HLC3, etc.). It also displays previous period VWAP levels, helping traders analyze past liquidity zones.
Key Features:
✅ Adjustable Source – Users can choose the price used for VWAP calculations (e.g., Close, High, Low, Open).
✅ Multi-Timeframe VWAP – Tracks Daily, Weekly, and Monthly VWAP to provide a broader market view.
✅ Historical VWAP Levels – Displays previous VWAP values for comparison and reference.
✅ Step Line Style – Ensures clear distinction between different periods and prevents overlapping.
✅ Visible in the Price Scale – The latest and historical VWAP values are displayed in the right-hand price scale for easy reference.
Customization:
You can easily modify the input settings to match your trading style.
Adjust the VWAP source price to test different perspectives (e.g., Open vs. High vs. Close).

[TehThomas] - MA Cross with DisplacementThis TradingView script, "MA Cross with Displacement," is designed to detect potential long and short trade opportunities based on moving average (MA) crossovers combined with price displacement confirmation. The script utilizes two simple moving averages (SMA) and highlights potential trade signals when a crossover occurs alongside a strong price movement (displacement).
Why This Indicator is Useful
This indicator enhances the standard moving average crossover strategy by incorporating a displacement condition, making trade signals more reliable. Many traders rely on moving average crossovers to determine trend reversals, but false signals often occur due to minor price fluctuations. By requiring a significant price movement (displacement), this indicator helps filter out weak or insignificant crossovers, leading to more high-probability trade opportunities.
How It Works
Calculates Two Moving Averages (MA)
The user can set two different MA periods:
MA 1 (blue line): Default period is 9 (shorter-term trend).
MA 2 (red line): Default period is 21 (longer-term trend).
These moving averages smooth out price fluctuations to identify overall trends.
Detects Crossovers
Bullish crossover: The blue MA crosses above the red MA + displacement candle → Potential long signal.
Example of bullish cross with displacement:
Bearish crossover: The blue MA crosses below the red MA + displacement candle → Potential short signal.
Example of bearish cross with displacement:
Confirms Displacement (Strong Price Move)
A price displacement threshold is used (default: 1.1% of the previous candle size).
For a valid trade signal, a crossover must occur alongside a strong price movement.
Bullish Displacement Condition: Price increased by more than the threshold.
Bearish Displacement Condition: Price decreased by more than the threshold.
Visual Indicators on the Chart
Bars are colored green when there is a bullish displacement.
Bars are colored red when there is a bearish displacement.
These color changes help traders quickly identify potential trade setups.
How to Use the Indicator
Add the Script to Your Chart
Copy and paste the script into TradingView's Pine Script Editor.
Click "Add to Chart" to activate it.
Customize the Settings
Adjust the moving average periods to fit your trading strategy.
Modify the displacement threshold based on market volatility.
Change the bar colors for better visualization.
Look for Trade Signals
Long Trade (Buy Signal)
The blue MA crosses above the red MA (bullish crossover).
A green bar appears, confirming bullish displacement.
Short Trade (Sell Signal)
The blue MA crosses below the red MA (bearish crossover).
A red bar appears, confirming bearish displacement.
Use in Conjunction with Other Indicators
This indicator works best when combined with support & resistance levels, RSI, MACD, or volume analysis to improve trade accuracy.
Final Thoughts
The MA Cross with Displacement Indicator improves the reliability of moving average crossovers by requiring strong price movements to confirm a trade signal. This helps traders avoid false breakouts and weak trends, making it a powerful tool for identifying high-probability trades.
__________________________________________
Thanks for your support!
If you found this idea helpful or learned something new, drop a like 👍 and leave a comment—I’d love to hear your thoughts! 🚀
Make sure to follow me for more price action insights, free indicators, and trading strategies. Let’s grow and trade smarter together! 📈✨

Sniper TradingSniper Trader Indicator Overview
Sniper Trader is a comprehensive trading indicator designed to assist traders by providing valuable insights and alerting them to key market conditions. The indicator combines several technical analysis tools and provides customizable inputs for different strategies and needs.
Here’s a detailed breakdown of all the components and their functions in the Sniper Trader indicator:
1. MACD (Moving Average Convergence Divergence)
The MACD is a trend-following momentum indicator that helps determine the strength and direction of the current trend. It consists of two lines:
MACD Line (Blue): Calculated by subtracting the long-term EMA (Exponential Moving Average) from the short-term EMA.
Signal Line (Red): The EMA of the MACD line, typically set to 9 periods.
What does it do?
Buy Signal: When the MACD line crosses above the signal line, it generates a buy signal.
Sell Signal: When the MACD line crosses below the signal line, it generates a sell signal.
Zero Line Crossings: Alerts are triggered when the MACD line crosses above or below the zero line.
2. RSI (Relative Strength Index)
The RSI is a momentum oscillator used to identify overbought or oversold conditions in the market.
Overbought Level (Red): The level above which the market might be considered overbought, typically set to 70.
Oversold Level (Green): The level below which the market might be considered oversold, typically set to 30.
What does it do?
Overbought Signal: When the RSI crosses above the overbought level, it’s considered a signal that the asset may be overbought.
Oversold Signal: When the RSI crosses below the oversold level, it’s considered a signal that the asset may be oversold.
3. ATR (Average True Range)
The ATR is a volatility indicator that measures the degree of price movement over a specific period (14 bars in this case). It provides insights into how volatile the market is.
What does it do?
The ATR value is plotted on the chart and provides a reference for potential market volatility. It's used to detect flat zones, where the price may not be moving significantly, potentially indicating a lack of trends.
4. Support and Resistance Zones
The Support and Resistance Zones are drawn by identifying key swing highs and lows over a user-defined look-back period.
Support Zone (Green): Identifies areas where the price has previously bounced upwards.
Resistance Zone (Red): Identifies areas where the price has previously been rejected or reversed.
What does it do?
The indicator uses swing highs and lows to define support and resistance zones and highlights these areas on the chart. This helps traders identify potential price reversal points.
5. Alarm Time
The Alarm Time feature allows you to set a custom time for the indicator to trigger an alarm. The time is based on Eastern Time and can be adjusted directly in the inputs tab.
What does it do?
It triggers an alert at a user-defined time (for example, 4 PM Eastern Time), helping traders close positions or take specific actions at a set time.
6. Market Condition Display
The Market Condition Display shows whether the market is in a Bullish, Bearish, or Flat state based on the MACD line’s position relative to the signal line.
Bullish (Green): The market is in an uptrend.
Bearish (Red): The market is in a downtrend.
Flat (Yellow): The market is in a range or consolidation phase.
7. Table for Key Information
The indicator includes a customizable table that displays the current market condition (Bull, Bear, Flat). The table is placed at a user-defined location (top-left, top-right, bottom-left, bottom-right), and the appearance of the table can be adjusted for text size and color.
8. Background Highlighting
Bullish Reversal: When the MACD line crosses above the signal line, the background is shaded green to highlight the potential for a trend reversal to the upside.
Bearish Reversal: When the MACD line crosses below the signal line, the background is shaded red to highlight the potential for a trend reversal to the downside.
Flat Zone: A flat zone is identified when volatility is low (ATR is below the average), and the background is shaded orange to signal periods of low market movement.
Key Features:
Customizable Time Inputs: Adjust the alarm time based on your local time zone.
User-Friendly Table: Easily view market conditions and adjust display settings.
Comprehensive Alerts: Receive alerts for MACD crossovers, RSI overbought/oversold conditions, flat zones, and the custom alarm time.
Support and Resistance Zones: Drawn automatically based on historical price action.
Trend and Momentum Indicators: Utilize the MACD and RSI for identifying trends and market conditions.
How to Use Sniper Trader:
Set Your Custom Time: Adjust the alarm time to match your trading schedule.
Monitor Market Conditions: Check the table for real-time market condition updates.
Use MACD and RSI Signals: Watch for MACD crossovers and RSI overbought/oversold signals.
Watch for Key Zones: Pay attention to the support and resistance zones and background highlights to identify market turning points.
Set Alerts: Use the built-in alerts to notify you of buy/sell signals or when it’s time to take action at your custom alarm time.

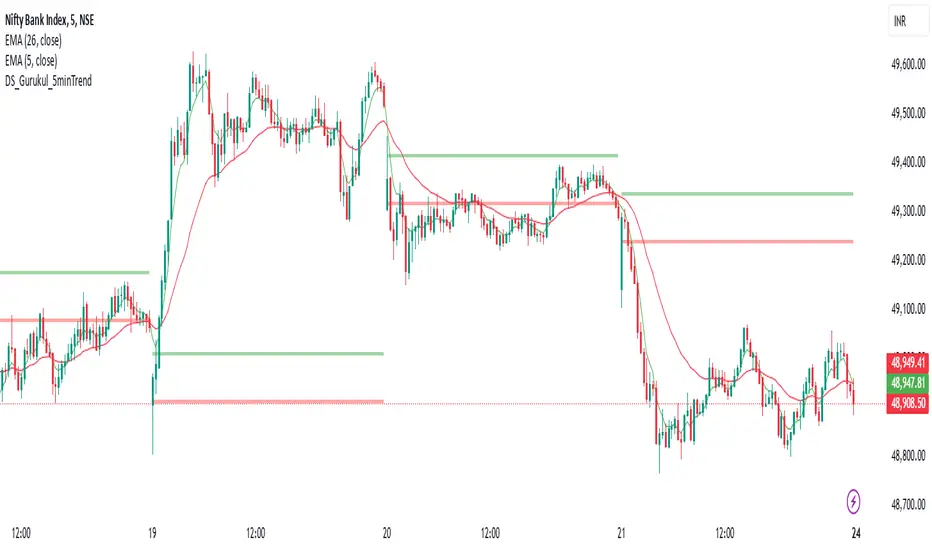
DS_Gurukul_5minTrendDS Gurukul (DS_5minTrend) Indicator: A Simple Yet Powerful Trend Tool
The Tushar Daily Bands (DS_5minTrend) indicator is a straightforward tool designed to help traders quickly visualize potential trend reversals and identify profitable trading opportunities. This indicator plots two bands—an upper band (green) and a lower band (red)—based on a small percentage deviation from the closing price of the first candle of each trading day.
How it Works:
The DS_5minTrend indicator calculates these bands at the start of each new trading day. The bands then remain fixed for the rest of that day. This daily reset allows traders to easily see how the current day's price action relates to the opening price and the calculated bands.
Trading Signals:
Potential Reversals: When the price approaches or touches the upper band (green), it can signal a potential overbought condition and a possible reversal to the downside. Conversely, when the price approaches or touches the lower band (red), it can suggest an oversold condition and a possible reversal to the upside.
Trend Confirmation: If the price consistently closes above the upper band for several periods, it may indicate a strong uptrend. Conversely, consistent closes below the lower band can suggest a strong downtrend.
Support and Resistance: The bands can also act as dynamic support and resistance levels. Traders can watch for price bounces off these levels as potential entry points.
How to Use:
Combine with other indicators: While DS_5minTrend can provide valuable insights, it's generally recommended to use it in conjunction with other technical indicators, such as RSI, MACD, or volume analysis, for confirmation.
Consider market context: Always consider the broader market context and news events that may be influencing price action.
Risk Management: Implement proper risk management strategies, including stop-loss orders, to protect your capital.
Disclaimer: The DS_5minTrend indicator is a tool for analysis and should not be the sole basis for making trading decisions. Trading involves substantial risk, and you could lose money. Always do your own research and consult with a financial advisor before making any investment decisions.
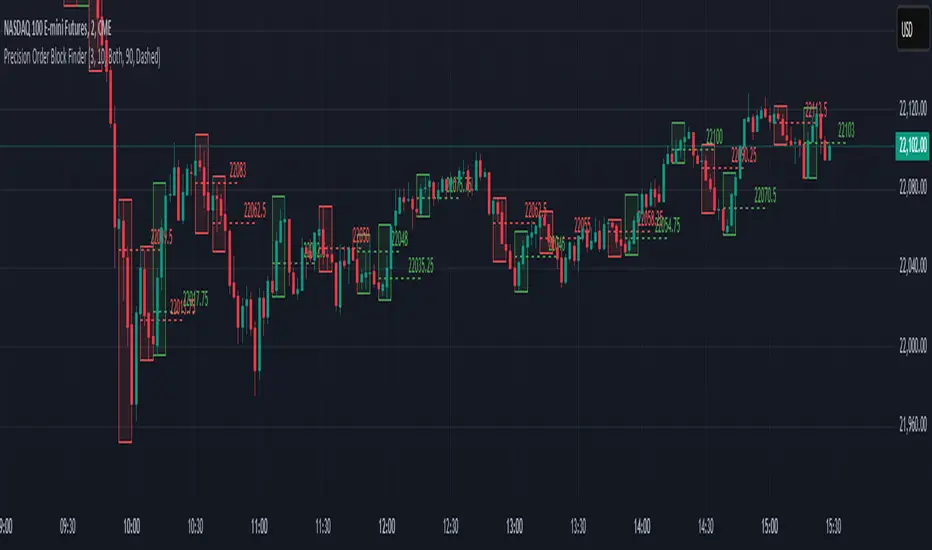
Precision Order Block FinderPrecision Order Block Finder
This advanced indicator identifies high-probability Order Block patterns with customizable confirmation parameters for increased precision and reliability. Unlike basic Order Block indicators, this tool allows you to specify the exact confirmation criteria needed before marking a pattern as valid.
Key Features:
Detects both bullish and bearish Order Block patterns
Customizable confirmation candle settings (1:3 ratio by default)
Adjustable visual properties including transparency and line styles
Optional price labels for quick reference
Filter options to display only bullish, bearish, or both pattern types
How It Works:
The indicator identifies potential Order Blocks by locating a trigger candle (bearish for bullish patterns, bullish for bearish patterns) followed by your specified number of confirmation candles in the opposite direction. This multi-candle confirmation approach helps filter out false signals and focuses on the most reliable trading opportunities.
Perfect for both swing and intraday traders looking to identify key market turning points with greater accuracy. The visual representation clearly highlights potential entry zones and price targets to streamline your trading decisions.
Adjust the settings to match your trading style and timeframe preferences for optimal results.
Weekend RangeWeekend Range Indicator – Customizable High/Low Zones
🔹 Overview
The Weekend Range Indicator marks the last 20 weekends on your chart, highlighting their highs and lows with fully customizable colors, transparency, and time settings. This tool helps traders identify key support and resistance levels from weekend price action.
🛠️ Features
✅ Custom Weekend Start & End – Choose the weekend days and time (UTC)
✅ Automatically Tracks the Last 20 Weekends (configurable up to 50)
✅ Custom Box Colors & Transparency – Adjust the fill and border colors easily
✅ Works on All Timeframes – Best viewed on 1H, 4H, or higher
✅ Efficient & Optimized Code – No lag, smooth performance
🎯 How to Use
1️⃣ Add the indicator to your chart.
2️⃣ Adjust the weekend start & end time in the settings.
3️⃣ Customize the box colors and transparency to match your style.
4️⃣ Watch how price reacts around the weekend high/low zones for trade opportunities.
💡 Trading Strategies
🔹 Breakout Trading – Look for price breaking above or below the weekend range.
🔹 Reversal Zones – Watch for rejections at weekend highs/lows.
🔹 Liquidity & Stop Hunts – Large players often target these levels.
📈 Recommended Markets
✔ Works best on Forex, Crypto, Indices, and Commodities
✔ Ideal for swing traders and intraday traders
🚀 Enjoy using the indicator! Let me know if you’d like any new features added! 🎯🔥
