Macro+ ExtMacros+ (Time Sessions & Alerts)
Macros+ is a powerful and highly customizable tool designed to highlight specific time windows—often referred to as "macros"—directly on your chart. It is built for traders who operate on time-based strategies, such as those targeting specific liquidity periods like the ICT Silver Bullet or other institutional timeframes.
By visualizing these key sessions historically and in real-time, traders can better anticipate market volatility, identify potential trade setups, and maintain discipline. The script is clean, efficient, and built with flexibility in mind.
Key Features
This indicator goes beyond simple time boxes and includes several advanced features to fit your specific trading style:
1. Historical & Real-Time Display
The script is designed to plot all selected macro sessions across the entire historical data loaded on your chart, not just the current day. This allows for comprehensive backtesting and analysis of how price behaves during these specific time windows.
2. Fully Customizable Macro Sessions
You have full control over which time sessions you want to display. The indicator includes 14 pre-configured 20-minute sessions, which you can easily toggle on or off from the settings menu. This allows you to focus only on the timeframes that are relevant to your strategy.
3. Adjustable "Extended Macro" Time
Flexible Time Extension: Instead of a fixed session duration, you can now dynamically extend the start and end times of all macros.
Numerical Input: In the settings, under "Time Settings," you'll find an "Extend Minutes" input. This number lets you add minutes to both the beginning and the end of each session.
Example: A standard macro from 09:50 - 10:10 with an "Extend Minutes" value of 5 will be automatically adjusted to 09:45 - 10:15. Setting it to 0 will keep the default 20-minute sessions.
4. Multiple Display Styles
Adapt the indicator's appearance to your preference for a clean and readable chart. All styles are designed to span the full vertical height of the chart for maximum visibility.
Solid Line: Clear, solid vertical lines marking the start and end of a session.
Dashed Line: A more subtle, dashed-line alternative.
Dotted Line: The most subtle line style for a minimalist chart.
Background: Fills the entire session window with a semi-transparent color.
Outline: Draws a colored border around the session window without filling it.
5. Real-Time Alerts
Never miss the start of a key session again. You can enable an alert that will trigger once at the beginning of any active macro session. This is perfect for traders who may not be watching the charts constantly.
6. Timezone Correction
All times are calculated based on the timezone you select in the settings (default is "America/New_York"). This ensures the sessions are always plotted accurately according to the market you are trading (e.g., New York session times).
How to Use
Add to Chart: Add the "Macros+" indicator to your chart.
Open Settings:
General Settings: Choose your preferred Timezone, Display Style, and Color.
Active Macro Sessions: Check the boxes for the time sessions you wish to monitor.
Time Settings: Enter a value in Extend Minutes if you want to widen the time windows. A value of 5 will create 30-minute sessions.
Alert Settings: Enable the Alert On Macro Start option if you wish to receive alerts.
Create Alert: To activate the pop-up alert, click the clock icon on the TradingView right-hand panel, select "Macros+" in the "Condition" dropdown, choose "Sesi Makro Dimulai," and set it to trigger "Once Per Bar."
This tool was designed to be both powerful and user-friendly. I hope it becomes a valuable part of your trading toolkit. Happy trading!
Cycles

M.O.E - Stochastic BacktesterLooking for some folks to help validate a new tool that is currently in development. It's not perfect and still in the testing phase, but the goal is to use it as a means to validate other indicators. This tool takes into account various data points such as volume, price action, and volatility signals to help identify potential trade setups. I'm hoping to gather feedback on its effectiveness, usability, and any areas for improvement before making it more widely available. If you're interested in testing this out and providing honest feedback, please let me know!


first 5 minutes NY session)I created this indicator myself to identify the first 5 minutes of the New York session, during which it automatically draws the lines. It's a strategy that has helped me a lot.

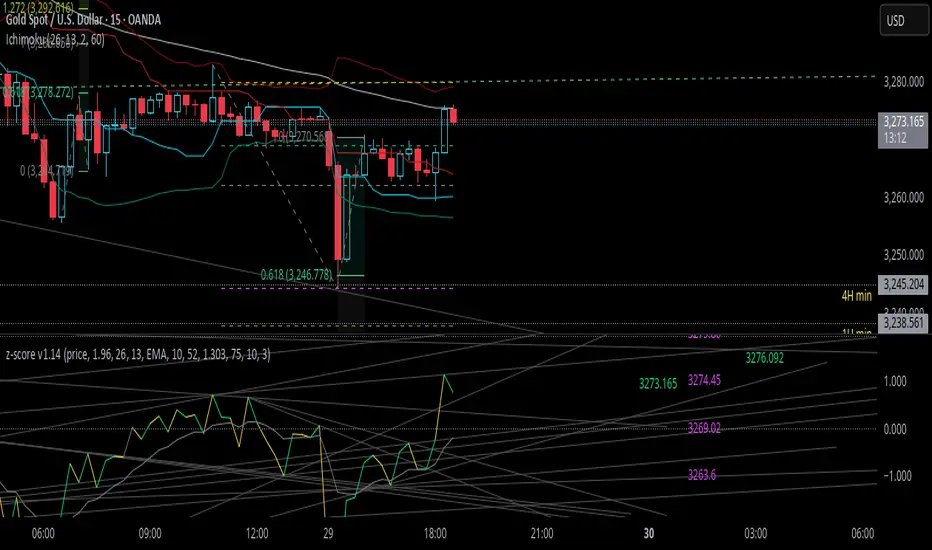
z-score-calkusi-v1.14z-scores incorporate the moment of N look-back bars to allow future price projection.
z-score = (X - mean)/std.deviation ; X = close
z-scores update with each new close print and with each new bar. Each new bar augments the mean and std.deviation for the N bars considered. The old Nth bar falls away from consideration with each new historical bar.
The indicator allows two other options for X: RSI or Moving Average.
NOTE: While trading use the "price" option only.
The other two options are provided for visualisation of RSI and Moving Average as z-score curves.
Use z-scores to identify tops and bottoms in the future as well as intermediate intersections through which a z-score will pass through with each new close and each new bar.
Draw lines from peaks and troughs in the past through intermediate peaks and troughs to identify projected intersections in the future. The most likely intersections are those that are formed from a line that comes from a peak in the past and another line that comes from a trough in the past. Try getting at least two lines from historical peaks and two lines from historical troughs to pass through a future intersection.
Compute the target intersection price in the future by clicking on the z-score indicator header to see a drag-able horizontal line to drag over the intersection. The target price is the last value displayed in the indicator's status bar after the closing price.
When the indicator header is clicked, a white horizontal drag-able line will appear to allow dragging the line over an intersection that has been drawn on the indicator for a future z-score projection and the associated future closing price.
With each new bar that appears, it is necessary to repeat the procedure of clicking the z-score indicator header to be able to drag the drag-able horizontal line to see the new target price for the selected intersection. The projected price will be different from the current close price providing a price arbitrage in time.
New intermediate peaks and troughs that appear require new lines be drawn from the past through the new intermediate peak to find a new intersection in the future and a new projected price. Since z-score curves are sort of cyclical in nature, it is possible to see where one has to locate a future intersection by drawing lines from past peaks and troughs.
Do not get fixated on any one projected price as the market decides which projected price will be realised. All prospective targets should be manually updated with each new bar.
When the z-score plot moves outside a channel comprised of lines that are drawn from the past, be ready to adjust to new market conditions.
z-score plots that move above the zero line indicate price action that is either rising or ranging. Similarly, z-score plots that move below the zero line indicate price action that is either falling or ranging. Be ready to adjust to new market conditions when z-scores move back and forth across the zero line.
A bar with highest absolute z-score for a cycle screams "reversal approaching" and is followed by a bar with a lower absolute z-score where close price tops and bottoms are realised. This can occur either on the next bar or a few bars later.
The indicator also displays the required N for a Normal(0,1) distribution that can be set for finer granularity for the z-score curve.This works with the Confidence Interval (CI) z-score setting. The default z-score is 1.96 for 95% CI.
Common Confidence Interval z-scores to find N for Normal(0,1) with a Margin of Error (MOE) of 1:
70% 1.036
75% 1.150
80% 1.282
85% 1.440
90% 1.645
95% 1.960
98% 2.326
99% 2.576
99.5% 2.807
99.9% 3.291
99.99% 3.891
99.999% 4.417
9-Jun-2025
Added a feature to display price projection labels at z-score levels 3, 2, 1, 0, -1, -2, 3.
This provides a range for prices available at the current time to help decide whether it is worth entering a trade. If the range of prices from say z=|2| to z=|1| is too narrow, then a trade at the current time may not be worth the risk.
Added plot for z-score moving average.
28-Jun-2025
Added Settings option for # of Std.Deviation level Price Labels to display. The default is 3. Min is 2. Max is 6.
This feature allows likelihood assessment for Fibonacci price projections from higher time frames at lower time frames. A Fibonacci price projection that falls outside |3.x| Std.Deviations is not likely.
Added Settings option for Chart Bar Count and Target Label Offset to allow placement of price labels for the standard z-score levels to the right of the window so that these are still visible in the window.
Target Label Offset allows adjustment of placement of Target Price Label in cases when the Target Price Label is either obscured by the price labels for the standard z-score levels or is too far right to be visible in the window.
Practice makes perfect.
Use this indicator at your own risk

Multi-Timeframe Horizontal LinesThis Pine Script indicator plots horizontal lines at the high and low prices of the most recent 1-hour and 15-minute candles. Users can customize the color and width of the lines for each timeframe. The lines are updated dynamically, with previous lines removed to keep the chart clean.

Jigsaw Premium Trend IndicatorThe Jigsaw Premium Trend Indicator is an exclusive tool designed for premium members, offering a sophisticated trend analysis with customizable EMAs (10, 21, 55, 200) and a 200-period MA. Featuring thinner lines for clarity, this indicator allows premium users to toggle visibility of each EMA, adjust positions manually with clickable editing, and track trends dynamically as the chart moves. Perfect for identifying key market trends, it’s a must-have for advanced trading strategies.

Jigsaw Premium Trend IndicatorThe Jigsaw Premium Trend Indicator is an exclusive tool designed for premium members, offering a sophisticated trend analysis with customizable EMAs (10, 21, 55, 200) and a 200-period MA. Featuring thinner lines for clarity, this indicator allows premium users to toggle visibility of each EMA, adjust positions manually with clickable editing, and track trends dynamically as the chart moves. Perfect for identifying key market trends, it’s a must-have for advanced trading strategies.

CEO IndicatorCEO Indicator
Liquidity Levels:
PDH / PDL (Previous Day High/Low)
PWH / PWL (Previous Week High/Low)
PMH / PML (Previous Month High/Low)
DO, NYM, WO, TWO, MO (Daily/Weekly/Monthly Opens + True Opens)
Asia Midpoint (0.5) — midline between Asian session high and low
Customization: colors, opacity, line thickness
Trading Sessions:
4H Display: On the 4H timeframe and above, session boxes may appear cluttered or overlapping.
You can disable session display for higher timeframes to keep the chart clean.
Overlap: When Overlap is turned off, sessions will not be drawn on top of each
other — improving visual clarity during overlapping markets (e.g. London + New York).
Supports: Asia, Frankfurt, London, New York, Lunch
Display modes: Box, Streamlined, Fill, High-Low zones
Customized labels
Time zone auto-adjust & custom time zones
Fractals & FVG:
Automatic fractal high/low detection
Displays Fair Value Gaps (FVG) — bullish & bearish

2-Year MA + Adjustable MA + Offset MidlineProvides a very accurate macro channel to gauge tops and bottoms for Bitcoin.

BG CloseCandleThis simple yet effective strategy script allows you to schedule automated entries (Buy or Sell) at three customizable times throughout the trading day. Each session can be individually enabled, with its own execution time and trade direction.
You can define:
• Entry time (Hour & Minute) for each session
• Whether each session should execute a Buy or a Sell order
• Your preferred Take Profit and Stop Loss levels (in ticks)
• Lot size per order
The strategy is designed specifically for the 1-minute timeframe, offering the most precise execution of time-based entries. It resets automatically each day and limits the number of trades to a maximum of three per session.
📌 I personally use this strategy on the Nasdaq 100 E-mini Futures (NQ) for intraday setups and session-based candle closes.
Perfect for testing market behavior at defined moments — ideal for overnight, premarket, or close-of-candle strategies.
Thank you for your interest, and wishing you profitable trading

X HL QA market structure tool designed to frame price action within a defined context of prior session dynamics. It accomplishes this by anchoring a set of reference levels to the high, low, and open prices of a user-specified higher timeframe (e.g., 4H, 1D, etc.) and projecting those levels onto the current chart for ongoing analysis.
At its core, the indicator establishes a reference range—derived from the previous completed instance of the selected timeframe—and overlays this on the current timeframe. This range serves as a foundational structure for price interpretation in the current session.
Building upon this framework, the script constructs a set of symmetrical quadrants (or deviation zones) both inside and outside of the prior range. These include:
The midpoint (EQ) of the prior range
Levels at ±0.25x, ±0.75x, ±1.0x, ±1.5x, and ±2.0x the range height
These levels act as contextual zones that traders can use to interpret price behavior—whether it's consolidating within the prior range, approaching fair value (EQ), or expanding into directional continuation or reversal zones beyond the range.
The script operates in both real-time and historical contexts. On live bars, it dynamically updates the key levels to provide an evolving view of current price positioning. Simultaneously, it supports the display of historical levels for past sessions, enabling robust backtesting and comparative analysis of price behavior relative to previous quadrant structures.
Ultimately, this tool serves as a positional map, helping traders assess where price is trading relative to significant levels from the prior session, offering insights into potential support/resistance, overextension, or mean reversion scenarios.
Key Technical Features
Multi-Timeframe Support:
request.security() is used to pull data from a user-defined higher timeframe regardless of the current chart interval.
Visual Flexibility:
Toggle between "line" and "channel" mode.
Line color, width, and visibility are all user-controlled.
Anchoring Options:
Deviation levels can be calculated from either the previous period's open or its EQ (midpoint), giving flexibility depending on analytical preference.
Efficient Labeling:
Labels are only rendered on the last bar and are automatically cleared and redrawn to prevent duplication.
Label style, size, text color, and background color are all user-configurable.
Trading Application
This indicator is especially suited for:
1. Mean Reversion Strategies
When price moves beyond +1.0 or +1.5 deviations from the EQ or open, it may signal overextension and a potential snap back to the midpoint or range.
2. Breakout Confirmation
Sustained price action beyond ±1.0 levels may indicate trend strength or continuation beyond historical balance zones.
3. Contextual Range Awareness
EQ and Open provide structure from which traders can judge whether price is in a state of balance or imbalance.
Labels offer at-a-glance interpretation of key levels across any chosen timeframe.
4. Fractal and Multi-Session Analysis
Analysts can layer daily, weekly, and monthly versions of this indicator to observe confluence or divergence of higher timeframe structure.

unprofitable stratThe indicator is a comprehensive trend-following indicator for TradingView. It's designed to identify and trade in the direction of the market's primary trend while using a dynamic, volatility-based system for exits. It filters out counter-trend noise and provides a clear visual dashboard of market conditions.
Core Trading Strategy
The indicator's logic is based on a two-part confirmation system to ensure trades are only taken in favorable conditions.
Master Trend Filter: The indicator first determines the "master trend" by checking if the price is above or below a long-term (200-period) Exponential Moving Average (EMA). It will only look for BUY signals when the price is above this EMA (in a master bullish trend) and only look for SELL signals when the price is below it. This prevents fighting the main market current.
Entry Trigger: Once the master trend is confirmed, the indicator doesn't enter immediately. It waits for a secondary confirmation: a breakout above a recent swing high (for a BUY) or a breakdown below a recent swing low. This ensures that short-term momentum has aligned with the long-term trend before a signal is generated.
Dynamic Exit Strategy
Exits are not based on a fixed target. Instead, the indicator uses a professional-grade ATR-based Trailing Stop Loss.
This "smart" stop loss automatically trails behind a profitable trade. It moves up to lock in gains during a BUY trade but never moves down.
The distance of the stop from the price is determined by the Average True Range (ATR), meaning it gives the trade more room to breathe in volatile markets and tightens up to protect profits in calm markets.
An "EXIT" signal appears on the chart when the price finally pulls back and hits this trailing stop line.
Visual Features on the Chart
The indicator provides several visual aids to make the trading process clear and intuitive.
Custom-Plotted Candles: The indicator draws its own candlesticks that are colored based on the trade status:
Blue: An active BUY trade is in progress.
Purple: An active SELL trade is in progress.
Gray: The indicator is flat with no active trade.
Signal Labels: Clear "BUY", "SELL", and "EXIT" labels are plotted directly on the chart at the moment they occur.
Trailing Stop Line: A bright orange line appears and follows the price during a trade, showing you the exact level of your trailing stop loss.
Multi-Timeframe Table: An optional dashboard in the top-right corner displays the master trend status ("Bullish" or "Bearish") on the 1m, 5m, 15m, 1-hour, and 4-hour timeframes simultaneously.
Trend Background: An optional feature allows you to color the entire chart background light blue or purple to match the master trend direction.

Price Density Strategy ScoreBased on the rules we defined, a composite score (-3 to +3) is calculated and displayed as colored bars below the chart:
Dark green (+3): Strong buy signal
Light green (+1, +2): Mildly bullish
Gray (0): Neutral
Light red (-1, -2): Mildly bearish
Dark red (-3): Strong sell signal
根据我们定义的规则,计算一个综合分数(-3 到 +3),并在图表下方用不同颜色的柱状图显示出来:
深绿色 (+3):强力买入信号
浅绿色 (+1, +2):温和看涨
灰色 (0):中性
浅红色 (-1, -2):温和看跌
深红色 (-3):强力卖出信号

MACD Triple divergence signalsThis script is a basic combination of several scripts that I found very useful. It's a MACD divergence on steroids. Instead of using only one plot as a source for detecting divergence, I use all of the plots.
The idea is that if more divergence signals appear—especially after a prolonged downtrend or uptrend—they can be interpreted as a strong divergence signal.
The third divergence signal is taken from the MACD signal line. It has a longer-term lookback range, which could provide a more reliable divergence signal.
The default minimum lookback range is 15, much greater than the usual value of 5. This makes it more suitable for long-term trading or for lower timeframes (lower than 4H) to reduce noise from excessive signals. For timeframes higher than 4H, the setting can be reduced to around 10 or even 5.
For the 1W (weekly) timeframe, try using a value of 3.
I also added a band to give a clear visual of overbought and oversold areas. It works similarly to Bollinger Bands (BB). You can spot when the price is ranging or when a stop-loss hunt occurs (i.e., the price breaks the band).
Please do your homework—backtest it yourself to find which timeframe suits you best. You can also tweak the settings if you find the default values too aggressive or too mild.
I’ve found that MACD is more reliable on timeframes greater than 1H. Personally, I use it on the 4H and 1D timeframes.
in bahasa:
MACD dengan 3 sinyal divergence, kalau muncul lebih banyak, bisa jadi sinyal lebih menyakinkan.
Minimum lookback range default-nya 15 agar tidak muncul terlalu banyak sinyal. 15 lebih panjang, lebih ok. Kalau main di higher timeframe seperti 1D, bisa 5-10, kalau weeky timeframe = 3.
Untuk band, cek ketika plot-nya keluar dari band, itu bisa jadi jackpot, apalagi kalau plot-nya membentuk double bottom.
Backtest sendiri, siapa tahu kalian bisa dapet setting sendiri.
MACD with upper and lower band will give you a clear visual of price movements
More divergence signals are generated and when the price breaks out of the oversold band = jackpot.

2-Year MA + Scaled + % OffsetGives you a reliable channel to gauge macro tops and bottoms for Bitcoin.

Step 1: Draw Thursday HighScript Description: Thursday High Marker
This is an automated charting tool designed to identify the high of each Thursday and display it as a key reference level for future trading sessions.
Core Functionality:
The script's logic is simple and precise. It waits for the trading session on Thursday to complete. At the very beginning of Friday, it looks back, finds the highest price from Thursday, and draws a clean, white horizontal line at that level.
Key Features:
Automatic: You don't need to do anything. The script finds and draws the level on its own every week.
Forward-Looking: The line extends to the right indefinitely, allowing you to see how future price action interacts with this key level.
Self-Cleaning: To keep your chart uncluttered, the script automatically deletes the previous week's line when it draws the new one.
Lightweight: It performs a single, simple task, so it doesn't slow down your chart.
Purpose in Trading:
Traders use this kind of indicator to track significant weekly price points. The high of a late-week session like Thursday is often considered an important liquidity level. A break above this line can signal bullish strength or a "liquidity sweep," making it a valuable point of interest for making trading decisions on Friday and into the following week.

JS Elite XAUUSD Scalper v1.0📈 Elite XAUUSD Scalper v1.0 – A Premium Scalping Strategy for Gold
The Elite XAUUSD Scalper v1.0 is a high-performance scalping strategy designed to capture quick price movements in the XAUUSD (Gold) market. Built with precision and optimized for intraday trading, this strategy uses a combination of Fast & Slow EMAs, ATR (Average True Range), and advanced Order Block & Liquidity Sweep logic to identify profitable opportunities in real-time.
Key Features:
Multiple Confluences: The strategy utilizes the HTF Trend Filter, RSI, Volume Analysis, and Order Blocks to ensure that trades are placed with the highest probability of success.
Real-time Entry & Exit Signals: Automated long and short entries with Take-Profit (TP), Stop-Loss (SL), and Partial TP levels for precise risk management.
Trailing Stop: Automatically trails stop-loss to lock in profits as the price moves in your favor, ensuring that you can ride the trend while protecting your gains.
Alerts: Get notified of long and short signals in real-time via TradingView alerts. Never miss a trade!
Strategy Logic:
Trend Filter: The strategy incorporates a higher time-frame (HTF) trend filter, which ensures that trades are taken only in the direction of the overall trend.
Scalping Precision: The Fast EMA (4) and Slow EMA (14) ensure timely entry and exit points, while the ATR (2) adds an extra layer of risk management, ensuring your stops are intelligently placed.
Risk-to-Reward: Set to a 2:1 reward-to-risk ratio, with an option for partial take-profit at 1.2x RR, allowing you to lock in gains while letting the trade run.
Order Block & Liquidity Sweep: Identifies price levels with high institutional interest, ensuring your trades align with market liquidity.
Ideal For:
Intraday Traders: This strategy is perfect for traders looking to capitalize on fast, small price movements in XAUUSD (Gold).
Scalpers & Swing Traders: It’s designed to handle quick moves while minimizing drawdown and securing profits during market swings.
Why Choose Elite XAUUSD Scalper v1.0?
Customizable: Adjust the strategy's risk parameters, trailing stop, and partial TP to suit your trading style and risk tolerance.
Highly Accurate: Combining the Fast & Slow EMAs, ATR, and order block logic, this strategy increases the accuracy of your trades, helping you stay ahead of market movements.
Automated: Set it and forget it — the strategy takes care of entries, exits, and risk management, freeing you to focus on other markets or activities.
🚀 Start Trading with Elite XAUUSD Scalper v1.0 Today!
Unlock the power of high-frequency scalping with the Elite XAUUSD Scalper v1.0. Get access to the strategy and start trading smarter today.
💬 Disclaimer
This strategy is for educational purposes only. Past performance is not indicative of future results. Use this strategy at your own risk and ensure that you fully understand its features and risks before trading with real capital.

Cumulative Price🎯 Cumulative Price - Usage Framework
🧭 Purpose
Cumulative Price offers a simple contextualization of price action within a daily session.
It resets to zero daily, tracking the cumulative range of price movement in ticks — a concept similar to cumulative delta, but focused purely on price activity, not volume.
🧠 Core Concept
The oscillator shows results from effort accumulate over time. Instead of measuring who is buying or selling, it reveals how far is pushing relative to zero.
🔔 Signal Types
⚖️ Zero Signal
Triggered when the oscillator crosses above or below the zero line.
📌 Interpreted as:
Price is testing fairness or market agreement.
This level is a balancing point — price may accept it (continue) or reject it (reverse).
🚩 Peak Signal
Triggered when the oscillator reaches a new extreme, defined by ATR-based thresholds.
📌 Interpreted as:
Price is undergoing strong effort — likely accumulation or distribution.
Could signal a transition, consolidation, or imminent breakout/reversal.
🧩 How to Use
Approach both signals with thoughtful market questioning:
🧐 Something significant is happening — what is it?
📈 How intense is the move? Does it align with volatility or deviate from it?
🌐 Where does this action sit in broader market context?
🧪 Analytical Tips
Zero Signals are useful for:
Identifying reversion points or fairness tests.
Monitoring price acceptance around the session midpoint.
Peak Signals help:
Spot early accumulation/distribution behavior.
Anticipate volatility expansion or fade exhaustion.
💡 Additional Thoughts
This tool does not dictate trades. Instead, it provides context.
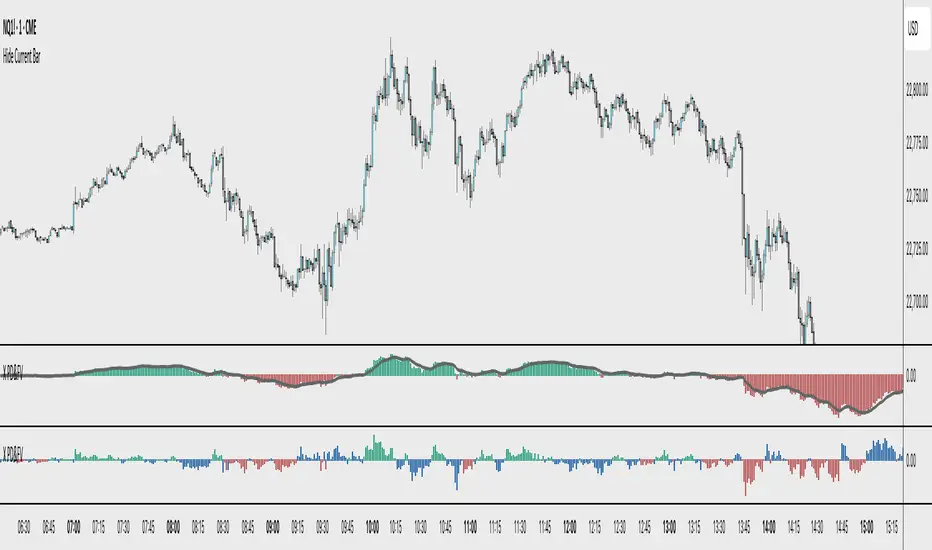
Combine it with tools like Cumulative Delta for a layered analysis of price result and volume effort.
Use it to frame narratives, not absolutes. Ask:
"If this is happening here, what does that say about intent?"

Cumulative Volume Delta with MAfor higher timeframes , i use 9 or 11 ema , and 5 seconds on 1 day. moving average of the cvd not the raw volume . i use it with the impulse macd and find momentum trades or selloffs when moving averages cross .

X PD&FVVisualizes the price's premium or discount relative to a moving average benchmark, highlighting mean-reversion and trend-continuation opportunities. While the underlying math is simple, the application is nuanced and can enhance decision-making in both trending and ranging market conditions.
Core Logic:
This tool calculates a custom **spread value**, defined as the distance between the current price and a chosen exponential moving average (EMA). Specifically:
When the current price is **above** the EMA, the spread is calculated as `low - EMA`.
When the price is **below** the EMA, the spread is calculated as `high - EMA`.
This approach creates a dynamic spread that reflects deviation from the EMA, with histogram bars:
Green when the spread is positive (suggesting a price premium),
Red when the spread is negative (suggesting a discount).
A secondary EMA (default 9-period) is applied to the spread itself, plotted as a smoother line over the histogram. This "EMA of spread" line can be interpreted as a moving reference level for detecting directional shifts in momentum.
Interpretation:
Zero Line = Fair Value: The horizontal zero axis represents equilibrium relative to the moving average. Movement toward or away from this line signals potential shifts in market bias.
Trend Following Use: In trending markets, traders can:
Buy when the spread dips below its EMA (discount within uptrend),
Sell when the spread rises above its EMA (premium within downtrend).
Mean Reversion Use: A return to the zero line (fair value) often acts as an **inflection point**, which traders can monitor for either:
Trend continuation (bounce away from zero), or
Reversal (cross through zero).
Customization:
EMA length (default 50) is adjustable to fit different timeframes or asset volatility.
BGSwing StrategyThis Pine Script® strategy detects bullish and bearish liquidity levels (SSL/BSL) based on swing points and executes trades based on breakout-failure logic.
✨ Features:
• Automatically identifies Swing Highs (BSL) and Swing Lows (SSL)
• Configurable strategy execution on Break & Fail (Break and Close Back)
• Optional buy/sell direction filtering
• Customizable Take Profit & Stop Loss (in points)
• Visual liquidity levels drawn as horizontal lines
• Optional signal labels displayed directly on the chart
⚙️ Parameters:
• Liquidity Strength: defines the number of bars for valid highs/lows
• Direction Filter: Buy only / Sell only / Both
• Line style, width, and color customization
• Option to auto-delete old liquidity levels
Ideal for traders using price action and smart money concepts who want clean entry logic and visual confirmation.
Enjoy and use responsibly. 📈
