IPDA Data Ranges📌 IPDA Data Ranges – Institutional Price Delivery Arrays
The IPDA Data Ranges indicator is a precision tool for identifying institutional price delivery arrays over the most recent market sessions. Designed with ICT (Inner Circle Trader) principles in mind, it dynamically draws key price zones based on the high, low, and 50% equilibrium of the last 20, 40, and 60 valid trading days – excluding weekends and holidays.
✅ Key Features
3 Independent Ranges: Configurable boxes for the last 20, 40, and 60 trading days (excludes weekends & market holidays).
Accurate Market-Based Lookback: All calculations are based on actual trading days, ensuring reliability across timeframes.
Visual Precision: Each range is represented as a box with:
Top = Highest High,
Bottom = Lowest Low,
Midline = 50% of the Range
Custom Styling per Range:
Toggle visibility per session
Adjustable box fill color and border color
Custom text inside the box
Fully customizable midline (color & line style)
Individual text color controls for labels within each box
Multi-Timeframe Compatible: Designed to adapt cleanly across intraday and higher timeframes (e.g. 1H, 4H, 1D).
No Future Drawing or Repainting: All ranges are fixed and updated only at the start of each new trading day.
🎯 Use Cases
Identify potential liquidity zones based on institutional memory
Confluence zones for SMT, FVGs, or order blocks
Anchored bias levels for swing/trend confirmation
Integration with your own ICT trading model or algo logic
This indicator is a foundational visual aid for traders who align with smart money concepts and want to maintain a structured, rule-based approach to tracking historical institutional price behavior.
Cycles

Dynamic Gap Probability ToolDynamic Gap Probability Tool measures the percentage gap between price and a chosen moving average, then analyzes your chart history to estimate the likelihood of the next candle moving up or down. It dynamically adjusts its sample size to ensure statistical robustness while focusing on the exact deviation level.
Originality and Value:
• Combines gap-based analysis with dynamic sample aggregation to balance precision and reliability.
• Automatically extends the sample when exact matches are scarce, avoiding misleading signals on rare extreme moves.
• Provides real “next-candle” probabilities based on historical occurrences rather than fixed thresholds or untested heuristics.
• Adds value by giving traders an evidence-based edge: you see how similar past deviations actually played out.
How It Works:
1. Calculate gap = (close – moving average) / moving average * 100.
2. Round the absolute gap to nearest percent (X%).
3. Count historical bars where gap ≥ X% above or ≤ –X% below.
4. If exact X% count is below the minimum occurrences threshold, include gaps at X+1%, X+2%, etc., until threshold is reached.
5. Compute “next-candle” green vs. red probabilities from the aggregated sample.
6. Display current gap, sample size, green probability, and red probability in a table.
Inputs:
• Moving Average Type (SMA, EMA, WMA, VWMA, HMA, SMMA, TMA)
• Moving Average Period (default 200)
• Minimum Occurrences Threshold (default 50)
• Table position and styling options
Examples:
• If price is 3% above the 200-period SMA and 120 occurrences ≥3% are found, with 84 green next candles (70%) and 36 red (30%), the script displays “3% | 120 | 70% green | 30% red.”
• If price is 8% below the SMA but only 20 exact matches exist, the script will include 9% and 10% gaps until it reaches 50 samples, then calculate probabilities from that broader set.
Why It’s Useful:
• Mean-reversion traders see green-probability signals at extreme overbought or oversold levels.
• Trend-followers identify continuation likelihood when red probability is high.
• Risk managers gauge reliability by inspecting sample size before acting on any signal.
Limitations:
• Historical probabilities do not guarantee future performance.
• Results depend on timeframe and symbol, backtest with your data before trading.
• Use realistic slippage and commission when overlaying on strategy scripts.

15min intervalsindicator displays 4 15 minute intervals within the hour. this simple indicator can be used for effective scalping.

CipherMatrix Dashboard (MarketCipher B)Pre-compute MarketCipher-B values for each fixed timeframe (5 m, 15 m, 30 m, 60 m, 4 H, Daily).
Pass those values into plotRow() instead of calling request.security() inside the helper—removes the style warning.
Added explicit range parameters to table.clear(dash, 0, 0, 2, 6) to satisfy v6’s argument requirement.
This version should compile without the previous warnings/errors. Swap in your real MarketCipher-B histogram when you’re ready, and the dashboard is good to go!

Swing Structure [HH HL LH LL + 😎 + 👻]Tracks real-time swing structure (HH, HL, LH, LL) using confirmed pivot points. Shows ghost 👻 and cool 😎 emojis at key higher low setups. Great for identifying breakout retests and trend continuation zones. No repaint.

Breakout LabelsThis script labels the highest price of the lowest candle over a period of time. It then labels any bullish breakouts where the close price is higher than the high of the lowest candle.

Altcoin Liquidity Flow Score - Big Moves Only//@version=6
indicator("Altcoin Liquidity Flow Score - Big Moves Only", overlay=false)
// Pull weekly macro data
walcl = request.security("FRED:WALCL", "W", close)
rrp = request.security("FRED:RRPONTSYD", "W", close)
tga = request.security("FRED:WDTGAL", "W", close)
hyg = request.security("AMEX:HYG", "W", close)
total3 = request.security("CRYPTOCAP:TOTAL3", "W", close)
usdt_d = request.security("CRYPTOCAP:USDT.D", "W", close)
// Calculate week-over-week change
delta_liquidity = ta.change(walcl + rrp - tga)
delta_rrp = ta.change(rrp)
delta_hyg = ta.change(hyg)
delta_total3 = ta.change(total3)
delta_usdt_d = ta.change(usdt_d)
// Compute raw score
raw_score = delta_liquidity - delta_rrp + delta_hyg + delta_total3 - delta_usdt_d
// Apply 3-week smoothing
score = ta.ema(raw_score, 3)
// Define threshold for major liquidity shift
threshold = 2.0
// Plot score + background for only strong signals
plot(score, title="Liquidity Flow Score (Smoothed)", color=color.teal, linewidth=2)
hline(0, "Zero Line", color=color.gray)
bgcolor(score > threshold ? color.new(color.green, 85) : score < -threshold ? color.new(color.red, 85) : na)

Panchak 369This indicator highlights Panchak Dates based on Vedic astrology, marking specific lunar dates (Tithis) that occur when the Moon transits from Dhanishta to Revati Nakshatra. These days are considered astrologically sensitive and are traditionally avoided for initiating important activities.

SMC Simple Multi-TF High/Low (w/ Labels)How this works:
• Each line is plotted only on the current candle (not extended right).
• Each label sits at the very end of the line, right on the price/candle edge.
• Only the latest high/low for each type is shown and updated live.
• No future bars! Everything stays “anchored” to the real candle.


Gann Ultimate Time-Price Squares Method V 1.0This Script is an outcome of my Passion towards Gann Theory and his Methodology towards Trading.
The Script is still Evolving.So wait for more updates....
# Complete Trading Guide: Gann Time-Price Squares Indicator
## 🎯 Core Trading Philosophy
**Gann's Key Principle**: "When time and price come together, a change in trend occurs."
Your indicator identifies these critical moments where **Time = Price**, creating high-probability trading opportunities.
---
## 📊 Setup & Configuration
### Recommended Settings by Timeframe
| Timeframe | Pivot Lookback | Min Price Move | Tolerance | Use Case |
|-----------|---------------|----------------|-----------|----------|
| **1-5 min** | 5-8 bars | 0.5-1.0 | 1.0-2.0 | Scalping |
| **15-30 min** | 8-12 bars | 1.0-3.0 | 1.5-2.5 | Day Trading |
| **1-4 hour** | 10-15 bars | 2.0-5.0 | 2.0-3.0 | Swing Trading |
| **Daily** | 15-25 bars | 5.0-20.0 | 3.0-5.0 | Position Trading |
### Initial Setup Steps
1. **Add indicator** to your chart
2. **Set lookback period** based on your timeframe
3. **Adjust tolerance** - start with 2.0 and fine-tune
4. **Enable all visualizations** initially
5. **Position info table** where it doesn't block price action
---
## 🚀 Trading Strategies
### Strategy 1: Square Completion Reversal Trading
#### **Long Entry Setup**
```
CONDITIONS:
✅ Bullish square completes (green box appears)
✅ Info table shows "✅ COMPLETED" status
✅ Price bounces off square's bottom edge
✅ Volume increases on bounce
✅ RSI < 30 (oversold confirmation)
ENTRY: Market buy when price breaks above square's top edge
STOP: Below square's bottom edge (-2 ATR)
TARGET: Next resistance level or 1:2 Risk/Reward
```
#### **Short Entry Setup**
```
CONDITIONS:
✅ Bearish square completes (red box appears)
✅ Info table shows "✅ COMPLETED" status
✅ Price rejects square's top edge
✅ Volume increases on rejection
✅ RSI > 70 (overbought confirmation)
ENTRY: Market sell when price breaks below square's bottom edge
STOP: Above square's top edge (+2 ATR)
TARGET: Next support level or 1:2 Risk/Reward
```
### Strategy 2: Gann Angle Trend Following
#### **1x1 Angle (45°) - The Master Angle**
- **Most Important**: This is Gann's primary trend line
- **Bullish**: Price above 1x1 = uptrend intact
- **Bearish**: Price below 1x1 = downtrend intact
- **Break**: 1x1 angle break = major trend change
#### **Multi-Angle Confluence Trading**
```
STRONG BULLISH SIGNAL:
✅ Price above 1x1 angle (45°)
✅ Bouncing off 2x1 angle (support)
✅ Volume increasing
✅ Multiple angles pointing up
ENTRY: Buy on 2x1 angle bounce
STOP: Below 1x2 angle
TARGET: Next angle resistance
```
### Strategy 3: Projection Trading (Forming Squares)
#### **Anticipation Strategy**
```
SETUP IDENTIFICATION:
👀 Info table shows "⚡ FORMING" status
👀 Progress bar > 70%
👀 P/T Ratio approaching 1.00
👀 Price approaching projected completion zone
ENTRY PREPARATION:
- Set alerts for projected completion levels
- Prepare for reversal at projection zone
- Watch for volume confirmation
- Monitor momentum indicators
```
## 📈 Step-by-Step Trading Process
### Phase 1: Market Analysis (Before Trading)
1. **Check Market Trend**: Look at info table trend indicator
2. **Identify Active Pivots**: Note last significant high/low
3. **Assess Volatility**: High volatility = larger stops needed
4. **Review Completed Squares**: These become support/resistance zones
### Phase 2: Trade Setup Identification
1. **Monitor Forming Squares**: Watch progress bars in info table
2. **Check Gann Angles**: Are they supporting or opposing your bias?
3. **Confirm with Volume**: Look for volume spikes at key levels
4. **Set Alerts**: Use TradingView alerts for completion zones
### Phase 3: Trade Execution
1. **Wait for Confirmation**: Don't trade on projections alone
2. **Enter on Breakout**: Price breaking square boundaries
3. **Set Stops Immediately**: Use square edges as stop levels
4. **Scale Out**: Take partial profits at angle intersections
### Phase 4: Trade Management
1. **Trail Stops**: Use Gann angles as trailing stop levels
2. **Monitor Progress**: Watch for new square formations
3. **Exit Signals**: New squares in opposite direction
4. **Review Performance**: Analyze win/loss against square accuracy
---
## 🎯 High-Probability Setups
### Setup A: Double Confirmation
```
BULLISH EXAMPLE:
1. Bullish square completes at major support
2. Price bounces off 1x1 Gann angle
3. Volume surge confirms reversal
4. RSI divergence present
PROBABILITY: 75-80%
RISK/REWARD: 1:3 typical
```
### Setup B: Angle Breakout
```
BEARISH EXAMPLE:
1. Price breaks below 1x1 angle
2. Bearish square forming below break
3. Multiple angles now resistance
4. Volume confirms breakdown
PROBABILITY: 70-75%
RISK/REWARD: 1:2.5 typical
```
### Setup C: Time Cycle Convergence
```
REVERSAL EXAMPLE:
1. Square completion at time cycle high/low
2. Multiple Gann angles converging
3. Momentum divergence
4. Volume climax
PROBABILITY: 80-85%
RISK/REWARD: 1:4 possible
```
---
## ⚠️ Risk Management Rules
### Position Sizing
- **Conservative**: 1-2% risk per trade
- **Aggressive**: 2-3% risk per trade
- **Never exceed**: 5% total portfolio risk
### Stop Loss Guidelines
- **Completed Squares**: Opposite edge + 1 ATR
- **Gann Angles**: Below/above angle + 0.5 ATR
- **Projections**: 50% of square height
### Take Profit Targets
- **Target 1**: Next Gann angle (1:1 R/R)
- **Target 2**: Next completed square (1:2 R/R)
- **Target 3**: Major S/R level (1:3 R/R)
---
## 📊 Reading the Info Table for Trading
### Market Trend Section
```
📈 BULLISH → Look for long setups
📉 BEARISH → Look for short setups
➡️ NEUTRAL → Wait for direction
```
### Volatility Status
```
🔥 HIGH → Larger stops needed
⚡ ELEVATED → Normal stops
😴 LOW → Tighter stops possible
📊 NORMAL → Standard approach
```
### Square Progress Monitoring
```
✅ COMPLETED → Ready to trade
⚡ FORMING → Prepare for setup
🔥 ACTIVE → Monitor closely
⏳ WAITING → No immediate action
```
### P/T Ratio Interpretation
```
🎯 Perfect (0.8-1.2) → High probability setup
⚡ Good (0.6-1.4) → Moderate probability
⚠️ Watch (outside range) → Lower probability
```
---
## 🔄 Common Trading Scenarios
### Scenario 1: Trend Continuation
**Setup**: Price pulls back to completed square in uptrend
**Action**: Buy at square support with 1x1 angle confirmation
**Management**: Trail stop below each new square formation
### Scenario 2: Reversal Trading
**Setup**: Multiple squares complete at major S/R
**Action**: Fade the move when price rejects square edges
**Management**: Quick profits, tight stops
### Scenario 3: Breakout Trading
**Setup**: Price consolidates in square, then breaks out
**Action**: Trade breakout direction with volume confirmation
**Management**: Use opposite square edge as stop
---
## 📱 Alert Setup Recommendations
### Critical Alerts
1. **Square Completion**: "Gann Square Completed - Check for reversal"
2. **1x1 Angle Break**: "Master angle broken - Trend change possible"
3. **Projection Reached**: "Forming square at 90% - Prepare for reversal"
4. **Multi-Angle Touch**: "Price at angle confluence - High probability setup"
---
Remember: **Gann analysis is both art and science**. The indicator provides the mathematical framework, but successful trading requires patience, discipline, and continuous learning. Start with small positions while you master the methodology!

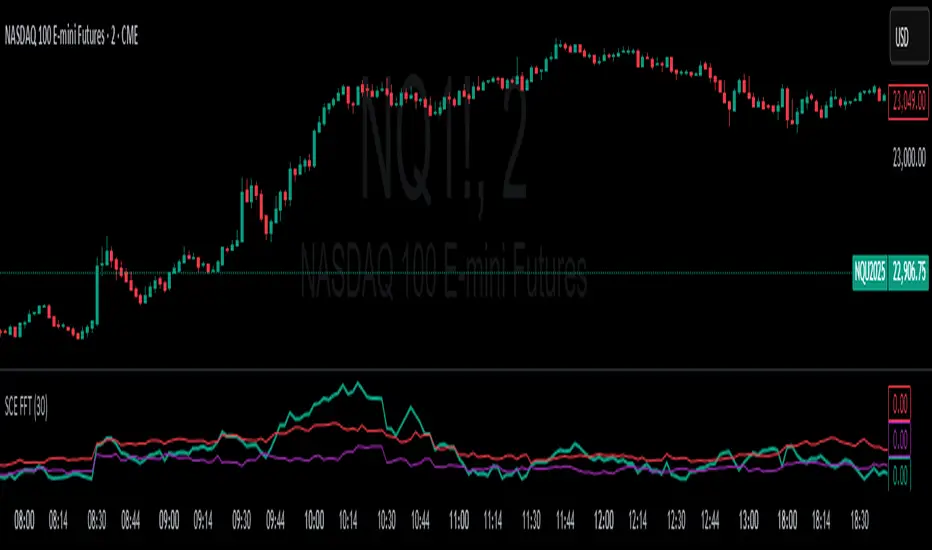
Fast Fourier Transform [ScorsoneEnterprises]The SCE Fast Fourier Transform (FFT) is a tool designed to analyze periodicities and cyclical structures embedded in price. This is a Fourier analysis to transform price data from the time domain into the frequency domain, showing the rhythmic behaviors that are otherwise invisible on standard charts.
Instead of merely observing raw prices, this implementation applies the FFT on the logarithmic returns of the asset:
Log Return(𝑚) = log(close / close )
This ensures stationarity and stabilizes variance, making the analysis statistically robust and less influenced by trends or large price swings.
For a user-defined lookback window 𝑁:
Each frequency component 𝑘 is computed by summing real and imaginary projections of log-returns multiplied by complex exponential functions:
𝑒^−𝑖𝜃 = cos(𝜃)−𝑖sin(𝜃)
where:
θ = 2πkm / N
he result is the magnitude spectrum, calculated as:
Magnitude(𝑘) = sqrt(Real_Sum(𝑘)^2 + Imag_Sum(𝑘)^2)
This spectrum represents the strength of oscillations at each frequency over the lookback period, helping traders identify dominant cycles.
Visual Analysis & Interpretation
To give traders context for the FFT spectrum’s values, this script calculates:
25th Percentile (Purple Line)
Represents relatively low cyclical intensity.
Values below this threshold may signal quiet, noisy, or trendless periods.
75th Percentile (Red Line)
Represents heightened cyclical dominance.
Values above this threshold may indicate significant periodic activity and potential trend formation or rhythm in price action.
The FFT magnitude of the lowest frequency component (index 0) is plotted directly on the chart in teal. Observing how this signal fluctuates relative to its percentile bands provides a dynamic measure of cyclical market activity.
Chart examples
In this NYSE:CL chart, we see the regime of the price accurately described in the spectral analysis. We see the price above the 75th percentile continue to trend higher until it breaks back below.
In long trending markets like NYSE:PL has been, it can give a very good explanation of the strength. There was confidence to not switch regimes as we never crossed below the 75th percentile early in the move.
The script is also usable on the lower timeframes. There is no difference in the usability from the different timeframes.
Script Parameters
Lookback Value (N)
Default: 30
Defines how many bars of data to analyze. Larger N captures longer-term cycles but may smooth out shorter-term oscillations.

SnD SCANNER V 1.0This is a test script, will update on going.
This Indicator will help you find the unfilled order in the market.
Such as RBR DBR or DBD RBD.
Still on going test, so I will update this on the run.

[TH] Advanced SMC/ICT Strategy (Condark2)### **Indicator Settings (English)**
This script is designed to analyze market structure and identify trading opportunities based on Smart Money Concept (SMC) and Inner Circle Trader (ICT) principles. Users can customize the following settings:
#### **Timeframe Settings**
* **Higher Timeframe (HTF) - For Main Structure:** Sets the higher timeframe used to analyze the main market structure (e.g., the primary trend). The default is 5 minutes.
* **Lower Timeframe (LTF):** This is the current chart timeframe you are on, used for more precise entry timing.
---
#### **Market Structure Settings**
* **Swing Lookback (HTF/LTF):** Defines the number of candles used to identify Swing Highs and Swing Lows on both the HTF and LTF.
* **Break of Structure (BOS) Line Color:** Sets the color for lines indicating the price has broken the previous structure in the direction of the trend.
* **Change of Character (CHoCH) Line Color:** Sets the color for lines indicating a potential change in the market trend.
---
#### **Point of Interest (POI) Settings**
* **Order Block Color (Bullish/Bearish):** Sets the color for "Order Block" zones (areas with anticipated significant buy or sell orders) for both uptrends and downtrends.
* **Show Premium/Discount Zones:** Toggles the display of expensive (Premium) and cheap (Discount) price zones, calculated from the last swing, to aid in deciding whether to look for buy or sell setups.
---
#### **Trade & Risk Management Settings**
* **Entry Type:** This is a key setting that defines your entry strategy. There are four options:
1. **Confirmation Candle:** Waits for a confirmation candle to form within the Order Block before entering (most conservative).
2. **Instant OB Edge Entry (Limit Entry):** Sets a limit order to enter as soon as the price touches the edge of the Order Block.
3. **50% of OB Entry (Aggressive Limit):** Sets a limit order at the midpoint of the Order Block for a better price, but with higher risk.
4. **Confirmation + Candle SL (Aggressive):** Waits for a confirmation candle and then places the Stop Loss right at the wick of that candle. This is the most aggressive entry style.
* **Stop Loss Placement:** Determines where the stop loss is placed, based on the LTF Order Block, the last LTF swing, or the last HTF swing. (This is ignored if using the "Aggressive SL" entry type).
* **Take Profit Mode:** Sets the profit target, which can be an HTF Liquidity level or a fixed Risk/Reward Ratio from 1R to 5R.
* **SL Buffer (multiplied by ATR):** Adds a small buffer to the Stop Loss, calculated using the ATR, to help prevent being stopped out by minor volatility.
* **Number of Trade History to Display:** Sets how many past trades are shown on the performance dashboard.
---
#### **Display Settings**
* **Enable Alerts:** Toggles alerts for new trade signals and when a trade is closed (for either a win or a loss).
***
### **คำอธิบายการตั้งค่า (ภาษาไทย)**
สคริปต์นี้ถูกออกแบบมาเพื่อวิเคราะห์โครงสร้างตลาดและหาจังหวะเข้าเทรดตามหลักการ Smart Money Concept (SMC) และ Inner Circle Trader (ICT) โดยผู้ใช้สามารถปรับแต่งค่าต่างๆ ได้ดังนี้
#### **การตั้งค่า Timeframe**
* **Higher Timeframe (HTF) - สำหรับโครงสร้างหลัก:** ใช้สำหรับกำหนดไทม์เฟรมที่ใหญ่กว่าเพื่อวิเคราะห์โครงสร้างตลาดหลัก (เช่น แนวโน้มหลัก) ค่าเริ่มต้นคือ 5 นาที
* **Lower Timeframe (LTF):** คือไทม์เฟรมปัจจุบันของกราฟที่คุณเปิดอยู่ ใช้สำหรับหาจังหวะการเข้าเทรดที่ละเอียดขึ้น
---
#### **การตั้งค่าโครงสร้างตลาด (Market Structure)**
* **ระยะมองหา Swing (HTF/LTF):** กำหนดจำนวนแท่งเทียนที่จะใช้ในการระบุจุดสูงสุด (Swing High) และจุดต่ำสุด (Swing Low) ทั้งในไทม์เฟรมหลักและไทม์เฟรมปัจจุบัน
* **สีเส้น Break of Structure (BOS):** กำหนดสีของเส้นที่บ่งบอกว่าราคาสามารถทะลุโครงสร้างเดิมไปในทิศทางเดียวกับแนวโน้ม
* **สีเส้น Change of Character (CHoCH):** กำหนดสีของเส้นที่บ่งบอกว่าราคาเริ่มมีการเปลี่ยนทิศทางของแนวโน้ม
---
#### **การตั้งค่าจุดสนใจ (Point of Interest)**
* **สี Order Block (Bullish/Bearish):** กำหนดสีของโซน "Order Block" (โซนที่คาดว่ามีคำสั่งซื้อขายรออยู่) สำหรับแนวโน้มขาขึ้นและขาลง
* **แสดงโซน Premium/Discount:** เปิด/ปิดการแสดงโซนราคาแพง (Premium) และราคาถูก (Discount) ซึ่งคำนวณจาก Swingล่าสุด เพื่อช่วยในการตัดสินใจว่าควรหาจังหวะซื้อหรือขาย
---
#### **การตั้งค่าการเข้าเทรดและจัดการความเสี่ยง**
* **รูปแบบการเข้าเทรด (Entry Type):** เป็นหัวใจสำคัญในการกำหนดกลยุทธ์ มี 4 รูปแบบให้เลือก:
1. **ยืนยันด้วยแท่งเทียน (Confirmation):** รอแท่งเทียนยืนยันการกลับตัวในโซน Order Block ก่อนเข้าเทรด (ปลอดภัยที่สุด)
2. **เข้าที่ขอบ OB ทันที (Limit Entry):** ตั้งคำสั่งรอเข้าเทรดที่ขอบของโซน Order Block ทันทีเมื่อราคาวิ่งเข้ามา
3. **เข้าที่ 50% ของ OB (Aggressive Limit):** ตั้งคำสั่งรอเข้าเทรดที่จุดกึ่งกลางของโซน Order Block เพื่อให้ได้ราคาที่ดีขึ้นแต่เสี่ยงกว่า
4. **ยืนยัน + SL ที่แท่งเทียน (Aggressive):** รอแท่งเทียนยืนยัน แล้ววางจุดตัดขาดทุน (Stop Loss) ไว้ที่ปลายไส้ของแท่งเทียนนั้นทันที เป็นรูปแบบที่ดุดันและมีความเสี่ยงสูงสุด
* **รูปแบบการวาง Stop Loss:** กำหนดตำแหน่งของจุดตัดขาดทุน โดยอิงจาก Order Block, Swing ล่าสุดใน LTF, หรือ Swing ล่าสุดใน HTF (ตัวเลือกนี้จะถูกข้ามไปหากเลือกเข้าเทรดแบบ "Aggressive SL")
* **รูปแบบ Take Profit:** กำหนดเป้าหมายการทำกำไร โดยสามารถเลือกเป็นจุดสภาพคล่อง (Liquidity) ใน HTF หรือกำหนดเป็นอัตราส่วนความเสี่ยงต่อผลตอบแทน (Risk/Reward Ratio) ตั้งแต่ 1R ถึง 5R
* **ระยะห่าง SL (คูณด้วย ATR):** เพิ่มระยะห่างของ Stop Loss เล็กน้อยโดยคำนวณจากค่า ATR เพื่อป้องกันการถูกเกี่ยว SL โดยไม่จำเป็น
* **จำนวนประวัติการเทรดที่จะแสดง:** กำหนดจำนวนผลการเทรดย้อนหลังที่จะแสดงบน Dashboard
---
#### **การตั้งค่าการแสดงผล**
* **เปิดใช้งานการแจ้งเตือน:** สามารถเปิด/ปิดการแจ้งเตือนเมื่อมีสัญญาณการเข้าเทรด หรือเมื่อการเทรดปิดลง (ทั้งกำไรและขาดทุน)

TVI-3 Z-Score: MA + VWAP + BB Composite🔧 Overview:
It combines:
Z-score of price relative to the 200-period simple moving average (MA)
Z-score of price relative to the 200-period VWAP (volume-weighted average price)
Z-score of Bollinger Band width
The result is an average of these three Z-scores, plotted as a composite indicator for identifying overvalued and undervalued conditions.

Day and DateA simple indicator that show day and date at the start of each day. This is usefull in case you are downloading charts or get confused when studying past charts for expiry and non expiry day actions.

BTC uptrend downtrendThe "BTC Uptrend Downtrend" indicator is a technical analysis tool designed to help traders identify upward (uptrend) or downward (downtrend) trends of Bitcoin on trading pairs such as BTCUSDT and BTCUSD. It is built on the TradingView platform.
Key Features:
Trend Display: The indicator marks uptrend phases in green and downtrend phases in red, allowing users to easily identify the market direction.
Customizable Time Frames: Users can choose different time frames (e.g., weekly or monthly) to analyze long-term or short-term trends.
Bitcoin-Focused: The indicator is specifically optimized for Bitcoin trading pairs, ensuring accuracy and relevance when applied to BTCUSDT or BTCUSD.
Intuitive Interface: Signals are displayed as background colors on the chart, helping traders quickly recognize trend changes without complex analysis.
Benefits:
Helps traders identify potential entry points (when an uptrend begins) or exit points (when a downtrend appears).
Easy to use, suitable for both beginners and experienced traders.
Focused on Bitcoin, making it ideal for those who trade or invest in BTC.
This indicator is a useful tool for tracking Bitcoin market trends without needing to dive deep into complex technical details. If you'd like to learn more about how to use or customize it, feel free to ask!

minchang volume tradingCondition
Point color
Volume ≥ 3× MA(24)
Violet
Volume ≥ 1.5× MA(24)
Red
Volume < 1.5× MA(24) & bullish
White
Volume < 1.5× MA(24) & bearish
Black

Nến Tô Màu Theo Volume / MA(21)Condition
Point color
Volume ≥ 3× MA(24)
Violet
Volume ≥ 1.5× MA(24)
Red
Volume < 1.5× MA(24) & bullish
White
Volume < 1.5× MA(24) & bearish
Black

Babanov_ETHUSDT V2🧪 Deep Backtest Results (ETH 5-Min Strategy)
Backtest conducted on ETHUSDT.P (Bybit) using a 5-minute chart timeframe over several weeks of data.
! imgur.com
⚠️ Важно: Инструкции за правилна употреба на скрипта!
Ако искате да използвате този скрипт с webhook alerts за автоматична търговия, моля, обърнете внимание на следните стъпки:
✅ 1. Активирайте "Live Trading Mode"
Преди да създадете какъвто и да е alert, отидете в таба "Inputs" и задължително активирайте опцията "Live Trading Mode". Без нея скриптът няма да изпраща правилни сигнали.
✅ 2. Въведете търговската сума в USD
В таба "Properties", въведете сумата в USD, която ботът ще използва за търговия с ETH.
- Препоръчително е сумата да бъде такава, която може да бъде разделена на 50 (например 50, 100, 150, 200 и т.н.), за да се гарантира коректно управление на позициите и обемите при търговия.
✅ 3. Препоръчителна платформа: Bybit - BYBIT:ETHUSDT.P
Скриптът е оптимизиран и тестван за търговия на Bybit. Използването му на други платформи може да доведе до различни резултати, тъй като графиките и ценовите движения може да се различават.
-----------------------------------------------------------------------------------------------
⚠️ Important: Instructions for Proper Use of This Script
If you want to use this script with webhook alerts for automated trading, please follow the steps below carefully:
✅ 1. Enable "Live Trading Mode"
Before creating any alerts, go to the "Inputs" tab and make sure to enable the "Live Trading Mode" option.
Without it, the script will not generate correct trading signals.
✅ 2. Enter Your Trading Amount in USD
In the "Properties" tab, enter the amount in USD that the bot will use for ETH trading.
It is strongly recommended to enter an amount that can be divided by 50 (e.g., 50, 100, 150, 200, etc.) to ensure proper position sizing and trade management.
✅ 3. Recommended Exchange: Bybit - BYBIT:ETHUSDT.P
The script is optimized and tested specifically for Bybit.
Using it on other exchanges may result in different outcomes due to variations in chart data and price movements.

Previous 10 Weekly Highs/LowsNewer vweionnnnnnnnnnnnnnnnnnnnnnnnnnnnnnnnnnnnnnnnnnnnnnnnnnnnnnnnnnnnnnn

Previous 10 Weekly Highs/LowscilcvieowhvioewfvhgweiofgheaoifgascvgaucgfvUfgiocfgacfbaofcgaeo8gfhhfioqlkea
