[T] FVG Candles with Distance PriorityThis script will mark out historical FVG candles that are closest to where price is currently.
It will draw a box around the candle body at high/low and midpoint (CE) and extend the boxes right to current price.
The distance priority setting will mark historical FVGs closest to where price is currently at; for the max defined number of boxes.
The levels do not have an option to be marked as mitigated - as this indicator is intended for HTF charts, where these levels are considered "permanent" support and resistance levels.
Cycles

VWAP + HL + EMAsVWAP
Yesterday’s High and Low
Today’s High and Low
EMAs (20, 50, 100, 200)
VWAP
Yesterday’s High and Low
Today’s High and Low
EMAs (20, 50, 100, 200)

My script//@version=5
indicator("NQ Fib + True Open Strategy ", overlay=true, max_lines_count=500)
// === Inputs ===
fibLevel1 = input.float(0.79, "79% Fib Level", minval=0, maxval=1, step=0.01)
fibLevel2 = input.float(0.85, "85% Fib Level", minval=0, maxval=1, step=0.01)
trueOpenTime = input.session("0930-1000", "True Open Time (EST)")
useVolumeFilter = input(true, "Use Volume Filter")
minVolumeRatio = input.float(1.5, "Volume Spike Ratio", minval=1, step=0.1)
trendLength = input.int(5, "Trend Leg Length", minval=1)
// === Trend Detection ===
upTrend = ta.highest(high, trendLength) > ta.highest(high, trendLength) and
ta.lowest(low, trendLength) > ta.lowest(low, trendLength)
downTrend = ta.lowest(low, trendLength) < ta.lowest(low, trendLength) and
ta.highest(high, trendLength) < ta.highest(high, trendLength)
// === Fibonacci Levels ===
swingHigh = ta.highest(high, 10)
swingLow = ta.lowest(low, 10)
priceRange = swingHigh - swingLow
fib79 = swingLow + priceRange * fibLevel1
fib85 = swingLow + priceRange * fibLevel2
// === True Open Price ===
isTrueOpenTime = time(timeframe.period, trueOpenTime)
var float trueOpenPrice = na
if isTrueOpenTime
trueOpenPrice := open
// === Volume Filter ===
volumeAvg = ta.sma(volume, 20)
validVolume = not useVolumeFilter or (volume >= volumeAvg * minVolumeRatio)
// === Entry Conditions ===
nearFib79 = math.abs(close - fib79) <= ta.atr(14) * 0.25
nearFib85 = math.abs(close - fib85) <= ta.atr(14) * 0.25
nearOpenPrice = not na(trueOpenPrice) and math.abs(close - trueOpenPrice) <= ta.atr(14) * 0.25
buySignal = upTrend and (nearFib79 or nearFib85) and nearOpenPrice and validVolume
sellSignal = downTrend and (nearFib79 or nearFib85) and nearOpenPrice and validVolume
// === Plots ===
plot(fib79, "79% Fib", color.new(color.blue, 0), linewidth=1)
plot(fib85, "85% Fib", color.new(color.purple, 0), linewidth=1)
plot(trueOpenPrice, "True Open Price", color.new(color.orange, 0), linewidth=2)
plotshape(buySignal, "Buy", shape.triangleup, location.belowbar, color.new(color.green, 0), size=size.small)
plotshape(sellSignal, "Sell", shape.triangledown, location.abovebar, color.new(color.red, 0), size=size.small)

HMA Crossover + ATR + Curvature (Long & Short)📏 Hull Moving Averages (Trend Filters)
- fastHMA = ta.hma(close, fastLength)
- slowHMA = ta.hma(close, slowLength)
These two HMAs act as dynamic trend indicators:
- A bullish crossover of fast over slow HMA signals a potential long setup.
- A bearish crossunder triggers short interest.
⚡️ Curvature (Acceleration Filter)
- curv = ta.change(ta.change(fastHMA))
This calculates the second-order change (akin to the second derivative) of the fast HMA — effectively the acceleration of the trend. It serves as a filter:
- For long entries: curv > curvThresh (positive acceleration)
- For short entries: curv < -curvThresh (negative acceleration)
It helps eliminate weak or stagnating moves by requiring momentum behind the crossover.
📈 Volatility-Based Risk Management (ATR)
- atr = ta.atr(atrLength)
- stopLoss = atr * atrMult
- trailStop = atr * trailMult
These define your:
- Initial stop loss: scaled to recent volatility using ATR and atrMult.
- Trailing stop: also ATR-scaled, to lock in gains dynamically as price moves favorably.
💰 Position Sizing via Risk Percent
- capital = strategy.equity
- riskCapital = capital * (riskPercent / 100)
- qty = riskCapital / stopLoss
This dynamically calculates the position size (qty) such that if the stop loss is hit, the loss does not exceed the predefined percentage of account equity. It’s a volatility-adjusted position sizing method, keeping your risk consistent regardless of market conditions.
📌 Execution Logic
- Long Entry: on bullish HMA crossover with rising curvature.
- Short Entry: on bearish crossover with falling curvature.
- Exits: use ATR-based trailing stops.
- Position is closed when trend conditions reverse (e.g., bearish crossover exits the long).
This framework gives you:
- Trend-following logic (via HMAs)
- Momentum confirmation (via curvature)
- Volatility-aware execution and exits (via ATR)
- Risk-controlled dynamic sizing
Want to get surgical and test what happens if we use curvature on the difference between HMAs instead? That might give some cool insights into trend strength transitions.

MSFT Bias at NYSE Open (9:30 ET)have an 85% bias accuracy rate with this indicator. wait for market open

MetaSigmaMetaSigma is a cutting-edge indicator designed for traders who thrive on contrarian strategies. Built on the core principle of mean reversion, MetaSigma identifies statistically significant price extremes and signals potential turning points before the market corrects itself.


Mutant Cycle - Volatility DriverMutant cycle _ volatility Driver
Punti di volatilità settimanali massimo e minimi forti

MOE²: Sniper Entry Signal SystemMOE² General is a closed source indicator designed for active traders in Forex, Crypto, Metals, and Indices. It helps define entries, stop losses, and profit targets by combining classic price action with layered technical analysis.
The script integrates traditional tools such as exponential moving averages, volume surges, and candle pattern recognition. These are used together to validate market structure and highlight actionable trade zones. Entry areas are visually mapped on the chart and paired with logical exit levels to support clarity in decision making.
It is calibrated for short term strategies and performs best on 5 minute to 1 hour timeframes. Signal frequency is intentionally limited to maintain quality over quantity and promote disciplined trade selection.
MOE² General is built for traders who value clean visuals, straightforward logic, and risk awareness. It provides structured guidance without relying on lagging confirmations alone.
All logic is embedded within the tool. No external references or outside dependencies are required.

MA Bands with Dynamic ColorsThe chart displays the 50-day, 100-day, and 200-day moving averages (MAs).
When the 50-day MA is above both the 100-day and 200-day MAs, the chart turns green, indicating a bullish trend with increasing positive momentum.
Conversely, when the 50-day MA is below the 100-day and 200-day MAs, the chart turns red, signaling a bearish trend with negative momentum.
This color-coded system, with green and red clouds, helps traders identify the trend direction and gauge positive or negative momentum for potential trading opportunities.

3-Candle HH/HL or LH/LL (Number Labels Over Candles)What This Script Does:
This Pine Script detects 3 consecutive candlesticks that show:
Higher Highs and Higher Lows → a bullish structure
Lower Highs and Lower Lows → a bearish structure
When such a pattern is found, the script:
Marks each of the 3 candles with a number: 1, 2, and 3
Labels appear centered on each candle (at the close price)
You can adjust:
Label size (tiny → huge)
Background color (bullish/bearish)
Text color
Example:
If candles form:
Candle A: higher high & higher low
Candle B: higher than A
Candle C: higher than B
Then you’ll see 1, 2, 3 labels on those candles in green (or your selected color).
Same goes for a bearish pattern in red.

Global Risk Matrix [QuantAlgo]🟢 Overview
The Global Risk Matrix is a comprehensive macro risk assessment tool that aggregates multiple global financial indicators into a unified risk sentiment framework. It transforms diverse economic data streams (from currency strength and liquidity measures to volatility indices and commodity prices) into standardized Z-Score readings to identify market regime shifts across risk-on and risk-off conditions.
The indicator displays both a risk oscillator showing weighted average sentiment and a dynamic 2D matrix visualization that plots signal strength against momentum to reveal current market phase and historical evolution. This helps traders and investors understand broad market conditions, identify regime transitions, and align their strategies with prevailing macro risk environments across all asset classes.
🟢 How It Works
The indicator employs Z-Score normalization across various global macro components, each representing distinct aspects of market liquidity, sentiment, and economic health. Raw data from sources like DXY, S&P 500, Fed liquidity, global M2 money supply, VIX, and commodities undergoes statistical standardization. Several components are inverted (USDT.D, DXY, VIX, credit spreads, treasury bonds, gold) to align with risk-on interpretation, where positive values indicate bullish conditions.
This unique system applies configurable weights to each component based on selected asset class presets (Crypto Investor/Trader, Stock Trader, Commodity Trader, Forex Trader, Risk Parity, or Custom), creating a weighted average Z-Score. It then analyzes both signal strength and momentum direction to classify market conditions into four distinct phases: Risk-On (positive signal, rising momentum), Risk-Off (negative signal, falling momentum), Recovery (negative signal, rising momentum), and Weakening (positive signal, falling momentum). The 2D matrix visualization plots these dimensions with historical trail tracking to show regime evolution over time.
🟢 How to Use
1. Risk Oscillator Interpretation and Phase Analysis
Positive Territory (Above Zero) : Indicates risk-on conditions with capital flowing toward growth assets and higher risk tolerance
Negative Territory (Below Zero) : Signals risk-off sentiment with capital seeking safety and defensive positioning
Extreme Levels (±2.0) : Represent statistically significant deviations that often precede regime reversals or trend exhaustion
Zero Line Crosses : Mark critical transitions between risk regimes, providing early signals for portfolio rebalancing
Phase Color Coding : Green (Risk-On), Red (Risk-Off), Blue (Recovery), Yellow (Weakening) for immediate regime identification
2. Risk Matrix Visualization and Trail Analysis
Current Position Marker (⌾) : Shows real-time location in the risk/momentum space for immediate situational awareness
Historical Trail : Connected path showing recent market evolution and regime transition patterns
Quadrant Analysis : Risk-On (upper right), Risk-Off (lower left), Recovery (lower right), Weakening (upper left)
Trail Patterns : Clockwise rotation typically indicates healthy regime cycles, while erratic movement suggests uncertainty
3. Pro Tips for Trading and Investing
→ Portfolio Allocation Filter : Use Risk-On phases to increase exposure to growth assets, small caps, and emerging markets while reducing defensive positions during confirmed green phases
→ Entry Timing Enhancement : Combine Recovery phase signals with your technical analysis for optimal long entry points when macro headwinds are clearing but prices haven't fully recovered
→ Risk Management Overlay : Treat Weakening phase transitions as early warning systems to tighten stop losses, reduce position sizes, or hedge existing positions before full Risk-Off conditions develop
→ Sector Rotation Strategy : During Risk-On periods, favor cyclical sectors (technology, consumer discretionary, financials) while Risk-Off phases favor defensive sectors (utilities, consumer staples, healthcare)
→ Multi-Timeframe Confluence : Use daily matrix readings for strategic positioning while applying your regular technical analysis on lower timeframes for precise entry and exit execution
→ Divergence Detection : Watch for situations where your asset shows bullish technical patterns while the matrix shows Risk-Off conditions—these often provide the highest probability short opportunities and vice versa

My script// This Pine Script® code is subject to the terms of the Mozilla Public License 2.0 at mozilla.org
// © AlgoTrade_Pro
//@version=5
indicator(title='Twin Range Filter ', overlay=true, timeframe='')
//Inputs
TRsource = input(defval=close, title='Source')
TRper1 = input.int(defval=27, minval=1, title='Fast period')
TRmult1 = input.float(defval=1.6, minval=0.1, title='Fast range')
TRper2 = input.int(defval=55, minval=1, title='Slow period')
TRmult2 = input.float(defval=2, minval=0.1, title='Slow range')
//Calculations
smoothrng(TRx, TRt, TRm) =>
TRwper = TRt * 2 - 1
TRavrng = ta.ema(math.abs(TRx - TRx ), TRt)
TRsmoothrng = ta.ema(TRavrng, TRwper) * TRm
TRsmoothrng
TRsmrng1 = smoothrng(TRsource, TRper1, TRmult1)
TRsmrng2 = smoothrng(TRsource, TRper2, TRmult2)
TRsmrng = (TRsmrng1 + TRsmrng2) / 2
rngfilt(TRx, TRr) =>
TRrngfilt = TRx
TRrngfilt := TRx > nz(TRrngfilt ) ? TRx - TRr < nz(TRrngfilt ) ? nz(TRrngfilt ) : TRx - TRr : TRx + TRr > nz(TRrngfilt ) ? nz(TRrngfilt ) : TRx + TRr
TRrngfilt
TRfilt = rngfilt(TRsource, TRsmrng)
TRupward = 0.0
TRupward := TRfilt > TRfilt ? nz(TRupward ) + 1 : TRfilt < TRfilt ? 0 : nz(TRupward )
TRdownward = 0.0
TRdownward := TRfilt < TRfilt ? nz(TRdownward ) + 1 : TRfilt > TRfilt ? 0 : nz(TRdownward )
TRSTR = TRfilt + TRsmrng
TRSTS = TRfilt - TRsmrng
TRFUB = 0.0
TRFUB := TRSTR < nz(TRFUB ) or close > nz(TRFUB ) ? TRSTR : nz(TRFUB )
TRFLB = 0.0
TRFLB := TRSTS > nz(TRFLB ) or close < nz(TRFLB ) ? TRSTS : nz(TRFLB )
TRTRF = 0.0
TRTRF := nz(TRTRF ) == TRFUB and close <= TRFUB ? TRFUB : nz(TRTRF ) == TRFUB and close >= TRFUB ? TRFLB : nz(TRTRF ) == TRFLB and close >= TRFLB ? TRFLB : nz(TRTRF ) == TRFLB and close <= TRFLB ? TRFUB : TRFUB
//Entry Signals
TRlong = ta.crossover(close, TRTRF)
TRshort = ta.crossunder(close, TRTRF)
//Plots
plotshape(TRlong, title='Long', text='BUY', style=shape.labelup, textcolor=color.white, size=size.tiny, location=location.belowbar, color=#1be600)
plotshape(TRshort, title='Short', text='SELL', style=shape.labeldown, textcolor=color.white, size=size.tiny, location=location.abovebar, color=#e60000)
Trfff = plot(TRTRF, color=color.white)
mPlot = plot(ohlc4, title='', style=plot.style_circles, linewidth=0)
longFillColor = close > TRTRF ? color.green : na
shortFillColor = close < TRTRF ? color.red : na
fill(mPlot, Trfff, title='UpTrend Highligter', color=longFillColor, transp=90)
fill(mPlot, Trfff, title='DownTrend Highligter', color=shortFillColor, transp=90)
//Alerts
alertcondition(TRlong, title='Long', message='Long')
alertcondition(TRshort, title='Short', message='Short')
//End

水印This custom indicator allows you to add a watermark to your TradingView charts, offering a straightforward way to label or brand your chart images. Whether you want to mark your charts for personal use, sharing, or copyright protection, this indicator provides a flexible and easy-to-use solution.
TG:https://t.me/BTC_133333

Kill Zones (EST 24hr, Custom Colors + Legend)Asian,London, New York Sessions Indicator shows high volume time zones on every time frame for futures and forex

Dumb Money OscillatorDumb Money Oscillator — Description and Interpretation
The Dumb Money Oscillator is designed to capture the behavior of retail traders — often referred to as “dumb money” — who tend to buy high and sell low based on emotional reactions rather than informed analysis.

Smart Money OscillatorSmart Money Oscillator — Description and Interpretation
The Smart Money Oscillator is a momentum-style indicator designed to highlight when informed, institutional traders (“smart money”) are likely accumulating (buying) or distributing (selling) assets.

Smart Money vs Dumb Money ZonesSmart Money vs Dumb Money Buy & Sell Signals on Candle Chart
Smart Money Signals
Smart Money Buy: Indicates institutional or informed traders accumulating positions. This usually happens when volume spikes on a down candle near recent lows — a sign of savvy buying before price rises.
Smart Money Sell: Signals institutional distribution. Typically shown by volume spikes on up candles near recent highs — suggesting smart traders are offloading positions before a potential drop.
Dumb Money Signals
Dumb Money Buy: Reflects retail traders chasing price momentum at overbought levels, often buying near local or recent highs based on hype or fear of missing out.
Dumb Money Sell: Represents panic selling by retail traders at oversold levels near recent lows, often selling in fear as price falls further.
Visual on Candle Chart:
This data is restricted to paid members
Why It Matters:
Smart Money signals help identify potential turning points caused by large, well-informed players. Following these can help you align trades with market movers.
Dumb Money signals warn of retail emotional extremes — often contrarian trade opportunities when the crowd is overly optimistic or fearful.

GB Time Tracker - DST AwareThis script shows certain GB times combinations based on Zurich/NY time. The idea of GB time as a concept comes from aka_shan/delboy26. This script is meant to follow his logic.

Opening Range Breakout (ORB) with Fib RetracementOverview
“ORB with Fib Retracement” is a Pine Script indicator that anchors a full Fibonacci framework to the first minutes of the trading day (the opening-range breakout, or ORB).
After the ORB window closes the script:
Locks-in that session’s high and low.
Calculates a complete ladder of Fibonacci retracement levels between them (0 → 100 %).
Projects symmetric extension levels above and below the range (±1.618, ±2.618, ±3.618, ±4.618 by default).
Sub-divides every extension slice with additional 23.6 %, 38.2 %, 50 %, 61.8 % and 78.6 % mid-lines so each “zone” has its own inner fib grid.
Plots the whole structure and—optionally—extends every line into the future for ongoing reference.
**Session time / timezone** – Defines the ORB window (defaults 09:30–09:45 EST).
**Show All Fib Levels** – Toggles every retracement and extension line on or off.
**Show Extended Lines** – Draws dotted, extend-right projections of every level.
**Color group** – Assigns colors to buy-side (green), sell-side (red), and internal fibs (gray).
**Extension value inputs** – Allows custom +/- 1.618 to 4.618 fib levels for personalized projection zones.
Quarterly Cycles [EETrade]The idea of Quarterly Theory is -
Each timeframe is split into 4 "quarters", derived based on logical subdivisions:
- Year: Divided into calendar quarters (Jan-Mar, Apr-Jun, etc.).
- Tertiary (sub-year): Each year quarter is subdivided into 4 parts dynamically based on timestamp deltas.
- Month: Weekly-based logic using Sunday cutoffs and session switch time (18:00 US/Eastern).
- Week: Divided using daily boundaries starting from Sunday 18:00 (based on US futures session logic).
- Day: Split into 4 blocks (Asia, London, AM, PM) using 6-hour segments.
- Session and Macro Quarters: Session is divided further into 4 quarters of 6 hours, then each of those into 15-minute blocks for ultra-granular cycle mapping.
Where we split them into Q1, Q2, Q3 and Q4.
Usually we address
Q1 as accumulation,
Q2 as manipulation
Q3 as Distribution
Q4 as Continuation/Reversal
If we trade Q3 for example, we'd like to use price action mainly from previous Q3s.
Plus there are Semi Cycles which we can utilize
- Q1 with Q3
- Q2 with Q4
- Q3 with Q1
- Q4 with Q2
So we can also use Q1 price action when we are trading Q3
True Open Logic:
The open candle price of the second quarter is the true open for us, it will help us understand if we're on premium or discount area.
Plus this indicator providers a table to dynamically show the premium and discount
We can use this indicator to understand optimal times to trade as we'd like to trade mostly Q3

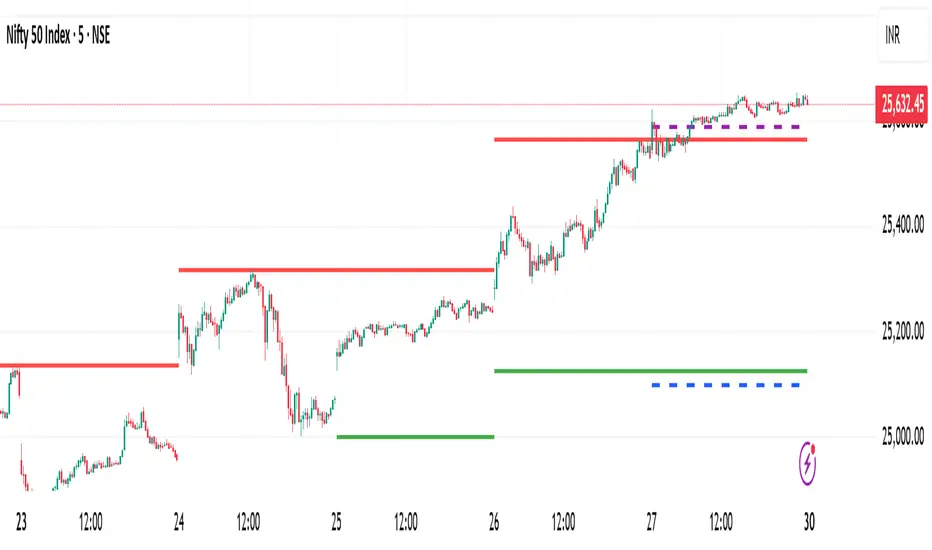
Previous 2 Days High/LowCan you give me a summary of this indicator
The "Previous 2 Days High/Low" indicator, written in Pine Script v5 for TradingView, plots horizontal lines representing the combined high and low prices of the previous two trading days on a chart. Here's a summary of its functionality, purpose, and key features:
Purpose
The indicator helps traders identify significant price levels by displaying the highest high and lowest low from the previous two days, which can act as potential support or resistance levels. These levels are plotted as lines that extend across the current trading day, making it easier to visualize key price zones for trading decisions.
Key Features
Calculates Combined High and Low:
Retrieves the high and low prices of the previous day and the day before using request.security on the daily timeframe ("D").
Computes the combined high as the maximum of the two days' highs and the combined low as the minimum of the two days' lows.
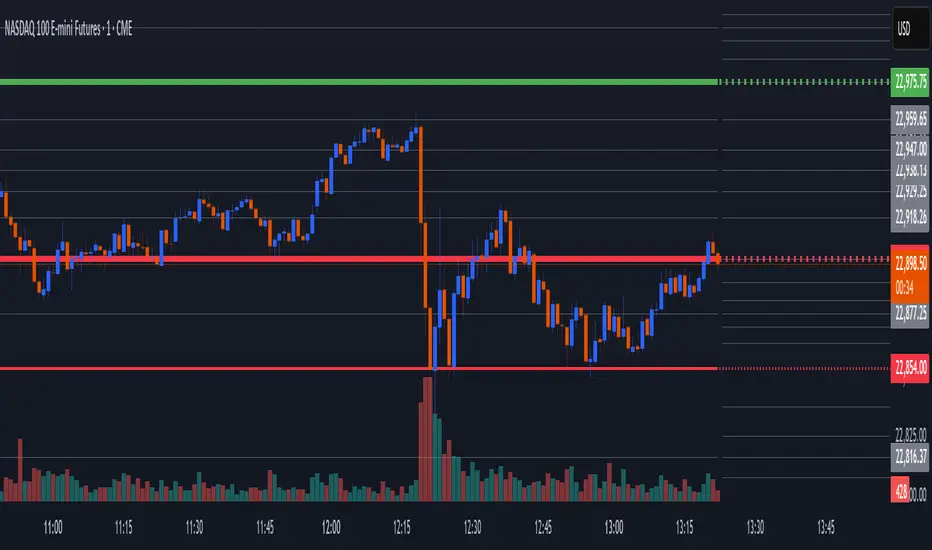
Dynamic Line Plotting:
Draws two horizontal lines:
Red Line: Represents the combined high, plotted at the highest price of the previous two days.
Green Line: Represents the combined low, plotted at the lowest price of the previous two days.
Lines are created at the start of a new trading day and extended to the right edge of the chart using line.set_x2, ensuring they span the entire current day.
Labels for Clarity:
Adds labels to the right of the chart, displaying the exact price values of the combined high ("Combined High: ") and combined low ("Combined Low: ").
Labels are updated to move with the lines, maintaining alignment at the current bar.
Clutter Prevention:
Deletes old lines and labels at the start of each new trading day to avoid overlapping or excessive objects on the chart.
Dynamic Requests:
Uses dynamic_requests=true in the indicator() function to allow request.security calls within conditional blocks (if ta.change(time("D"))), enabling daily data retrieval within the script's logic.