AI Breakout Bands (Zeiierman)█ Overview
AI Breakout Bands (Zeiierman) is an adaptive trend and breakout detection system that combines Kalman filtering with advanced K-Nearest Neighbor (KNN) smoothing. The result is a smart, self-adjusting band structure that adapts to dynamic market behavior, identifying breakout conditions with precision and visual clarity.
At its core, this indicator estimates price behavior using a two-dimensional Kalman filter (position + velocity), then enhances the smoothing process with a nonlinear, similarity-based KNN filter. This unique blend enables it to handle noisy markets and directional shifts with both speed and stability — providing breakout traders and trend followers a reliable framework to act on.
Whether you're identifying volatility expansions, capturing trend continuations, or spotting early breakout conditions, AI Breakout Bands gives you a mathematically grounded, visually adaptive roadmap of real-time market structure.
█ How It Works
⚪ Kalman Filter Engine
The Kalman filter models price movement as a state system with two components:
Position (price)
Velocity (trend direction)
It recursively updates predictions using real-time price as a noisy observation, balancing responsiveness with smoothness.
Process Noise (Position) controls sensitivity to sudden moves.
Process Noise (Velocity) controls smoothing of directional flow.
Measurement Noise (R) defines how much the filter "trusts" live price data.
This component alone creates a responsive yet stable estimate of the market’s center of gravity.
⚪ Advanced K-Neighbor Smoothing
After the Kalman estimate is computed, the script applies a custom K-Nearest Neighbor (KNN) smoother.
Rather than averaging raw values, this method:
Finds K most similar past Kalman values
Weighs them by similarity (inverse of absolute distance)
Produces a smoother that emphasizes structural similarity
This nonlinear approach gives the indicator an AI feature — reacting fast when needed, yet staying calm in consolidation.
█ How to Use
⚪ Trend Recognition
The line color shifts dynamically based on slope direction and breakout confirmation.
Bullish conditions: price above the mid band with positive slope
Bearish conditions: price below the mid band with negative slope
⚪ Breakout Signals
Price breaking above or below the bands may signal momentum acceleration.
Combine with your own volume or momentum confirmation for stronger entries.
Bands adapt to market noise, helping filter out low-quality whipsaws.
█ Settings
Process Noise (Position): Controls Kalman filter’s sensitivity to price changes.
Process Noise (Velocity): Controls smoothing of directional component.
Measurement Noise (R): Defines how much trust is placed in price data.
K-Neighbor Length: Number of historical Kalman values considered for smoothing.
Slope Calculation Window: Number of bars used to compute trend slope of the smoothed Kalman.
Band Lookback (MAE): Rolling period for average absolute error.
Band Multiplier: Multiplies MAE to determine band width.
-----------------
Disclaimer
The content provided in my scripts, indicators, ideas, algorithms, and systems is for educational and informational purposes only. It does not constitute financial advice, investment recommendations, or a solicitation to buy or sell any financial instruments. I will not accept liability for any loss or damage, including without limitation any loss of profit, which may arise directly or indirectly from the use of or reliance on such information.
All investments involve risk, and the past performance of a security, industry, sector, market, financial product, trading strategy, backtest, or individual's trading does not guarantee future results or returns. Investors are fully responsible for any investment decisions they make. Such decisions should be based solely on an evaluation of their financial circumstances, investment objectives, risk tolerance, and liquidity needs.
Moving Averages

Crypto Trend StrengthCrypto Trend Strength Dashboard (11-Point System)
Description:
This indicator is a visually enhanced dashboard that evaluates 11 key technical signals to assess bullish momentum for crypto. Each condition is displayed in a easy reading table for quick interpretation and visual appeal.
Signals include:
Higher highs and higher lows
Price above SMA18 and SMA365
SMA180 > SMA365
Positive slope on SMA180 and SMA365
RSI trending upward
Ideal for traders who want a clean, at-a-glance summary of market strength without scanning multiple charts or indicators.

Momentum-Reversal System Signals Pro
Momentum-Reversal System Signals Pro
Overview
A sophisticated signaling system designed to identify high-probability trend-following entries after a price pullback. This indicator is optimized for index futures like the S&P 500 (ES/SPX) on a 5-minute timeframe .
It performs best during periods of established trends and lower volatility. To aid in this, the indicator includes a customizable "No-Trade Zone" highlighter, which is pre-set to the often volatile 8:30 AM - 11:30 AM EST market open. While the default settings are robust and effective in most conditions, the indicator is fully customizable to suit your specific trading style.
How It Works
The core logic is based on a three-step process to filter for high-quality setups:
Trend Confirmation: The script first establishes the overall market direction using an EMA on a higher timeframe (15-minute by default). This ensures you are only looking for trades that align with the dominant trend.
Pullback Detection: Once the trend is confirmed, the script waits for the price to pull back to a dynamic area of value on the main chart (5-minute by default). This "pullback zone" is defined by the 5m EMA and an ATR-based channel around it, which adapts to current market volatility.
Momentum Entry: After a valid pullback occurs, the script waits for a clear sign that momentum is returning in the direction of the primary trend. This is confirmed by a combination of a MACD crossover and a strong RSI reading, signaling that the pullback has likely ended and the trend is ready to resume.
Advanced Quality Filters
What makes this indicator powerful is its multi-layered filtering system designed to weed out low-probability signals and avoid choppy market conditions.
Trend Strength: It doesn't just check the trend direction; it measures the slope of the 15m EMA to ensure the trend has sufficient strength. This is a key filter for avoiding flat, sideways markets.
Momentum Confirmation: An RSI "Dead Zone" around the 50-level ensures that the RSI shows decisive momentum before a signal is generated.
Signal Cooldown: A built-in timer ( Min Bars Between Signals ) prevents the same signal from firing repeatedly in a short period, reducing noise and over-trading.
RSI Volatility: The script checks that the RSI itself is not flat, which is often a sign of market indecision and a precursor to chop.
Pullback Quality: An optional filter ensures that by the time the signal fires, the price has already moved back to the "correct" side of the 5m EMA, confirming the reversal's strength.
Volatility Filter: A crucial risk management filter that blocks signals on abnormally large, high-risk "gasoline" bars that could lead to immediate stops.
How To Use
For Long Signals (Green 'Long' Tag):
Look for the 15m EMA to be green and trending upwards.
Wait for price to pull back towards the orange 5m EMA.
A "Long" signal appears when momentum indicators confirm a reversal back in the direction of the trend.
For Short Signals (Red 'Short' Tag):
Look for the 15m EMA to be red and trending downwards.
Wait for price to pull back towards the orange 5m EMA.
A "Short" signal appears when momentum indicators confirm a reversal back in the direction of the trend.
This tool provides high-probability signals, not guarantees. It is designed to be a core component of a complete trading plan. Always use proper risk management and confluence from your own analysis.
Fine-Tuning & Customization
All settings are fully adjustable in the script's "Inputs" tab to match your risk tolerance and market conditions.
Timeframe & EMA Settings: Adjust the core moving averages that define the trend and pullback zones.
Pullback Settings: Define what constitutes a valid pullback by adjusting the lookback period and the size of the ATR-based "near" zone.
Quality Filters: This is the most important section for tailoring the script's strictness. Increase the EMA Slope, RSI Dead Zone, or Signal Cooldown to receive fewer but potentially higher-quality signals.
Advanced Filters: Enable or disable the Pullback Quality and Volatility filters for an extra layer of confirmation or risk management.
No-Trade Zone Highlighter: Adjust the session and timezone to highlight periods you wish to avoid, such as news events or low-liquidity hours.
Happy trading, and please use this tool responsibly.

Trend Continuation IndicatorTrend Continuation Indicator
The Trend Continuation Indicator is designed to assist traders in identifying potential continuation setups within established market trends. It is particularly suited for use in strong trending environments and is optimized for lower timeframes, with a recommended chart setting of 5-minute candles and an EMA timeframe set to 1 hour.
The indicator combines multiple technical elements:
RSI (Relative Strength Index): Used to assess potential overbought and oversold conditions relative to the trend.
EMA (Exponential Moving Average): A multi-timeframe EMA is used as a directional filter, helping to align entries with the broader trend.
Candle Structure and Momentum Filters: The logic includes real-time candle analysis and volume dynamics to identify momentum-driven signals.
Buy signals are generated when price action shows bullish momentum and RSI confirms potential oversold conditions within an uptrend. Conversely, sell signals are triggered when bearish momentum aligns with overbought RSI levels in a downtrend.
This tool is intended for use as part of a broader trading strategy and is best applied in trending markets where continuation patterns are more likely to follow through.
THE INDICATOR ITSELF IS NO FINANCIAL ADVISE!
Here are some usecase examples:

📊 TREND Indicator by Yogesh Mandloi 📊This custom-built TradingView indicator provides a visual and logic-based trend analysis dashboard using 4-hour RSI and EMA/SMA conditions, combined with entry/exit signals, alerts, and a toggle-controlled condition table.
🔍 Core Logic
The strategy uses 4-hour timeframe data to identify potential bullish or bearish trends based on:
RSI (14):
Buy: RSI > 48
Sell: RSI < 52
EMA/SMA (Trend Filters):
Buy: EMA 21 > SMA 55 High → uptrend confirmation
Sell: EMA 21 < SMA 55 Low → downtrend confirmation
Buy Signal = RSI > 48 AND EMA21 > SMA55 High
Sell Signal = RSI < 52 AND EMA21 < SMA55 Low
It only signals on first bar of condition (no repetitive signals) and gives exit alerts when the condition ends.
📈 Features
✅ Signal Plotting
Green "BUY" arrows below bars when buy setup forms
Red "SELL" arrows above bars when sell setup forms
Gray "EXIT" markers when the trend condition invalidates
✅ Real-Time Alerts
Entry alerts for both BUY and SELL signals
Exit alerts to close positions
✅ Dynamic Visual Table
An on-screen signal table shows the live status of each condition with color-coded clarity:
✅ Green: Condition met
❌ Red: Condition not met
🟧 Orange: Warning (bearish potential forming)
✅ Toggle Switches for Sections
Users can control the visibility of each table section:
Buy Conditions ✔️
Sell Conditions 🔻
Signal Summary 📌
Indicator Values 📊
This makes it easier to focus on relevant sections or declutter the chart view.
✅ Customizable Table Position
You can change the table location:
top_left, top_right, bottom_left, bottom_right
✅ Background Highlights
Light Green background when buy conditions are active
Light Red background when sell conditions are active

LANZ Strategy 5.0🔷 LANZ Strategy 5.0 — Intraday BUY Signals, Dynamic Lot Size per Account, Real-Time Dashboard and Smart Execution
LANZ Strategy 5.0 is a powerful intraday tool designed for traders who need a visual-first, data-backed BUY system, enhanced with risk-aware lot size calculation and a real-time performance dashboard. This indicator intelligently detects strong momentum setups and provides visual and statistical clarity throughout the session.
📌 This is an indicator, not a strategy — It does not place trades automatically but provides precise conditions, alerts, and visual guides to support execution.
🧠 Core Logic & Features
BUY Entry Conditions (Signal Engine)
A BUY signal is triggered when:
The current price is above the EMA200 (trend filter)
The last 3 candles are bullish (candle body close > open)
You are within the defined session window (NY time)
When all conditions are met and you haven’t reached the daily trade limit, a signal appears on the chart and an optional alert is triggered.
Operational Hours Filter (NY Time)
You define:
Start time (e.g., 01:15 NY)
End time (e.g., 16:00 NY)
The system only evaluates and executes signals within this period. If a BUY setup occurs outside the window, it’s ignored. The chart is also highlighted with a transparent teal background to visually show active trading hours.
Lot Size Panel with Per-Account Risk Management
Designed for traders managing multiple accounts or capital sources. You can enable up to 5 accounts, each with:
Its own capital
Its own risk percentage per trade
The system uses the defined SL in pips, plus the instrument’s pip value, to calculate the lot size per account. All values are shown in a dedicated panel at the bottom-right, automatically updating with each new trade.
The emojis (🐣🦊🦁🐲🐳) distinguish each account visually.
Trade Visualization with Customizable Lines
When a signal is triggered:
An Entry Point (EP) line is drawn at the candle’s close.
A Stop Loss (SL) line is placed X pips below the entry.
A Take Profit (TP) line is placed Y pips above the entry.
All three lines are fully customizable in style, color, and thickness. You define how many bars the lines should extend.
Outcome Tracking & Real-Time Dashboard
Each trade outcome is measured:
SL hit = –1.00%
TP hit = +3.00%
Manual close = calculated dynamically based on price at close time
Each result is labeled on the chart near its level, and stored.
The top-right dashboard updates in real time:
✅ Number of trades
📈 Cumulative % gain/loss of the day (color-coded)
Alerts You Can Trust:
You’ll get a Buy Alert when a valid signal is formed
You’ll get a Trade Executed Alert when the visual operation is plotted
You’ll get a SL/TP Hit Alert with price and result
You’ll get a Manual Close Alert if the configured time is reached and the trade is still active
⚙️ Step-by-Step Execution Flow
At every bar, the system checks:
Are we within the session time window?
Is price above EMA?
Are the last 3 candles bullish?
✅ If yes:
A BUY signal is plotted
Entry/SL/TP lines are drawn
Lot sizes are calculated and displayed
Trade is added to the daily count
🕐 At the configured Manual Close time (e.g., 16:00 NY):
If the trade is still open, it's closed
A label is added with the exact result in %
💡 Ideal For:
Intraday traders who operate within fixed time sessions
Traders managing multiple accounts or capital pools
Anyone who wants full visual clarity of every decision point
Traders who appreciate dynamic lot size calculation and clean execution tracking
👨💻 Credits:
💡 Developed by: LANZ
🧠 Strategy concept & execution model: LANZ
🧪 Tested on: 1H charts with visual-only execution
📈 Designed for: Clarity, adaptability, and full intraday control

EMA Curl Strength+EMA Curl Strength+
Description:
This indicator provides a statistically normalized view of EMA slope momentum using Z-score transformation. By evaluating the rate of change of an EMA and comparing it against its historical behavior, the script highlights momentum shifts in a dynamic, adaptive way.
⸻
How It Works:
• Calculates the slope (percentage change) of a chosen EMA.
• Normalizes the slope using Z-score over a custom lookback period.
• Smooths the resulting signal and computes two signal lines for comparison.
• Assigns dynamic colors based on user-defined Z-score thresholds for mild, moderate, and strong momentum in both directions.
⸻
Visual Features:
• Gradient fill between the Z Curl Line and Signal 1 to highlight slope acceleration.
• Histogram showing the difference between the Z Curl Line and its signal.
• Optional signal crossover shapes between configurable pairs (e.g., Z Curl vs. Signal).
• Background highlights when the Z Curl Line exceeds ±2, indicating strong trending behavior.
⸻
Customization:
• Adjustable EMA length, smoothing lengths, signal lengths, histogram smoothing, and Z-score lookback.
• Separate color controls for:
• Z-score strength bands (mild/moderate/strong up/down)
• Histogram bars
• Signal lines
• Background highlight zones
• Crossover shapes
⸻
Use Cases:
• Momentum Confirmation: Confirm strength when Z Curl exceeds ±2 with matching background highlights.
• Trend Entry Timing: Look for trades when Z Curl crosses above or below the 0-line.
• Scalping: Capture quick directional moves when momentum accelerates.
• Trend Following: Use strong Z Curl values to confirm trade direction and filter sideways action.
• Divergence Detection: Spot divergences between price and Z Curl movement to anticipate reversals.

Multi-Method Moving Average v6.0Multi-Methods Moving Average Indicator is a versatile tool designed for traders who want to identify key price levels that can act as support and resistance in the market. This indicator utilizes multiple moving averages (MAs) to help visualize price trends and potential reversal points, aiding traders in making informed decisions.
Features
Multiple Moving Averages: The indicator calculates and displays six different moving averages (MA1 to MA6) based on user-defined periods. This allows traders to analyze short-term and long-term trends effectively.
Customizable Inputs: Users can customize the periods for each moving average and select the type of moving average (SMA, EMA, WMA) that best suits their trading strategy.
Price Source Selection: The indicator allows users to choose the price source (Open, Close, High, Low, or the average of Open and Close) for calculating the moving averages, providing flexibility in analysis.
Color-Coded Signals: The moving averages are color-coded based on the current price relative to the moving average, helping traders quickly identify bullish or bearish conditions.
How to Use
Adding the Indicator:
Open TradingView and navigate to the chart you wish to analyze.
Click on the "Indicators" button at the top of the chart.
Search for "Multi-Methods Moving Average" and select the indicator to add it to your chart.
Customizing Settings:
Click on the gear icon next to the indicator's name in the chart legend to open the settings menu.
Adjust the periods for each moving average to fit your trading style. Common settings include 9, 26, 52, 100, 200, and 500 periods.
Choose the type of moving average you prefer (SMA, EMA, or WMA).
Select the price source that aligns with your trading strategy.
Interpreting the Indicator:
Moving Averages: Observe the position of the moving averages relative to the price. If the price is above the moving average, it indicates a bullish trend; if below, it suggests a bearish trend.
Crossover Signals: Look for crossovers between the moving averages. A crossover where a shorter moving average crosses above a longer moving average may signal a potential buy opportunity, while a crossover in the opposite direction may indicate a sell opportunity.
Support and Resistance Levels: Use the moving averages as dynamic support and resistance levels. Price often reacts at these levels, providing potential entry and exit points for trades.
Risk Management:
Always combine the insights from this indicator with other forms of analysis, such as price action, volume analysis, and market sentiment.
Set stop-loss and take-profit levels based on the identified support and resistance levels to manage your risk effectively.
Conclusion
The Support & Resistance Indicator is an essential tool for traders looking to enhance their market analysis. By leveraging multiple moving averages and customizable settings, traders can gain a clearer understanding of market trends and make more informed trading decisions.

Hybrid Strategy with Position Control//@version=6
indicator('Hybrid Strategy with Position Control', overlay=true)
// === INPUTS ===
emaFastLen = input.int(8, 'Fast EMA')
emaSlowLen = input.int(21, 'Slow EMA')
rsiLen = input.int(14, 'RSI Length')
rsiOverbought = input.int(70, 'RSI Overbought')
rsiOversold = input.int(30, 'RSI Oversold')
macdFast = input.int(12, 'MACD Fast')
macdSlow = input.int(26, 'MACD Slow')
macdSignal = input.int(9, 'MACD Signal')
// === CALCULATIONS ===
emaFast = ta.ema(close, emaFastLen)
emaSlow = ta.ema(close, emaSlowLen)
rsi = ta.rsi(close, rsiLen)
= ta.macd(close, macdFast, macdSlow, macdSignal)
// === POSITION TRACKING ===
var int position = 0 // 0 = no position, 1 = long, -1 = short
// === ENTRY CONDITIONS ===
longCondition = ta.crossover(emaFast, emaSlow) and rsi < rsiOverbought and macdLine > signalLine and position != 1
shortCondition = ta.crossunder(emaFast, emaSlow) and rsi > rsiOversold and macdLine < signalLine and position != -1
// === EXIT CONDITIONS (Optional logic for reset) ===
exitLong = ta.crossunder(emaFast, emaSlow)
exitShort = ta.crossover(emaFast, emaSlow)
// === SIGNAL PLOTS ===
buySignal = longCondition
sellSignal = shortCondition
plotshape(buySignal, title='Buy Signal', location=location.belowbar, color=color.green, style=shape.triangleup, size=size.small, text='BUY')
plotshape(sellSignal, title='Sell Signal', location=location.abovebar, color=color.red, style=shape.triangledown, size=size.small, text='SELL')
// === STATE MANAGEMENT ===
if (longCondition)
position := 1
if (shortCondition)
position := -1
// Reset position if trend reverses
if (exitLong and position == 1)
position := 0
if (exitShort and position == -1)
position := 0
// === PLOT EMAs ===
plot(emaFast, color=color.orange, title='Fast EMA')
plot(emaSlow, color=color.blue, title='Slow EMA')


10/20 MA Coil: Progressive Colors & Multi-Day BreakoutThis indicator detects price “coil” setups and highlights potential breakout or breakdown opportunities using moving average alignment and volatility compression.
Features:
• Coil Detection:
• Identifies consolidation when:
• The 10 and 20 MAs are tightly aligned (within user-defined tolerance)
• Price is above both MAs and within 1.5x ADR of them
• The 50 MA is rising
• Progressive Coil Coloring:
• Coil candles are colored in progressively darker orange as the streak continues
• Bullish Breakout Signal:
• Triggers when a green candle follows a coiled bar
• The candle’s body must be greater than or equal to 1 ATR
• Colored lime green
• Bearish Breakdown Signal:
• Triggers when a red candle follows a coiled bar
• The candle’s body must be greater than or equal to 1 ATR to the downside
• Colored black
• Custom Candle Rendering:
• Candle body color represents coil or breakout state
• Wick and border are red or green to reflect price direction
• Optional Debug Tools:
• Coil streak, ATR, and distance from MAs can be plotted for deeper analysis
This script is designed for traders looking to spot price compression and prepare for high-probability moves following low-volatility setups.

Multiple EMAs (Chart Timeframe)This indicator plots six customizable EMAs based on the current chart timeframe.
It automatically adapts to the timeframe you're viewing — whether it's 5 minutes, 1 hour, 4 hours, or daily.
- Up to 6 EMA lines with user-defined lengths
- No manual timeframe selection required
- Clean, minimal setup for trend analysis across any timeframe
- Ideal for traders who want to monitor multiple EMAs without switching indicators or manually adjusting timeframes.

Kaufman Profit (Slope Based) + ATR FilterSlope based moving average profit ranking trend system with a ATR filter and adjustment

MA Signal IndicatorMA Signal Indicator
The MA Signal Indicator is a customizable designed to identify potential trading opportunities based on price interactions with a Simple Moving Average (SMA). It incorporates risk management features such as stop-loss (SL), take-profit (TP), and breakeven levels, calculated using the Average True Range (ATR). The indicator is visually intuitive, overlaying trade signals, price levels, and colored zones directly on the chart.
Key Features:
1. Moving Average-Based Signals:
• Generates buy (long) signals when the price crosses above a user-defined SMA (default: 55 periods).
• Generates sell (short) signals when the price crosses below the SMA.
• Long and short trades can be independently enabled or disabled via input settings.
2. Risk Management:
• Stop-Loss (SL): Set as a multiple of the ATR (default: 1x ATR) below the entry price for long trades or above for short trades.
• Take-Profit (TP): Set as a multiple of the ATR (default: 5x ATR) above the entry price for long trades or below for short trades.
• Breakeven Level: A trigger level (default: 2x ATR) where traders may choose to move their stop-loss to breakeven, optionally displayed on the chart.
3. Visual Feedback:
• SMA Line: Plotted in orange (default: 55-period SMA) for trend reference.
• Trade Zone: Highlights the area between the stop-loss and take-profit levels with a semi-transparent green (long) or red (short) background.
• Price Lines: Displays entry price (white), stop-loss (red), take-profit (green), and breakeven level (gray, optional) as horizontal lines during active trades.
• Signal Markers: Triangular markers indicate entry points (green triangle up for long, red triangle down for short).
• Exit Markers: Labels show when a trade hits the take-profit (green checkmark) or stop-loss (red cross).
4. Trade Logic:
• Only one trade is active at a time (long or short).
• Trades are exited when either the stop-loss or take-profit is hit, resetting the indicator for the next signal.
• Ensures signals are only triggered when not already in a trade, avoiding duplicate entries.
Inputs:
• MA Period: Length of the SMA (default: 55).
• ATR Period: Period for ATR calculation (default: 5).
• SL Multiplier: ATR multiplier for stop-loss (default: 1.0).
• TP Multiplier: ATR multiplier for take-profit (default: 5.0).
• Move to Breakeven After: ATR multiplier for breakeven trigger (default: 2.0).
• Show Break Even Line: Option to display the breakeven level (default: true).
• Allow Long Trades: Enable/disable long signals (default: true).
• Allow Short Trades: Enable/disable short signals (default: true).
Use Case:
This indicator is ideal for trend-following traders who want a clear, visual system for entering and exiting trades based on SMA crossovers, with predefined risk and reward levels. It suits both manual and automated trading strategies, providing flexibility to adjust parameters for different markets or timeframes.
Notes:
• The indicator is overlaid on the price chart for easy integration with other analysis tools.
• Users should test and adjust parameters (e.g., MA length, ATR multipliers) to suit their trading style and market conditions.
• The breakeven line is a visual guide; manual adjustment of stops is required as the indicator does not automatically modify trade positions.
This indicator provides a robust framework for disciplined trading with clear entry, exit, and risk management visuals.

TeeLek-BestPositionThis indicator is used to indicate the best buying and selling points.
This indicator will calculate the best buying points (blue) and selling points (orange). The working principle is that the blue point is the point where the RSI is Over Sold, the orange point is the point where the RSI is Over Bought. After that, we will use the Highest Line 100 and Lowest Line 100 to filter the points another layer. And because when Over Bought/Over Sold occurs, there will be continuous signals that are repeated, causing confusion. Therefore, there is a feature to leave a time frame. Set the default value to 24 hours. If a signal occurs, it will be left out.
The appropriate point for buying is:
The point where Over Sold occurs and Closes lower than the Lowest Line 100.
Leave a time frame for 24 hours before a new signal occurs.
The appropriate point for selling is:
The point where Over Bought occurs and Closes higher than the Highest Line 100.
Leave a time frame for 24 hours before a new signal occurs.
It helps us to gradually buy and collect/sell for profit easily without confusion.
อินดิเคเตอร์นี้ใช้ สำหรับบอกจุดซื้อจุดขายที่ดีที่สุด
อินดิเคเตอร์นี้ จะคำนวณจุดซื้อ (สีฟ้า) และจุดขาย (สีส้ม) ที่ดีที่สุดมาให้ โดยหลักการทำงาน คือ จุดสีฟ้า คือจุดที่ RSI Over Sold จุดสีส้ม คือจุดที่ RSI Over Bought หลังจากนั้นเราจะใช้เส้น Highest Line 100 และ Lowest Line 100 เพื่อกรองจุดอีกชั้นหนึ่ง และเนื่องจากเมื่อเกิด Over Bought/Over Sold แล้ว มันจะเกิดสัญญาณต่อเนื่องซ้ำๆ ทำให้สับสน จึงได้มีฟีเจอร์ในการเว้นระยะเวลา ตั้งค่าไว้เริ่มต้นที่ 24 ชั่วโมง ถ้าเกิดสัญญาณแล้วก็จะเว้นระยะออกไป
จุดที่เหมาะสมกับการซื้อ คือ
จุดที่เกิด Over Sold และ Close ต่ำกว่าเส้น Lowest Line 100
เว้นระยะไป 24 ชั่วโมงจึงจะเกิดสัญญาณใหม่อีกครั้ง
จุดที่เหมาะสมกับการขาย คือ
จุดที่เกิด Over Bought และ Close สูงกว่าเส้น Highest Line 100
เว้นระยะไป 24 ชั่วโมงจึงจะเกิดสัญญาณใหม่อีกครั้ง
ช่วยให้เราสามารถ ทยอยซื้อเก็บสะสม/ทยอยขายทำกำไร ได้ง่ายไม่สับสน

Multiple EMAsThis TradingView indicator allows you to display six EMAs (Exponential Moving Averages) on your chart, all based on a single, user-defined timeframe, regardless of the chart’s current timeframe.
- Set a specific timeframe (e.g., 4h, 1h, D) for all EMAs using the tf input.
- Six EMA Lengths
- Each EMA has its own customizable length (default: 21, 50, 100, 200, 300, 400).
- Timeframe Independence
- All EMAs are calculated using request.security, so they appear based on the selected timeframe even if you're viewing a smaller or larger chart timeframe.

PK's Buffer Zones with Extra Zone + EMA + VWAPuse as support and resistance. for any market and stocks.

20-Day SMA BIAS%20-day Bias is a commonly used indicator in technical analysis. It is used to measure the gap between the stock price and its 20-day moving average to determine whether the stock price deviates from the normal state and whether there is an overbought or oversold phenomenon.
How to calculate the 20-day deviation value:
The calculation formula of the deviation rate is: ((closing price of the day - 20-day moving average price) / 20-day moving average price) * 100%.
Interpretation of 20-day deviation value:
Positive deviation rate:
Indicates that the stock price is higher than the 20-day moving average, which means that the stock price is high and may face correction pressure.
Negative deviation rate:
Indicates that the stock price is lower than the 20-day moving average, which means that the stock price is low and there may be a rebound opportunity.
Absolute value of the deviation rate:
The larger the absolute value, the higher the deviation of the stock price, and the higher the degree of overbought or oversold.
Apply the deviation rate to determine the buying and selling opportunities:
Positive deviation rate is too large:
When the positive deviation rate of the stock price from the 20-day moving average is too large, and the stock price is already at a high level, this may be a sell signal.
Negative deviation rate is too large:
When the negative deviation rate of the stock price from the 20-day moving average is too large, and the stock price is already at a low level, this may be a buy signal.
Stock price fluctuates around the moving average:
Stock price usually fluctuates around the moving average and adjusts after over-rising or over-falling.
Practical operation suggestions:
The standards of the market and individual stocks are different:
When the positive and negative deviation rate of the market and the quarterly line is greater than 5%, there is a greater chance of correction; large-cap stocks are between 5% and 10%; small and medium-sized stocks may be above 15% to 20%.
Combined with other indicators:
The deviation rate is only one of the technical analysis indicators. It is recommended to combine it with other indicators, such as KD indicators, RSI, etc., to make a comprehensive judgment and improve accuracy.
Reference to historical experience:
You can refer to the situation where the deviation rate of the stock was too large in the past to determine whether the current deviation rate is also too large.
Summary:
The 20-day deviation value is an indicator to determine whether the stock price is overbought or oversold, which can help investors determine the timing of buying and selling, but it needs to be combined with other indicators and historical data, and adjusted according to market conditions.


15m EMA 50 CloudDescription:
The 15m EMA 50 Cloud is a simple but powerful tool designed for scalpers and intraday traders who hunt for low timeframe patterns while staying anchored to higher timeframe trend context.
This indicator displays the 50-period EMA and its volatility cloud from the 15-minute chart on any timeframe - including 1m, 3m, or 5m. The cloud adapts dynamically and remains visible even when you zoom into lower timeframes, helping you instantly see whether price is trading above, below or within the 15m trend structure.
Features:
* Plots the 15-minute 50 EMA Cloud on any chart, regardless of your selected timeframe.
* Cloud width is based on 15m price volatility (standard deviation), inspired by the popular "Traders Reality" indicator.
* Option to enable or hide the EMA line for a cleaner look.
* Customizable colors for the cloud fill, border, and EMA line.
* Works with all markets and all symbols.
How to Use:
* Perfect for scalpers who want to spot micro patterns (e.g., on 1m or 3m charts) while keeping
the 15m EMA cloud as a visual "road map".
* Use the cloud as a dynamic support/resistance zone or to define higher timeframe trend bias.
* Combine with your favorite price action or orderflow setups for multi-timeframe confluence.
Settings:
* Toggle EMA line ON/OFF.
* Adjust cloud and border colors for your chart style.
For educational purposes only. This indicator does not provide financial advice or signals. Always use proper risk management.
⚠️ Important Notice
This tool is provided for educational and informational purposes only . It is designed to assist in technical analysis learning and visual chart study.
It is not intended to be used as financial advice, a buy/sell signal, or any form of investment recommendation .
By using this indicator, you acknowledge that all actions you take are your own and you assume full responsibility for any decisions made.

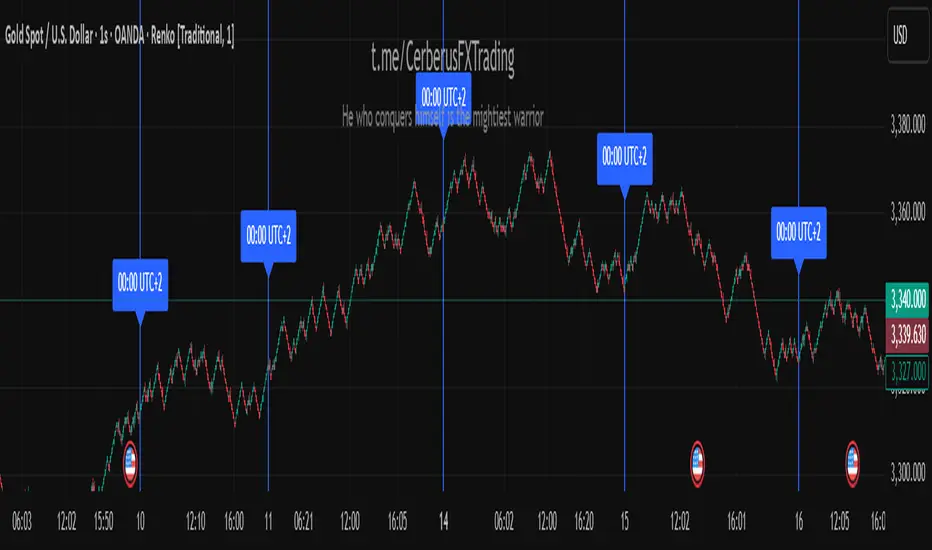
CerberusFX Midnight Line UTC+2Daily Vertical Line UTC+2
Plots a vertical blue line spanning the full chart height at the start of each day at 00:00 UTC+2 (or the next available candle). Includes a label ("00:00 UTC+2") above the candle for clarity. Ideal for separating trading days on intraday charts in the UTC+2 timezone.
TMA Lock - Triple Moving Averages with Timeframe ControlKeep your 50, 100, and 200-day moving averages consistent across all chart timeframes! No more recalculating MAs when switching from daily to hourly charts.
Key Features:
Timeframe Lock - MAs stay true to your selected timeframe (daily, weekly, etc.) regardless of chart view
Fully Customizable - Adjust periods, colors, line styles, and smoothing strength
