NoNoiseMA & SlopeHappy trade,
This is a noise-reduced moving average — let's call it the No-Noise MA. A MA where false breakout price action should have little to no impact, while the main trend remains fully represented. In comparison to previous MAs this one's trend appear more linear, and sideways price actions becomes easier to detect thanks to it's unique two filter stages.
In short, the No-Noise-MA (Noise-Reduced Moving Average) is calculated as the cumulative sum of the slopes derived from the center line of the last x pivot points. Let’s break it down step by step:
Pivot Detection:
A pivot algorithm (an adapted variant of the Bilson-Gann-Count method) identifies consecutive pivot points (high, low, high, low, etc.) in the close price series. Let's call this set of Pivots S.
Center Line Calculation:
Out of the set S the last x pivots are used to compute a center line (linear regression line). Always when a new pivot is confirmed, the oldest pivot in the queue is removed, and the new pivot is added.
Slope Extraction:
The center line is defined by its equation shown in the image below
Image 1
Cumulative Slope Sum:
As shown in the image 1 the slope is a series with values around zero. The No-Noise-MA is then just the cumulative sum of the slope series and a correction term. A correction term is needed otherwise the No-Noise-MA would run away over time from the original close price. The correction term is just the deviation between close price and cumulative slope sum multiply with a factor around 0.01 added to the No-Noise-MA.
Noise Reduction:
The goal of noise reduction is done by two filter stages. First Filter is the reduction of the input values. As shown above not all bars close prices are use, instead it uses just the pivot points delivered by the Bilson-Gann-Count method. Favorable the Bilson-Gann-Count method delivers the Pivot points in most cases much faster as other Pivot methods. Already after two bars a new Pivot is confirmed. This takes out all ups and downs between two consecutive Pivots. This first filter stage is legit because all price action in between is hedged by the Pivots.
The second filter stage is the done by the length of the center line. As more pivots are used to calculate the center line as smoother the slope becomes. Out liners just gets less impact if the base is bigger. So the number of involved Pivots has the same meaning as the lengths in any other MA.
Comparison with usual MAs:
For a comparison with other MAs this script also calculate the average lengths of the center line, shown in the upper right chart. So choose for example SMA and set the length parameter to the average length of the center line. As shown in the following image 2.
Image 2
This way both MAs have the same data base and can be objectively compared.
Trend detection:
The slope of the center line can be used for trend confirmation. A slope bigger then zero is an up trend while a slope smaller then zero is a down trend. And side way price action is indicated when the slope is around zero within a certain threshold.
Image 3
One hint should be mentioned here. The side way section gets indicated much later. About the number of bars as the center line is long. Before that there are just up or down trend predicted. In the image 2 you see the slope is firstly tin and as more bars past by the slope becomes more thick. This should indicate the point where no side way predictions will happens anymore.
Variation of calculation
In the settings menu you can find the setting "Include last close to center line". With this activated the center line is calculated with the last pivots and the last close price. The last close price is assumed as a pivot too. This gives the slope a more early reaction to volatile price action. But also brings back some noise.
Moving Averages

Custom Paul MACD-likePaul MACD is an indicator created by David Paul. It is implemented to effectively represent trend periods and non-trend (sideways/consolidation) periods, and its calculation method is particularly designed to reduce whipsaw.
Unlike the existing MACD which uses the difference between short-term (12) and long-term (26) exponential moving averages (EMA), Paul MACD has a different calculation method. This indicator uses a "center value" or "intermediate value". Calculation occurs when this intermediate value is higher than the High value (specifically, the difference between the center and High is calculated) or lower than the Low value (specifically, the difference between the center and Low is calculated). Otherwise, the value becomes 0. Here, the High and Low values are intended to be smoothly reflected using Smoothed Moving Average (SMMA). The indicator's method itself (using SMMA and ZLMA) is aimed at diluting whipsaws.
Thanks to this calculation method, in sections where whipsaw occurs, meaning when the intermediate value is between High and Low, the indicator value is expressed as 0 and appears as a horizontal line (zero line). This serves to visually clearly show sideways/consolidation periods.

21-Day Trend Direction📈 21-Day Trend Direction Indicator
📊 How It Works:
🎯 Trend Detection Logic:
Analyzes last 21 daily candles
Calculates total price change from start to end
Compares against sideways threshold (default 2%)
Counts bullish vs bearish days
Tracks higher highs and lower lows
📈 Trend Classifications:
• 📈 UPTREND: Price change > +2% over 21 days
• 📉 DOWNTREND: Price change < -2% over 21 days
• ➡️ SIDEWAYS: Price change between -2% and +2%
💪 Trend Strength Levels:
• 🔥 Very Strong: >5% price change
• 💪 Strong: 3-5% price change
• 📊 Moderate: 1.5-3% price change
• 📉 Weak: <1.5% price change
🎨 Visual Features:
📋 Information Table Shows:
• Trend Direction with color coding
• Price Change % over 21 days
• Trend Strength classification
• Bull/Bear Days count
• Higher Highs/Lower Lows count
• Analysis Period (customizable)
📊 Chart Indicators:
• Trend Line (21-day moving average)
• Background Color for quick trend identification
• Trend Arrows (▲ ▼ ➡) on chart
• Customizable display options
⚙️ Customizable Settings:
🎯 Analysis Settings:
• Lookback Days: 5-50 days (default: 14)
• Sideways Threshold: 0.5-10% (default: 2%)
• Trend Strength: Low/Medium/High sensitivity
🎨 Display Options:
• Table Position: 9 different positions
• Table Size: Tiny to Large
• Show/Hide: Table, Trend Line, Background, Arrows
🚨 Alert Options:
• Trend Change to Uptrend
• Trend Change to Downtrend
• Trend Change to Sideways
This indicator gives you a clear, objective view of the 21-day trend with multiple confirmation signals! 🚀

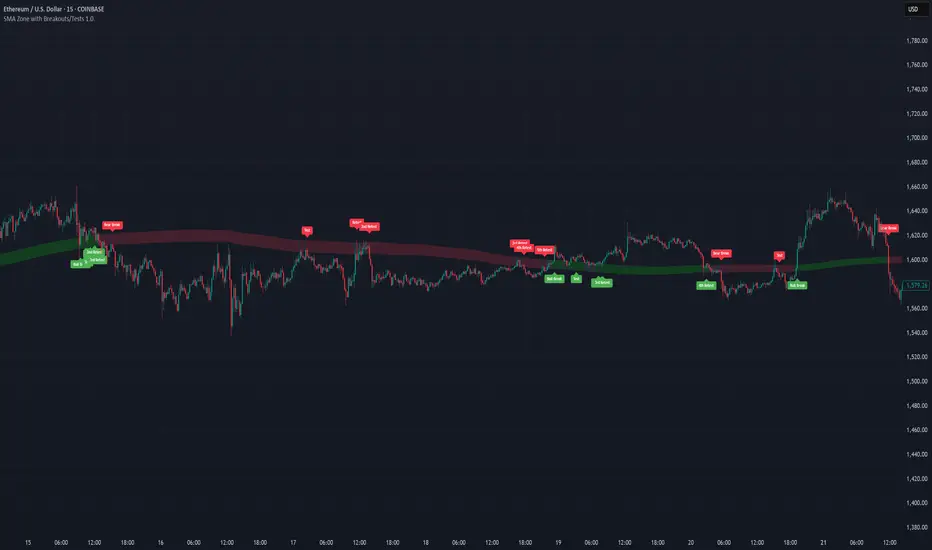
SMA Zone with Breakouts/Tests 1.0.This indicator plots a dynamic “SMA Zone” between two simple moving averages (one applied to lows, one to highs) and highlights key interaction points with the zone:
Breakouts
Bull Break: price closes above the upper SMA
Bear Break: price closes below the lower SMA
Requires confirmation via either above-average volume or an unusually wide bar (spread > ATR) closing near its extreme
Tests & Retests
After a breakout, the first re-entry into the zone edge is labeled “Test,” subsequent re-entries are numbered “Retest,” “2nd Retest,” etc.
Zone Weakening: each additional Test/Retest signifies diminished zone strength—fewer reliable boundaries remain (Traditional S/R theory)
Alerts
Fires a unified “Zone Signal” alert on every Break, Test, and Retest (set condition to “Any alert() function call”).
Disclaimer:
This is not financial advice and should not be used as a standalone trading signal.
It’s designed to draw your attention to important price-zone interactions so you can manually tune in.
The logic can be further enhanced or combined with other indicators/algorithms as part of a more complex trading system.
Smooth BTCSPL [GiudiceQuantico] – Dual Smoothed MAsSmooth BTCSPL – Dual Smoothed MAs
What it measures
• % of Bitcoin addresses in profit vs loss (on-chain tickers).
• Spread = profit % − loss % → quick aggregate-sentiment gauge.
• Optional alpha-decay normalisation ⇒ keeps the curve on a 0-1 scale across cycles.
User inputs
• Use Alpha-Decay Adjusted Input (true/false).
• Fast MA – type (SMA / EMA / WMA / VWMA) & length (default 100).
• Slow MA – type & length (default 200).
• Colours – Bullish (#00ffbb) / Bearish (magenta).
Computation flow
1. Fetch daily on-chain series.
2. Build raw spread.
3. If alpha-decay enabled:
alpha = (rawSpread − 140-week rolling min) / (1 − rolling min).
4. Smooth chosen base with Fast & Slow MAs.
5. Bullish when Fast > Slow, bearish otherwise.
6. Bars tinted with the same bull/bear colour.
How to read
• Fast crosses above Slow → rising “addresses-in-profit” momentum → bullish bias.
• Fast crosses below Slow → stress / capitulation risk.
• Price-indicator divergences can flag exhaustion or hidden accumulation.
Tips
• Keep in a separate pane (overlay = false); bar-colouring still shows on price chart.
• Shorter lengths for swing trades, longer for macro outlook.
• Combine with funding rates, NUPL or simple price-MA crossovers for confirmation.

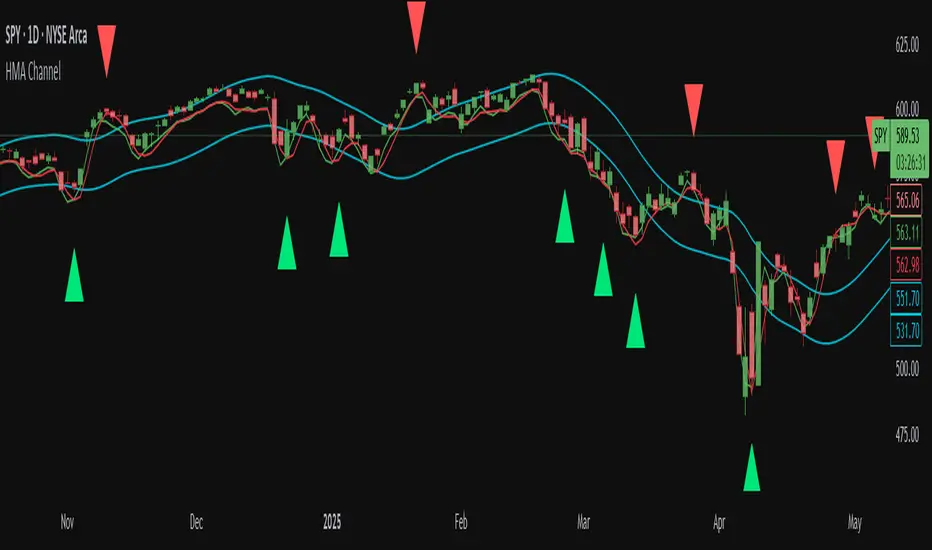
Hull MA Channel with Filtered CrossoversI've created an indicator that let's you create a HMA channel with 2 displaced HMA (A/B). As well as a HMA crossover set (C/D).
Here's how it works:
The HMA crossovers from C and D will not signal unless they are outside of the channel of A and B. As a matter of fact, NO buy signal whatsoever will occur above the channel and NO sell signal will occur below the channel.
The crossover HMA pair (C/D) can have their lengths adjusted to the 0.00 decimal point for VERY fine tuning of the crossovers.
(edit-it doesn't fine tune to the .00. This must not be a feature that is able to be utilized. I tried) The length adjustment still works to the nearest whole number. The .00 are mute :(
In keeping with that same logic, you can adjust the displacement of the channel independently to the 0.00 decimal, again for VERY fine tuning.
This is great for reversals while eliminating noise from false signals, keeping the chart nice and clean. Should be used in combination with other indicators for the best confirmations.
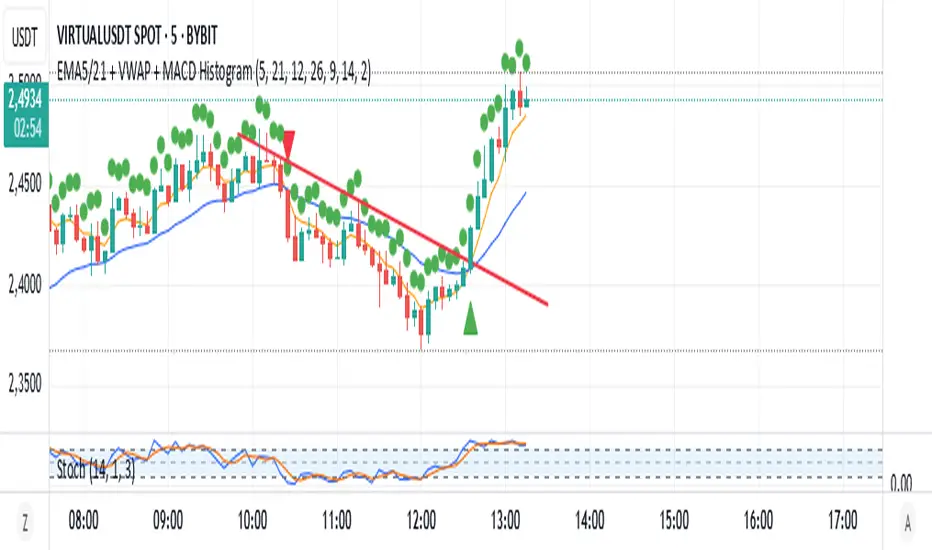
EMA5/21 + VWAP + MACD HistogramScript Summary: EMA + VWAP + MACD + RSI Strategy
Objective: Combine multiple technical indicators to identify market entry and exit opportunities, aiming to increase signal accuracy.
Indicators Used:
EMAs (Exponential Moving Averages): Periods of 5 (short-term) and 21 (long-term) to identify trend crossovers.
VWAP (Volume Weighted Average Price): Serves as a reference to determine if the price is in a fair value zone.
MACD (Moving Average Convergence Divergence): Standard settings of 12, 26, and 9 to detect momentum changes.
RSI (Relative Strength Index): Period of 14 to identify overbought or oversold conditions.
Entry Rules:
Buy (Long): 5-period EMA crosses above the 21-period EMA, price is above VWAP, MACD crosses above the signal line, and RSI is above 40.
Sell (Short): 5-period EMA crosses below the 21-period EMA, price is below VWAP, MACD crosses below the signal line, and RSI is below 60.
Exit Rules:
For long positions: When the 5-period EMA crosses below the 21-period EMA or MACD crosses below the signal line.
For short positions: When the 5-period EMA crosses above the 21-period EMA or MACD crosses above the signal line.
Visual Alerts:
Buy and sell signals are highlighted on the chart with green (buy) and red (sell) arrows below or above the corresponding candles.
Indicator Plotting:
The 5 and 21-period EMAs, as well as the VWAP, are plotted on the chart to facilitate the visualization of market conditions.
This script is a versatile tool for traders seeking to combine multiple technical indicators into a single strategy. It can be used across various timeframes and assets, allowing adjustments according to the trader's profile and market characteristics.
Juliano Einhardt Ulguim, Brazil, 05/27/2025.
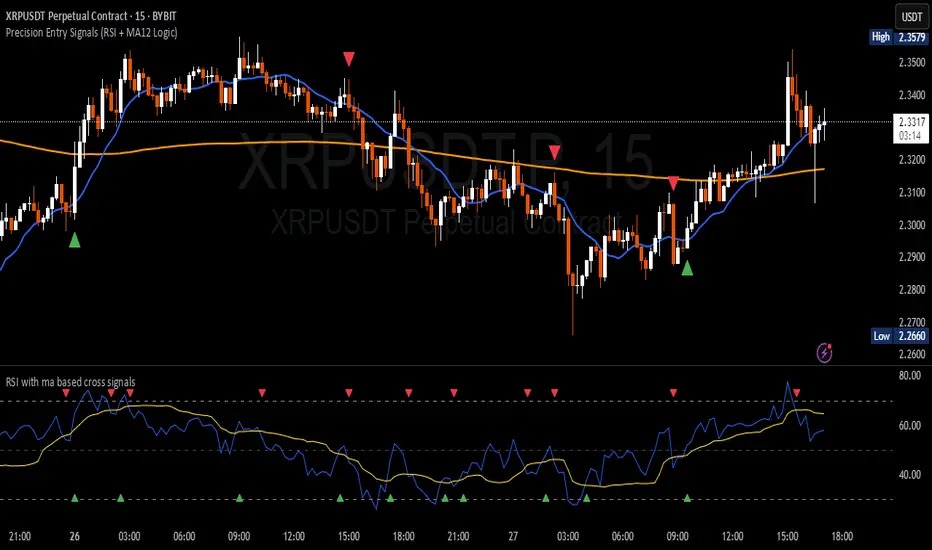
Precision Entry Signals (RSI + MA12 Logic)Description:
This script provides precise entry signals based on a clean confluence of MA12 breakouts and RSI momentum, filtered by a VWMA (Volume-Weighted Moving Average) of the RSI.
-----------------------------------------------------------------------------------------------------------------
🔹 Long entry conditions:
- Candle opens below the 12-period MA and closes above it
- RSI crosses above its VWMA
- Previous candle is bearish (additional confirmation)
🔹 Short entry conditions:
- Candle opens above the 12-period MA and closes below it
- RSI crosses below its VWMA
- Previous candle is bullish
----------------------------------------------------------------------------------------------------------------
Once a signal is confirmed, the script automatically draws:
Entry line (at close price)
Stop Loss line (just below recent lows for long, or above highs for short)
Take Profit 1 (1R)
Take Profit 2 (2R)
Labels are attached to the lines for clarity: ENTRY, SL, TP1, and TP2.
⚠️ Note: This tool only provides entry signals and visual risk/reward guidance. It does not manage exits dynamically. Manual trade management is recommended.
This script is intended for active intraday traders, especially on lower timeframes like 3-minute, 5-minute or 15-minute charts.
---------------------------------------------------------------------------------------------------------------
🔧 Recommended companion indicator:
For better confirmation and visual tracking of the RSI/VWMA cross logic, it is strongly recommended to also use the companion script:
🔹 Relative Strength Index (with MA based cross signals)
→ Shows RSI and its moving average visually, with triangle plots on every valid cross.
→ Matches exactly the RSI/VWMA behavior used in this entry signal script.
📌 Important:
After adding the RSI script to your chart, make sure to set:
RSI Length = 14
MA Type = VWMA
MA Length = 20
This ensures it visually matches the logic used by the entry signal script.
Both indicators are fully open source and meant to be used together — especially when trading manually.
Moving Average Deviation Rate with MA TypeJapanese below / 日本語説明は下記
This indicator displays moving average deviation rate with the ability to select moving average type with signals and alerts.
Price and moving average have the characteristics that when the price moves away from the moving average, it moves back to the moving average.
Example:
In the chart below, when the deviation rate increases to 2%(green circle), price momentum gradually decreases and it moves back to the moving average.
Taking advantage of this characteristic, traders can make decisions to take profit and/or take contrarian trades.
Signals can be displayed either on main chart or sub chart when the deviation rate crosses over/under upper/lower band.
Alert can be set with the same condition as the signals.
----------------------
移動平均線乖離率を表示することのできるインジケーターです。
移動平均線タイプを選択できる他、乖離率とアッパーバンド/ロワーバンドとのクロスでシグナルを表示することができます。
価格と移動平均線には、価格が移動平均線から乖離すると、再び移動平均線まで戻ってくるという特徴があります。
この特徴を利用することで、トレーダーは利益確定のタイミングや逆張りでポジションを取るタイミングを図ることができます。
例
以下のチャートでは乖離率が2%付近(黄緑の丸)まで上昇すると、価格の上昇の勢いが衰えて再び移動平均線まで戻っていることが確認できます。
乖離率とアッパーバンド/ロワーバンドがクロスした時に、メインチャートまたはサブチャートのいずれかにシグナルを表示することが可能です。
また、同じ条件でアラートを設定することもできます。

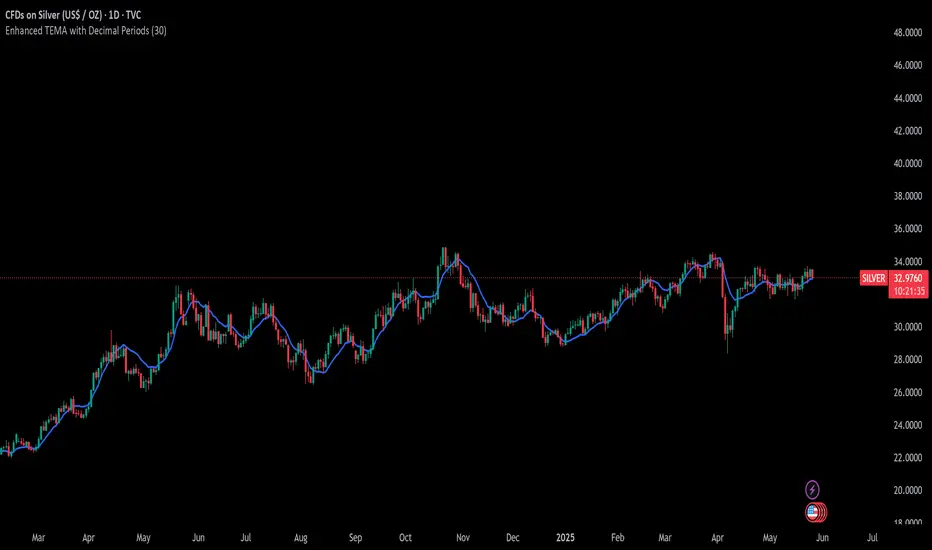
Enhanced TEMA with Decimal PeriodsImagine you have a special type of moving average line called a TEMA (Triple
Moving Average). A TEMA is designed to be even quicker to react to price changes than a regular EMA (Exponential Moving Average), helping traders spot trends faster.
What this script does:
Super-Precise TEMA Length:
Normally, when you set the "length" or "period" for a moving average, you use whole numbers (like 10 days, 20 days).
This script lets you be more precise and use decimal numbers for the TEMA's length (like 26.0 days, or even 26.7 days). This allows for very fine-tuning.
How it gets the "Decimal" EMA part (if you choose to use it):
If you want a TEMA with a length of, say, 26.7:
The script first needs to calculate EMAs with a length of 26.7.
To do this, it cleverly calculates two regular EMAs: one with a length of 26 and another with a length of 27 (the whole numbers just below and above 26.7).
Then, it blends these two EMAs. Since 26.7 is closer to 27, it takes more from the "27-period EMA" and a bit less from the "26-period EMA." This mix gives you an EMA that acts like it has a 26.7 period.
Building the TEMA:
A TEMA isn't just one EMA. It's made by taking an EMA of an EMA, and then an EMA of that. It's like smoothing the line multiple times, but in a special mathematical way to make it faster.
So, this script:
-Calculates the first "decimal EMA" (e.g., for 26.7).
-Calculates another "decimal EMA" of that first EMA line (again, using 26.7).
-Calculates a third "decimal EMA" of the second EMA line (still using 26.7).
Finally, it combines these three EMAs using a special TEMA formula to get the final, quick-reacting TEMA line.
Option to Switch Off Decimals:
There's a setting ("Use Decimal Periods"). If you turn this off, the script will just use regular whole-number EMAs to build the TEMA (it will round down your decimal input, so 26.7 would become 26).
Plotting:
The final "Enhanced TEMA" line is drawn on your price chart.
In Simple Terms:
This script gives you a TEMA (a fast-moving average) that you can set up with very precise decimal lengths (like 26.7 instead of just 26 or 27).
It does this "decimal magic" by smartly blending two regular EMAs. You can also choose to use it like a normal TEMA with whole numbers if you prefer. The goal is to give traders a very responsive trend-following line that can be fine-tuned to a high degree of precision.
BVB dominance bars
Hello everyone, this is my first indicator. these candles shows you who's in control. I like to think its some what close to heikin ashi candles as it shows you the Trend but doesn't average it out. also shows you when there is indecision. please read the instructions on how it works. its not a stand alone strategy. but adds value to your own strategy.
📖 How It Works
The BvB Dominance Bars indicator is a visual tool that colors candles based on market control—whether bulls or bears are in charge. It uses a custom metric comparing the price's relationship to a smoothed moving average (EMA), then normalizes that difference over time to express relative bullish or bearish pressure.
Here’s the breakdown:
Bulls vs Bears Logic:
A short-term EMA (default: 14-period) is used to establish a midpoint reference.
Bull Pressure is calculated as how far the high is above this EMA.
Bear Pressure is how far the low is below this EMA.
These are normalized over a lookback period (default: 120 bars) to produce percentile scores (0–100) for both bulls and bears.
Dominance & Color Coding:
The indicator compares normalized bull and bear scores.
Candles are color-coded based on:
Bright Lime: Strong Bull Dominance (with high confidence)
Soft Lime/Yellow: Moderate Bull Control
Bright Red: Strong Bear Dominance
Soft Red/Yellow: Moderate Bear Control
Gray: Neutral/Low conviction
Optional Live Label:
A small floating label shows who has control: “Bull Control,” “Bear Control,” or “Neutral.”
🧠 How to Use It (Example Strategy)
The BvB Dominance Bars indicator is not a standalone buy/sell signal but a market sentiment overlay. It’s most effective when combined with your own strategy, like price action or trend-following tools.
Here’s an example use case:
🧪 Reversal Confirmation Strategy
Objective: Catch high-probability reversals during key kill zones or supply/demand levels.
Setup:
Mark your key support/resistance zones using your standard method (e.g., FVGs, liquidity sweeps, or ICT PD arrays).
Wait for price to reach one of these zones.
Watch candle colors from the BvB Dominance Bars:
If you expect a bullish reversal, wait for a transition from red/gray candles to lime green or bright lime (bullish dominance taking over).
If you expect a bearish reversal, look for a change from green/gray to red or bright red.
Entry Filter:
Only enter if the dominant color holds for 2+ candles.
Avoid trades when candles are gray or yellow (indecision/neutral).
Exit Option:
Exit if dominance shifts against you (e.g., from lime to red), or use structure-based stops.
⚙️ Settings You Can Adjust:
BvB Period: Controls how fast EMA responds.
Bars Back: Determines how long the normalization looks back.
Thresholds: Influence how strong the dominance must be to change candle color.
✅ Best Used When:
You already have a bias and just want a confirmation of sentiment.
You're trading intraday and want a feel for shifting momentum without relying on noisy indicators.
You want a clean, color-coded overlay to help filter out fakeouts and indecision.

5 DMA (Close Above) Buy5 DMA (Close Above) Buy
This indicator identifies momentum-based breakout signals when a green candle closes above the 5-day Simple Moving Average (5DMA) for the first time after price was previously below it.
🔹 Signal Logic:
The script plots a green arrow below the candle when a bullish candle (close > open) closes above the 5DMA
Signals are only shown once per trend leg
The signal resets only after price closes back below the 5DMA
🔔 Built-in Alerts:
Use the included alert condition: "Buy Alert" to be notified in real time whenever a valid signal occurs.
This tool is ideal for traders seeking simple price-action confirmations to catch early trend continuation after pullbacks.
Parabolic-Fibonacci MA ForecastThis indicator displays a series of projected price levels based on Fibonacci moving averages. For each selected Fibonacci period, it calculates a simple moving average (SMA) and mirrors the distance from the current price to that SMA in the opposite direction, creating a vertical forecast distance. These forecast distances are drawn forward into the future using geometric spacing (squared increments: 1², 2², 3², etc.), creating a fan-like or polyline visual structure.
Users can choose between three display modes:
Fan: Lines drawn from the current price to projected values at increasing intervals
Polyline: Forecast points connected to form a jagged projection path
Both: Displays both fan and polyline structures simultaneously
Options are provided to adjust the number of Fibonacci lines (up to 12), line width, and colors for lines above/below price or up/down slope.
This tool can help visualize directional price tendencies using multiple SMA-based forecasts in a spatially meaningful layout.

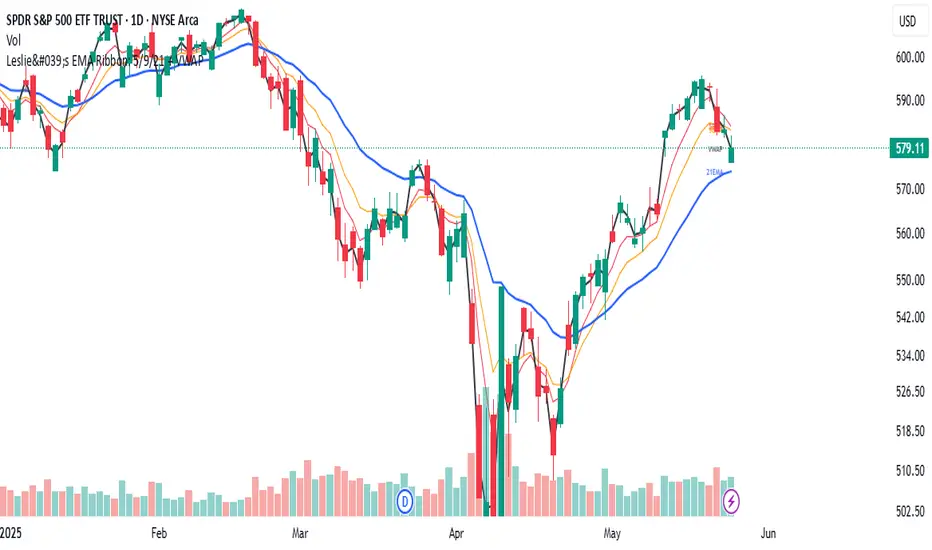
Leslie's EMA Ribbon: 5/9/21 + VWAPEMA + VWAP Crossover Indicator with Alerts
This script blends three Exponential Moving Averages (5, 9, 21) with VWAP to identify momentum shifts and volume-confirmed trend signals. It’s optimized for the Daily timeframe, but also adaptable to shorter-term trading.
🔍 Why this combination?
EMAs provide fast and reliable trend signals:
- 5/9 EMA crossover → short-term shifts (more frequent)
- 9/21 EMA crossover → swing confirmation (less noise)
- VWAP adds volume context used by institutions for fair value tracking.
- 9EMA crossing VWAP confirms price action supported by volume.
Together, these tools offer a multi-layered view of market momentum — combining speed, confirmation, and conviction.
⚙️ Features:
Clean plots with dynamic labels on latest bar
Adjustable line weights for clarity
Alerts included for all crossovers:
- 5EMA / 9EMA
- 9EMA / 21EMA
- 9EMA / VWAP
✅ How to Use:
- Best on the Daily timeframe
- Use 5/9 as early signals, 9/21 for trend filtering, and 9/VWAP for volume-backed setups
- Turn on alerts to stay informed of key shifts without staring at charts
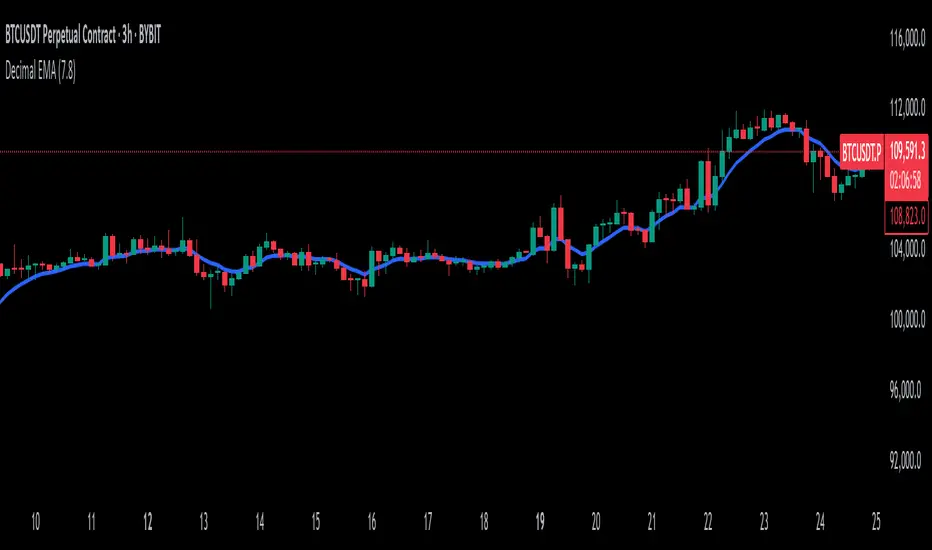
Decimal EMAImagine you want a moving average line, but you want its "length" or "period" to be super precise, like 2.7 days instead of just 2 days or 3 days.
This script lets you do that. Here's the simple idea:
You Pick a Decimal Number: In the settings, you can type in a period with a decimal, say, 2.7.
The Script Does a Smart Blend:
It first calculates two regular EMAs: one for the whole number below your choice (EMA for 2 days) and one for the whole number above (EMA for 3 days).
Then, it cleverly mixes these two EMA lines. Since 2.7 is closer to 3 than to 2, it takes more from the "3-day EMA" and a bit less from the "2-day EMA." (Specifically, it takes 70% from the 3-day EMA and 30% from the 2-day EMA).
You Get a Decimal EMA Line: The result is a new EMA line that acts as if its period was exactly 2.7. This line is drawn on your chart.
Why do this?
It allows for very fine-tuned adjustments to how responsive your moving average is, giving a smoother change if you're testing slightly different period lengths.
In Short:
This script calculates an EMA for a period like "2.7" by intelligently blending the results of an EMA for "2" and an EMA for "3".
Hybrid Adaptive Momentum Average (HAMA)Hybrid Adaptive Momentum Average (HAMA)
Imagine you want a moving average line on your chart that's usually smooth but gets really quick to follow the price when the market suddenly makes a big, fast move. That's what HAMA tries to be.
Here's the simple breakdown:
Slightly Better Starting Price: Instead of just using the closing price, HAMA first creates a slightly "smarter" starting price by giving a bit more importance to the very latest prices (like a quick WMA).
Checks Market Speed (Momentum): It then looks at how fast this "smarter price" has been moving recently.
-If the price is shooting up or down quickly, HAMA knows there's strong momentum.
-If the price is just drifting sideways, momentum is low.
Adjusts Its Own Speed: Based on this momentum:
-Strong Momentum (Fast Market): HAMA makes itself "faster." This means its line will stick closer to the current price and react quickly to changes. (It uses a shorter "period" internally).
-Weak Momentum (Slow/Choppy Market): HAMA makes itself "slower." Its line will be smoother and less jumpy, ignoring minor wiggles. (It uses a longer "period" internally).
-Draws the Line: Finally, it calculates and draws the moving average line using this automatically adjusted speed.
Why "Hybrid"?
It's called "hybrid" because it takes bits and pieces of ideas from several standard moving averages:
-Like an EMA, it's built to be responsive.
-Like a WMA, it initially focuses on recent prices.
-Inspired by the HMA, it tries to be smart about detecting momentum to adjust itself.
In a Nutshell:
The HAMA is a custom moving average that tries to be the best of both worlds: smooth in calm markets and quick to react in fast-moving markets by automatically changing its own calculation speed based on price momentum.

Mad Trading Scientist - Guppy MMA with Bollinger Bands📘 Indicator Name:
Guppy MMA with Bollinger Bands
🔍 What This Indicator Does:
This TradingView indicator combines Guppy Multiple Moving Averages (GMMA) with Bollinger Bands to help you identify trend direction and volatility zones, ideal for spotting pullback entries within trending markets.
🔵 1. Guppy Multiple Moving Averages (GMMA):
✅ Short-Term EMAs (Blue) — represent trader sentiment:
EMA 3, 5, 8, 10, 12, 15
✅ Long-Term EMAs (Red) — represent investor sentiment:
EMA 30, 35, 40, 45, 50, 60
Usage:
When blue (short) EMAs are above red (long) EMAs and spreading → Strong uptrend
When blue EMAs cross below red EMAs → Potential downtrend
⚫ 2. Bollinger Bands (Volatility Envelopes):
Length: 300 (captures the longer-term price range)
Basis: 300-period SMA
Upper & Lower Bands:
±1 Standard Deviation (light gray zone)
±2 Standard Deviations (dark gray zone)
Fill Zones:
Highlights standard deviation ranges
Emphasizes extreme vs. normal price moves
Usage:
Price touching ±2 SD bands signals potential exhaustion
Price reverting to the mean suggests pullback or re-entry opportunity
💡 Important Note: Use With Momentum Filter
✅ For superior accuracy, this indicator should be combined with your invite-only momentum filter on TradingView.
This filter helps confirm whether the trend has underlying strength or is losing momentum, increasing the probability of successful entries and exits.
🕒 Recommended Timeframe:
📆 1-Hour Chart (60m)
This setup is optimized for short- to medium-term swing trading, where Guppy structures and Bollinger reversion work best.
🔧 Practical Strategy Example:
Long Trade Setup:
Short EMAs are above long EMAs (strong uptrend)
Price pulls back to the lower 1 or 2 SD band
Momentum filter confirms bullish strength
Short Trade Setup:
Short EMAs are below long EMAs (strong downtrend)
Price rises to the upper 1 or 2 SD band
Momentum filter confirms bearish strength

EWMA & EWVar + EWStd Expansion with MTF_V.5EWMA & EWVar + EWStd Expansion with MTF_V.5
This indicator combines adaptive trend smoothing (EWMA), variance estimation (EWVar) and dynamic volatility “bursts” (EWStd Expansion) with optional higher-timeframe confirmation. It’s designed both for visual chart analysis and for automated alerts on regime changes.
Key Features
EWMA (Exponential Smoothing):
• Computes an exponential moving average with either a custom α or a length-derived α = 2/(N+1).
• Option to recalculate only every N bars (reduces CPU load).
EWVar & EWStd (Variance & Standard Deviation):
• Exponentially weighted variance tracks recent price dispersion.
• EWStd (σ) is computed alongside the EWMA.
• Z-score (deviation in σ units) shows how far price has diverged from trend.
Multi-Timeframe Filter (MTF):
• Optionally require the same trend direction on a chosen higher timeframe (e.g. Daily, Weekly, H4).
• Real-time lookahead available (may repaint).
Gradient Around EWMA:
• A multi-layer “glow” zone of ±1σ, broken into up to 10 steps.
• Color interpolates between “upper” and “lower” shades for bullish, bearish and neutral regimes.
Instantaneous Trendline (ITL):
• Ultra-fast trend filter with slope-based coloring.
• Highlights micro-trends and short-lived accelerations.
Cross-Over Signals (ITL ↔ EWMA):
• Up/down triangles plotted when the ITL crosses the main EWMA.
EWStd Expansion (Volatility Bursts):
• Automatically detects σ expansions (σ growth above a set % threshold).
• Price filter: only when price moves beyond EWMA ± (multiplier·σ).
• Optional higher-timeframe confirmation.
Labels & Alerts:
• Text labels and circular markers on bars where a volatility burst occurs.
• Built-in alertcondition calls for both bullish and bearish expansions.
How to Use
Visual Analysis:
• The gradient around EWMA shows the width of the volatility channel expanding or contracting.
• ITL color changes instantly highlight short-term impulses.
• EWMA line color switches (bullish/bearish/neutral) indicate trend state.
Spotting Volatility Breakouts:
• “EWStd Expansion” labels and circles signal the onset of strong moves when σ spikes.
• Useful for entering at the start of new impulses.
Automated Alerts:
• Set alerts on the built-in conditions “Bullish EWStd Expansion Alert” or “Bearish EWStd Expansion Alert” to receive a popup or mobile push when a burst occurs.
This compact tool unifies trend, volatility and multi-timeframe analysis into a single indicator—ideal for traders who want to see trend direction, current dispersion, and timely volatility burst signals all at once.

Price/MA Deviation AngleThis indicator visualizes the angular deviation of price from a selected moving average (default: 21 EMA). It calculates the angle, in degrees, formed by the vertical distance between price and the moving average — assuming a one-bar horizontal distance.
Positive angles indicate upward deviation (bullish pressure).
Negative angles reflect downward deviation (bearish pressure).
0° represents perfect alignment between price and the MA.
±45° thresholds can be used as reference for strong momentum.
This tool offers a normalized, intuitive perspective on price momentum using geometric interpretation rather than price-to-price delta.

Multi-EnvelopeRMA Multi-Envelope Indicator
The RMA Multi-Envelope Indicator is a technical analysis tool designed for TradingView, utilizing Pine Script v6. It creates eight customizable envelope bands around a 200-period Running Moving Average (RMA) on a 5-minute timeframe, based on current market measurements. Each band has independent upper and lower percentage deviations, preset to: Band 1 (0.42%, 0.46%), Band 2 (0.78%, 0.69%), Band 3 (1.01%, 1.03%), Band 4 (1.36%, 1.39%), Band 5 (1.80%, 1.62%), Band 6 (2.15%, 2.13%), Band 7 (2.93%, 2.81%), and Band 8 (4.65%, 4.18%). Users can adjust the timeframe, moving average type (RMA, SMA, or EMA), length, and colors for the basis line and bands via hex codes (e.g., #FF6D00 for the basis and Band 8) with semi-transparent color.rgb fills. Ideal for identifying support/resistance, overbought/oversold conditions, or trend boundaries on a 5-minute chart.

Median True Range {Darkoexe}Simple and sweet, this is the median true range. It reviews the size of the previous period amount of candles, and displays the candle size value that is the median of those previous values.
//Darkoexe

MA OrderlinessMA Orderliness measures how well a series of simple moving averages (SMAs) are stacked in the expected order for a trending market and turns that measurement into a normalized oscillator. You choose how many MAs to include and the shortest and longest lengths. The script generates a family of evenly spaced SMAs between those lengths, then compares each pair: shorter MAs should lie above longer ones in an uptrend and below in a downtrend. When any pair is out of order, a “violation” score is accumulated, but violations between nearby MAs count more heavily than those between MAs that are far apart. All weights are summed, and the total weighted violations are converted into a score from –1 (completely reversed) to +1 (perfectly ordered).
This orderliness score is plotted as a line oscillator. A fixed horizontal line at +1 marks perfect order, and another at –1 marks perfect reversal. To smooth the raw oscillator and generate trading signals, the script also plots a simple moving average of the orderliness score over a user-defined period. When the unsmoothed score crosses above its moving average, a bullish crossover alert fires. When it crosses below, a bearish crossover alert fires.
Everything is calculated on each bar so you can see the oscillator evolve in real time. You can customize the number of MAs, their minimum and maximum lengths, and the length of the signal-line SMA to suit different timeframes or markets.

MFI + RSI + EMA Dynamic SignalsThe MFI + RSI + EMA Dynamic Signals is a designed to combine with widened criteria to capture more trading opportunities, it balances momentum, trend, and flexibility, making it suitable for trading on timeframes like 15-minute to 4-hour charts.
How It Works
The indicator uses three technical components with relaxed criteria to produce signals:
Money Flow Index (MFI) for Momentum Extremes:
The MFI, calculated over a 14-period length, measures buying and selling pressure using price and volume. A buy signal can trigger when MFI crosses above the oversold level (default: 30, widened from 20), indicating potential buying pressure, while a sell signal can occur when MFI crosses below the overbought level (default: 70, widened from 80), suggesting selling pressure.
Relative Strength Index (RSI) for Momentum Confirmation:
The RSI, calculated over a 14-period length, confirms momentum strength. Bullish momentum is confirmed when RSI is above a buy threshold (default: 45, relaxed from 50), and bearish momentum when below a sell threshold (default: 55, relaxed from 50), allowing more signals near neutral momentum levels.
Exponential Moving Average (EMA) for Trend Sensitivity:
The indicator uses a fast EMA (default: 9 periods) and a slow EMA (default: 21 periods) to detect trend direction and crossovers. Signals can trigger when the fast EMA crosses the slow EMA, or when the fast EMA is within a proximity threshold (default: 0.5%) of the slow EMA, capturing early trend changes and increasing signal frequency.
Signal Generation
Signals are generated using the previous bar’s values to prevent repainting, with widened criteria for more frequent triggers:
Buy Signal: Either the MFI crosses above the oversold level or the fast EMA crosses above the slow EMA, and either RSI confirms bullish momentum (above 45) or the EMAs are near a crossover (within 0.5%). Displayed as a green upward triangle below the bar.
Sell Signal: Either the MFI crosses below the overbought level or the fast EMA crosses below the slow EMA, and either RSI confirms bearish momentum (below 55) or the EMAs are near a crossover (within 0.5%). Displayed as a red downward triangle above the bar.
