Volume-Weighted Trend Strength indexVolume-Weighted Trend Strength index (VWTSI)
Introduction
The VWTSI is a custom indicator designed to combine trend strength, volume, and volatility to give traders a comprehensive view of market dynamics. It provides flexibility by allowing you to visualize the indicator as either an oscillator or a moving average.
Features
Dual Visualization: Can be displayed either as an oscillator or as a moving average on the chart.
Volume-Weighted: Adjusts trend strength based on current volume compared to its average.
Volatility-Adjusted: Incorporates market volatility into the trend strength calculation.
Customizable: Various parameters can be fine-tuned to suit different trading environments.
How It Works
1. Trend Strength Calculation
The difference between the fast (10-period) and slow (30-period) EMAs is used to calculate trend strength, which gives a percentage-based indication of the trend's strength
2. Volatility Adjustment
The ATR-based volatility is calculated and used to amplify or reduce the trend strength based on the current market conditions
3. Volume Adjustment
The ratio of current volume to the volume SMA adds another layer of adjustment to the final VWTSI value
4. Final VWTSI Calculation
The VWTSI value is the product of trend strength, volatility factor, and volume ratio
5. Normalization
The final VWTSI is normalized to fit within a range of -100 to 100 for better visualization in oscillator mode
Customization Inputs
Fast EMA Length: Default is 10.
Slow EMA Length: Default is 30.
Volume Length: Default is 14.
Volatility Length (ATR): Default is 20.
Oscillator or MA Mode: Toggle between displaying the indicator as an oscillator or moving average.
Moving Averages

MENTFX AVERAGES MULTI TIMEFRAMEThe MENTFX AVERAGES MULTIME TIMEFRAME indicator is designed to provide traders with the ability to visualize multiple moving averages (MAs) from higher timeframes on their current chart, regardless of the chart's timeframe. It combines the power of exponential moving averages (EMAs) to help traders identify trends, spot potential reversal points, and make more informed trading decisions.
Key Features:
Multi-Timeframe Moving Averages: This indicator plots moving averages from daily timeframes directly on your chart, helping you keep track of higher timeframe trends while trading in any timeframe.
Customizable Moving Averages: You can adjust the length and visibility of up to three EMAs (default settings are 5, 10, and 20-period EMAs) to suit your trading style.
Overlay on Price: The indicator is designed to be overlaid on your price chart, seamlessly integrating with your existing analysis.
Simple but Effective: By offering a clear visual guide to where price is trading relative to important higher timeframe levels, this indicator helps traders avoid trading against major trends.
Why It’s Unique:
Validation Timeframe Flexibility: Unlike traditional moving average indicators that only work within the same chart's timeframe, the MENTFX AVERAGES M indicator allows you to pull moving averages from higher timeframes (default: Daily) and overlay them on any chart you're currently viewing, whether it's intraday (minutes) or even weekly. This cross-timeframe visibility is critical in determining the true market trend, adding context to your trades.
Customizability: Although the default settings focus on daily EMAs (5, 10, and 20 periods), traders can modify the parameters, including the type of moving average (Simple, Weighted, etc.), making it adaptable for any strategy. Whether you want shorter-term or longer-term averages, this indicator covers your needs.
Trend Confirmation Tool: The use of multiple EMAs helps traders confirm trend direction and potential price breakouts or reversals. For example, when the shorter-term 5 EMA crosses above the 20 EMA, it can signal a potential bullish trend, while the opposite could indicate bearish pressure.
How This Indicator Helps:
Identify Key Support and Resistance Levels: Higher timeframe moving averages often act as dynamic support and resistance. This indicator helps you stay aware of those critical levels, even when trading lower timeframes.
Trend Identification: Knowing where the market is relative to the 5, 10, and 20 EMAs from a higher timeframe gives you a clearer picture of whether you're trading with or against the prevailing trend.
Improved Decision Making: By aligning your trades with the direction of higher timeframe trends, you can increase your confidence in trade entries and exits, avoiding low-probability setups.
Multi-Market Use: This indicator works well across various asset classes—stocks, forex, crypto, and commodities—making it versatile for any trader.
How to Use:
Intraday Trading: Use the daily EMAs as a guide to see if intraday price movements align with longer-term trends.
Swing Trading: Plot daily EMAs to track the strength of a larger trend, using pullbacks to the moving averages as potential entry points.
Trend Trading: Monitor crossovers between the moving averages to signal potential changes in trend direction.
Default Settings:
5 EMA (Daily) – Blue Line
10 EMA (Daily) – Black Line
20 EMA (Daily) – Red Line
These lines will plot on your chart with a subtle opacity (33%) to ensure they don’t obstruct price action, while still providing crucial visual guidance on market trends.
This indicator is perfect for traders who want to blend technical analysis with multi-timeframe insights, helping you stay in sync with broader market movements while executing trades on any timeframe.

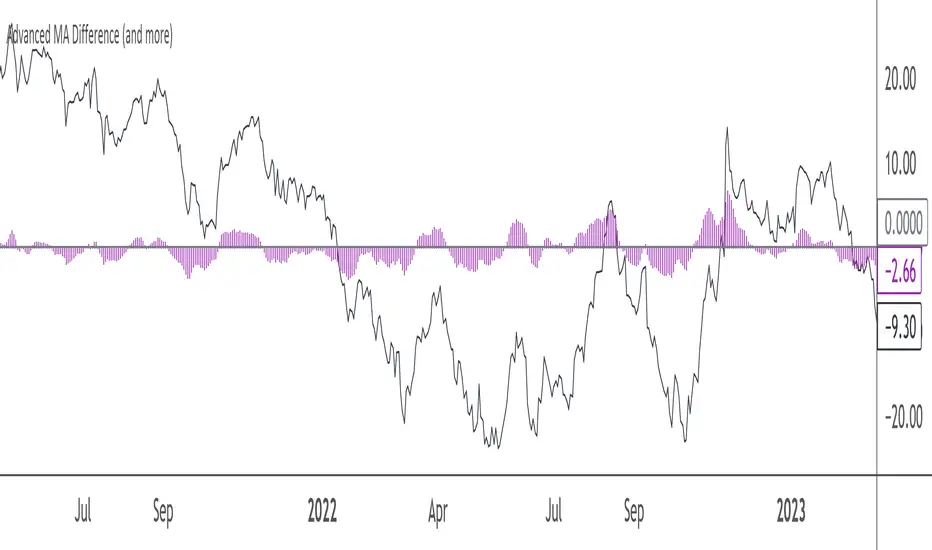
Advanced MA Difference (and more)This Pine Script indicator calculates the difference between the price and a main moving average (SMA or EMA), allowing you to track deviations in either absolute or relative (percentage) terms. It offers several features to help visualize and smooth this difference:
- Main MA Difference: Shows the price deviation from the moving average, either as an absolute dollar amount or as a percentage.
- Fast and Slow Moving Averages: Optionally smooths the difference using fast and slow moving averages, giving insights into short-term and long-term trends in price deviations.
- Difference Between Fast and Slow MAs : Highlights the gap between these MAs, helping to identify momentum shifts.
- Customizable Visuals: Offers flexibility in displaying the difference and moving averages using lines or histograms, and includes a zero line for reference.
When to Use It:
- Use the absolute difference for tracking raw price deviations if you’re focused on concrete moves in the asset’s price.
- Use the relative difference for normalized, percentage-based deviations, especially useful when comparing different assets or time frames.
This indicator is suitable for traders looking to spot trends, price deviations, or momentum shifts relative to a moving average. Its flexibility makes it a good fit for both short-term and long-term analysis.
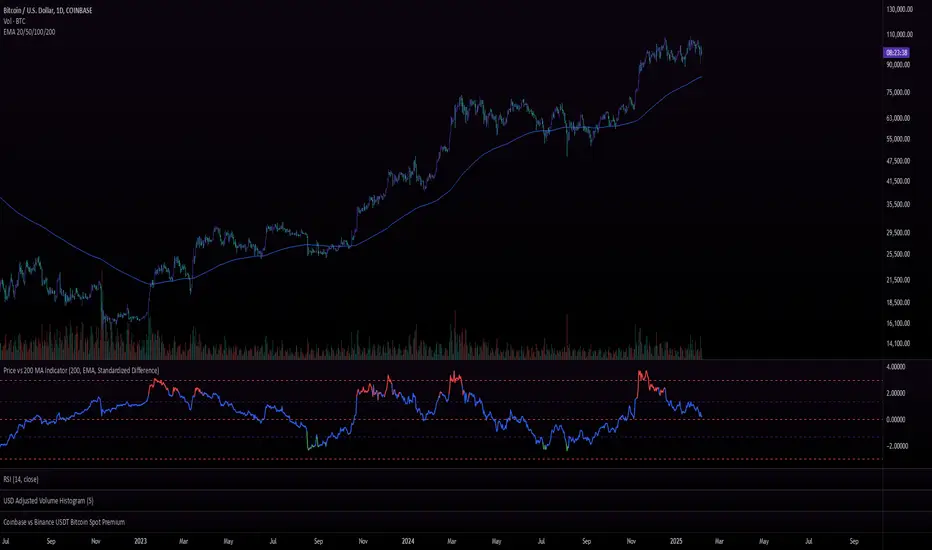
Price vs 200 EMA IndicatorPurpose :
The Price vs. 200 MA (EMA) Indicator measures the deviation of the current price from its 200-period Exponential Moving Average (EMA). Instead of merely plotting the raw difference, the indicator calculates a standardized difference (similar to a z-score), which quantifies the deviation in terms of standard deviations over time. This helps traders understand how extreme the price is relative to its long-term average and its typical volatility.
Use Cases :
Trend Analysis:
Traders can use the standardized difference to assess how extreme the current price is relative to its long-term trend (200 EMA) while normalizing for volatility.
When the z-score approaches extreme levels (e.g., above 2 or below -2), it may indicate that the asset is overextended in either direction.
Mean Reversion Strategy:
Since the indicator identifies when the price deviates far from the 200 EMA (in terms of standard deviations), traders can use it to time mean-reversion trades, buying when the price is below -2 (oversold) and selling when it’s above +2 (overbought).
Trend Continuation or Exhaustion:
If the price continues to stay above +2 for extended periods, it could indicate a strong trend, whereas a reversion toward the EMA after reaching +2 or -2 could signal trend exhaustion or reversal.
Summary :
The Price vs. 200 MA (EMA) Indicator calculates the standardized difference (z-score) between the price and its 200-period EMA, giving traders a normalized measure of how far the price is from its long-term average, relative to typical price volatility. The color-coded plot provides a clear visual representation of potential overbought/oversold conditions and highlights when the price has deviated significantly from the 200 EMA in either direction.
RSI with Swing Trade by Kelvin_VAlgorithm Description: "RSI with Swing Trade by Kelvin_V"
1. Introduction:
This algorithm uses the RSI (Relative Strength Index) and optional Moving Averages (MA) to detect potential uptrends and downtrends in the market. The key feature of this script is that it visually changes the candle colors based on the market conditions, making it easier for users to identify potential trend swings or wave patterns.
The strategy offers flexibility by allowing users to enable or disable the MA condition. When the MA condition is enabled, the strategy will confirm trends using two moving averages. When disabled, the strategy will only use RSI to detect potential market swings.
2. Key Features of the Algorithm:
RSI (Relative Strength Index):
The RSI is used to identify potential market turning points based on overbought and oversold conditions.
When the RSI exceeds a predefined upper threshold (e.g., 60), it suggests a potential uptrend.
When the RSI drops below a lower threshold (e.g., 40), it suggests a potential downtrend.
Moving Averages (MA) - Optional:
Two Moving Averages (Short MA and Long MA) are used to confirm trends.
If the Short MA crosses above the Long MA, it indicates an uptrend.
If the Short MA crosses below the Long MA, it indicates a downtrend.
Users have the option to enable or disable this MA condition.
Visual Candle Coloring:
Green candles represent a potential uptrend, indicating a bullish move based on RSI (and MA if enabled).
Red candles represent a potential downtrend, indicating a bearish move based on RSI (and MA if enabled).
3. How the Algorithm Works:
RSI Levels:
The user can set RSI upper and lower bands to represent potential overbought and oversold levels. For example:
RSI > 60: Indicates a potential uptrend (bullish move).
RSI < 40: Indicates a potential downtrend (bearish move).
Optional MA Condition:
The algorithm also allows the user to apply the MA condition to further confirm the trend:
Short MA > Long MA: Confirms an uptrend, reinforcing a bullish signal.
Short MA < Long MA: Confirms a downtrend, reinforcing a bearish signal.
This condition can be disabled, allowing the user to focus solely on RSI signals if desired.
Swing Trade Logic:
Uptrend: If the RSI exceeds the upper threshold (e.g., 60) and (optionally) the Short MA is above the Long MA, the candles will turn green to signal a potential uptrend.
Downtrend: If the RSI falls below the lower threshold (e.g., 40) and (optionally) the Short MA is below the Long MA, the candles will turn red to signal a potential downtrend.
Visual Representation:
The candle colors change dynamically based on the RSI values and moving average conditions, making it easier for traders to visually identify potential trend swings or wave patterns without relying on complex chart analysis.
4. User Customization:
The algorithm provides multiple customization options:
RSI Length: Users can adjust the period for RSI calculation (default is 4).
RSI Upper Band (Potential Uptrend): Users can customize the upper RSI level (default is 60) to indicate a potential bullish move.
RSI Lower Band (Potential Downtrend): Users can customize the lower RSI level (default is 40) to indicate a potential bearish move.
MA Type: Users can choose between SMA (Simple Moving Average) and EMA (Exponential Moving Average) for moving average calculations.
Enable/Disable MA Condition: Users can toggle the MA condition on or off, depending on whether they want to add moving averages to the trend confirmation process.
5. Benefits of the Algorithm:
Easy Identification of Trends: By changing candle colors based on RSI and MA conditions, the algorithm makes it easy for users to visually detect potential trend reversals and trend swings.
Flexible Conditions: The user has full control over the RSI and MA settings, allowing them to adapt the strategy to different market conditions and timeframes.
Clear Visualization: With the candle color changes, users can quickly recognize when a potential uptrend or downtrend is forming, enabling faster decision-making in their trading.
6. Example Usage:
Day traders: Can apply this strategy on short timeframes such as 5 minutes or 15 minutes to detect quick trends or reversals.
Swing traders: Can use this strategy on longer timeframes like 1 hour or 4 hours to identify and follow larger market swings.

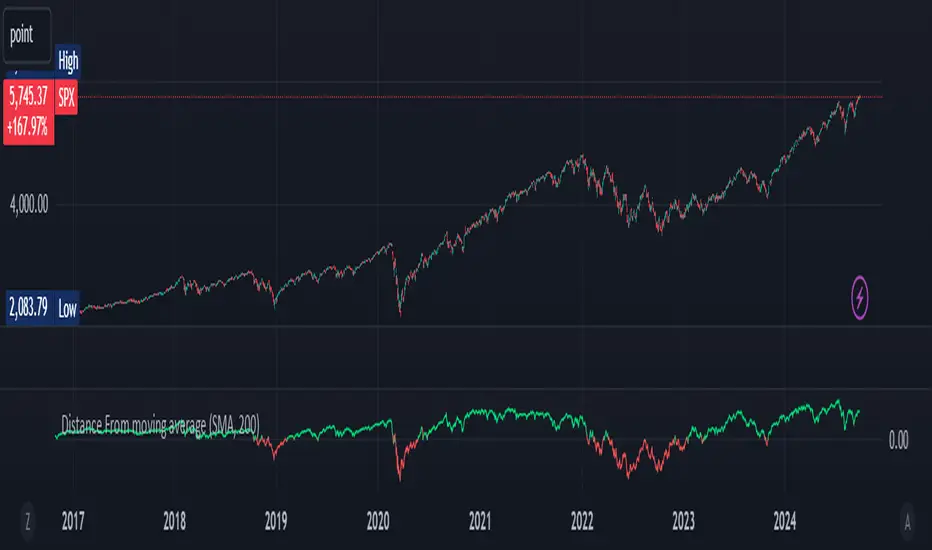
Distance From moving averageDistance From Moving Average is designed to help traders visualize the deviation of the current price from a specified moving average. Users can select from four different types of moving averages: Simple Moving Average (SMA), Exponential Moving Average (EMA), Weighted Moving Average (WMA), and Hull Moving Average (HMA).
Key Features:
User-Friendly Input Options:
Choose the type of moving average from a dropdown menu.
Set the length of the moving average, with a default value of 200.
Custom Moving Average Calculations:
The script computes the selected moving average using the appropriate mathematical formula, allowing for versatile analysis based on individual trading strategies.
Distance Calculation:
The indicator calculates the distance between the current price and the chosen moving average, providing insight into market momentum. A positive value indicates that the price is above the moving average, while a negative value shows it is below.
Visual Representation:
The distance is plotted on the chart, with color coding:
Lime: Indicates that the price is above the moving average (bullish sentiment).
Red: Indicates that the price is below the moving average (bearish sentiment).
Customization:
Users can further customize the appearance of the plotted line, enhancing clarity and visibility on the chart.
This indicator is particularly useful for traders looking to gauge market conditions and make informed decisions based on the relationship between current prices and key moving averages.
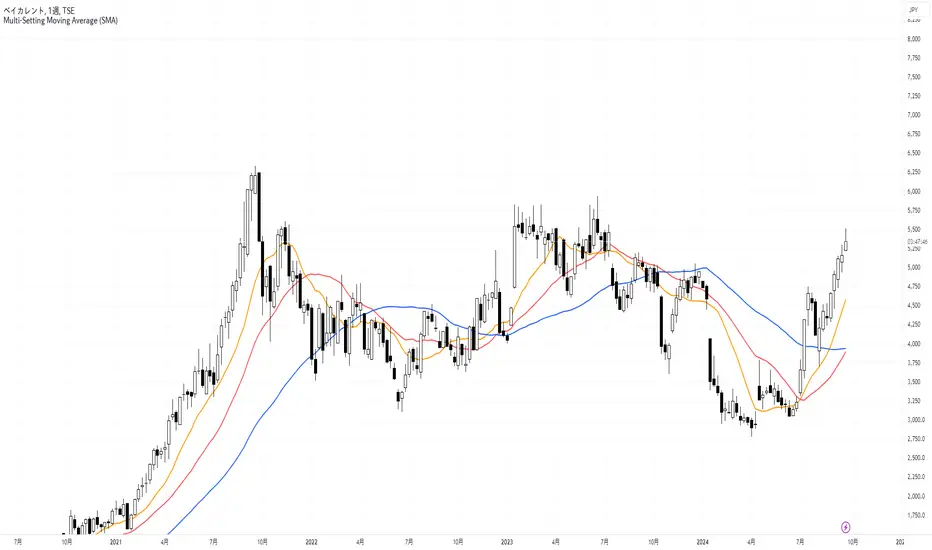
Multi-Setting Moving AverageThis indicator is a TradingView tool that allows you to set the calculation periods for moving averages according to different time frames.
Unlike standard moving average indicators, which require manual adjustments when changing time frames, this indicator is designed to automatically reflect the settings for each time frame, eliminating the hassle of changing settings.
このインジケーターは、異なる時間枠に応じた移動平均線の計算期間を設定できるトレーディングビューのツールです。
一般の移動平均線のインジケーターは時間枠の変更に伴って手動で設定を調整する必要がありますが、このインジケーターは時間枠ごとの設定が自動で反映されるように工夫されているため、設定変更の手間が省けます。
LiquidityFlow Dominance+Alerts (btc.d, T3, Stables)LiquidityFlow Dominance+Alerts: Overview & Usage Guide
Overview
The LiquidityFlow Dominance+Alerts indicator provides a dynamic view of liquidity flow across Bitcoin, Altcoins, and Stablecoins, helping track liquidity shifts and identify market sentiment. By integrating moving averages, custom alerts, and thresholds for extreme outliers, this indicator helps to anticipate bullish and bearish shifts in liquidity and alert market tops and bottoms.
Key features include:
1. Liquidity Flow Monitoring : Track liquidity flow across Bitcoin (BTC), Altcoins (TOTAL3), and Stablecoins (USDT, USDC, DAI).
2. Custom Alerts : Set alerts for key liquidity shifts and extreme conditions in Stablecoin dominance, both with static and moving average (MA)-based calculations.
3. Moving Averages : Use Simple, Exponential, or Weighted Moving Averages to smooth out market data for more reliable signals.
4. Outlier Detection : Identify potential tops and bottoms using thresholds for Stablecoin dominance, with alerts for extreme movements.
Functionality
Data Inputs and Key Metrics
- Symbols Monitored:
- Bitcoin Dominance (BTC.D)
- Altcoin Market Cap (TOTAL3)
- Stablecoins (USDT.D, USDC.D, DAI.D)
- Liquidity Flow Conditions:
- Track percentage changes in dominance across sectors to detect liquidity flow into Bitcoin, Altcoins, or Stablecoins.
- Custom Metrics:
- Liquidity Flow Index: BTC Dominance minus Stablecoin Dominance.
- Liquidity Flow Ratio: BTC Dominance divided by the combined dominance of Stablecoins and Altcoins.
Moving Average Integration
- Select from SMA, EMA, or WMA to apply moving averages to the dominance metrics. Moving averages help smooth out short-term volatility and provide more consistent signals.
- Moving averages are applied to each sector (BTC, Altcoins, and Stablecoins) and compared to their previous period values to determine shifts in liquidity.
Alerts and Thresholds
- % Change Lookback Period: Adjust the lookback period to align with the timeframe of your chart. Shorter timeframes may require a lower lookback period, while higher timeframes may benefit from longer periods.
- Stables Bull/Bear % for Alerts: Set a threshold for when Stablecoin dominance becomes a bullish or bearish signal relative to BTC and Altcoins. A higher threshold may be used in volatile markets to filter out noise.
- Extreme Outliers Detection: Use the **Stables Up/Down Extreme Threshold** to identify potential market tops or bottoms when Stablecoin dominance deviates significantly from historical trends. The **Extreme Lookback Period** controls the time window for detecting these anomalies.
How to Use the Indicator
Adjusting the % Change Lookback Period
- The `% Change Lookback Period` should be adjusted based on your chart’s timeframe. For example, a shorter period (e.g., 7) works well for intraday charts, while longer periods (e.g., 14) might be more suitable for daily or weekly charts.
Setting Thresholds for Alerts
- Stables Bull/Bear % for Alerts: Adjust this setting to define when Stablecoin dominance triggers bullish or bearish alerts. A value like 1% could be a good starting point for most market conditions but can be fine-tuned based on volatility.
- Extreme Lookback Period: Define the lookback period for detecting extreme moves in Stablecoin dominance. This will help identify major tops and bottoms in the market. For shorter-term trades, consider using a shorter extreme lookback (e.g., 7-10 periods).
Alerts for Liquidity Shifts
- The indicator supports alerts for key liquidity shifts, which are useful for staying ahead of market movements. Alerts can be set to notify you when liquidity moves into:
- Bitcoin: Indicating a potential bullish trend for Bitcoin.
- Altcoins: Signaling altcoins are bullish.
- Stablecoins: Suggesting a risk-off environment or market correction.
Extreme Alerts for Stables
- Extreme Up/Down Alerts: These are triggered when Stablecoin dominance crosses extreme thresholds. For example, if Stablecoin dominance rises more than 14% over a set period, it could signal a market top, while a significant drop could indicate a market bottom.
Moving Average Calculations
- In addition to static percentage changes, moving averages can be applied to smooth out dominance values. The type and length of the moving average can be customized:
- SMA (Simple Moving Average): Best for smoothing out volatility in a linear way.
- EMA (Exponential Moving Average): More responsive to recent data, making it useful in faster markets.
- WMA (Weighted Moving Average): Emphasizes more recent data, but less reactive than the EMA.
Additional Usage Tips:
- Background Colors: The indicator visually highlights the dominant liquidity flow:
- Orange: Liquidity is shifting toward Bitcoin.
- Aqua: Liquidity is flowing into Altcoins.
- Red: Liquidity is moving into Stablecoins.

Auto Anchored Swing VWAP'sThe Auto Anchored Swing VWAP's indicator automatically anchors Volume-Weighted Average Price (VWAP) lines to recent swing highs and swing lows. VWAPs often act as key support or resistance levels because they represent the average price at which the majority of trading volume has occurred over a given time.
What is VWAP? VWAP is an essential tool in trading, representing the average price of a security over a specific period, weighted by volume. It helps traders identify the average price at which most trades have been executed, providing a balanced view of price action over time.
Anchored VWAPs: Unlike traditional VWAPs, which start from the beginning of the day, anchored VWAPs allow traders to "anchor" the calculation to a specific point in time or a pivot on the chart, in this case a swing high and swing low. This version of VWAP follows the price action from a selected point forward.
When the price is above the VWAP, it indicates that the majority of traders have paid less for the asset, creating a potential support zone as buyers may step in at or near this level. On the other hand, when the price is below the VWAP, it suggests that most traders have paid a higher price, which can lead to a resistance level where sellers may appear to defend their positions.
Anchored VWAPs, in particular, provide more precise support and resistance levels by starting from a specific swing high, swing low, or other significant point on the chart. This allows traders to track how price interacts with these levels after a certain bar.
The selectable pivot lookback length in this indicator defines the number of bars to the left and right of a potential swing high or swing low that must be lower (for a swing high) or higher (for a swing low) in order to confirm the pivot. In other words, it controls how many surrounding bars need to validate a local price extreme before it is considered a true swing point.
For example, if the lookback length is set to 9, a swing high is identified when there are 9 bars to the left and 9 bars to the right that all have lower highs than the current bar. The same logic applies for swing lows, where the price must be lower than the highs of the bars to the left and right for it to be considered a swing low.
This parameter allows traders to control the sensitivity of the swing points used to anchor VWAPs. A smaller lookback value will identify more frequent and short-term swing highs and lows, making the VWAPs more responsive to recent price action. Conversely, a larger lookback value will result in fewer but more significant swing points.
Pine Script
Utilization of Pine Script’s Enum Feature: This indicator leverages Pine Script's new enum feature for the selection of the VWAP lines (solid, dashed, or dotted) style.
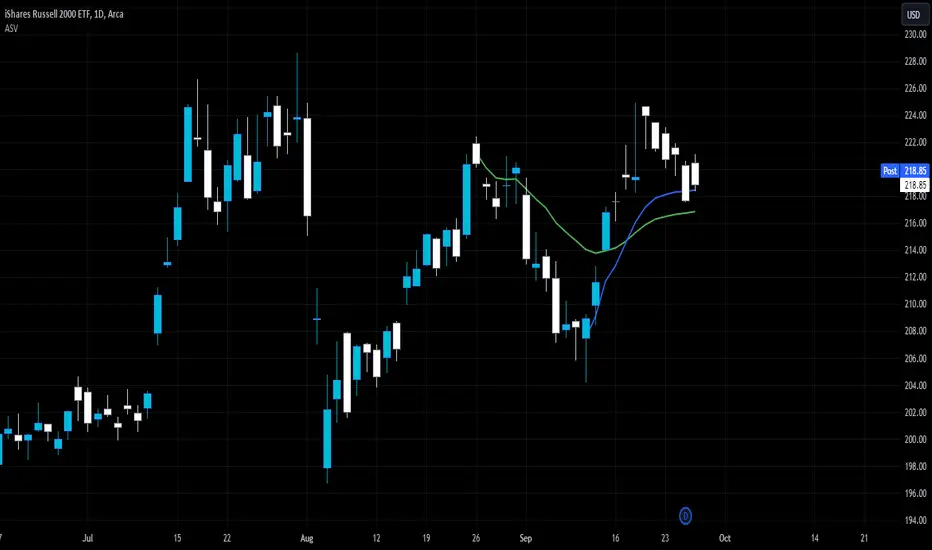
Day & Swing Trading EMA Clouds with Adaptive LevelsDay & Swing Trading EMA Clouds with Adaptive Levels is a tool designed for traders who need a flexible indicator that adapts to both short-term (day trading) and long-term (swing trading) strategies. The indicator blends EMA clouds and adaptive support/resistance levels, making it suitable for analyzing trend strength and key price zones.
How It Works:
EMA Clouds for Trend Detection:
This indicator uses three EMAs (Fast, Intermediate, Slow) to create two clouds:
Fast Cloud: The area between the fast and Intermediate EMAs.
Slow Cloud: The area between the Intermediate and slow EMAs.
The cloud colors change based on trend direction:
Positive (uptrend): When the fast EMA is above the Intermediate EMA (turquoise) or the Intermediate EMA is above the slow EMA (teal).
Negative (downtrend): When the fast EMA is below the Intermediate EMA (pink) or the Intermediate EMA is below the slow EMA (magenta).
Traders can use these clouds to visually gauge market momentum and trend reversals.
Adaptive EMA Settings Based on Trading Mode:
The EMA lengths adjust automatically depending on whether you're in Day Trading or Swing Trading mode:
Day Trading Mode uses shorter periods to capture quick price movements:
Fast EMA: 5-period
Mid EMA: 13-period
Slow EMA: 21-period
Swing Trading Mode uses longer periods to capture broader trends:
Fast EMA: 12-period
Mid EMA: 26-period
Slow EMA: 50-period
This dynamic adjustment allows you to switch between trading styles seamlessly, with the EMAs reflecting the most relevant timeframes for each strategy.
Adaptive Support and Resistance Levels:
Depending on the selected trading mode, the indicator dynamically plots key levels:
Day Trading Mode: Previous day’s high, low, and midpoint, as well as 2-day levels.
Swing Trading Mode: Previous month’s high, low, and midpoint, as well as 2-month levels.
These levels act as dynamic support and resistance zones, giving traders critical areas to monitor for potential reversals or breakouts.
Buy & Sell Signals:
Visual buy/sell signals are generated when the fast EMA crosses above or below the slow EMA. These signals can help traders identify potential trend reversals.
Customization:
You can fully adjust the transparency and colors of the clouds to fit your personal preferences and trading style.
Why This Combination?
Combining EMA clouds with adaptive levels provides traders with a complete picture. The clouds highlight the underlying market momentum and trend strength, while the adaptive levels offer potential entry/exit points based on historical price action. This unique mashup allows traders to follow trends and plan trades around key support and resistance zones.

EMA GridThe EMA Grid indicator is a powerful tool that calculates the overall market sentiment by comparing the order of 20 different Exponential Moving Averages (EMAs) over various lengths. The indicator assigns a rating based on how well-ordered the EMAs are relative to each other, representing the strength and direction of the market trend. It also smooths out the macro movements using cumulative calculations and visually represents the market sentiment through color-coded bands.
EMA Calculation:
The indicator uses a series of EMAs with different lengths, starting from 5 and going up to 100. Each EMA is calculated either using the exponential moving averages.
The EMAs form the grid that the indicator uses to measure the order and distance between them.
Rating Calculation:
The indicator computes the relative distance between consecutive EMAs and sums these differences.
The cumulative sum is further smoothed using multiple EMAs with different lengths (from 3 to 21). This smooths out short-term fluctuations and helps identify broader trends.
Market Sentiment Rating:
The overall sentiment is calculated by comparing the values of these smoothing EMAs. If the shorter-term EMA is above the longer-term EMA, it contributes positively to the sentiment; otherwise, it contributes negatively.
The final rating is a normalized value based on the relationship between these EMAs, producing a sentiment score between 1 (bullish) and -1 (bearish).
Color Coding and Bands:
The indicator uses the sentiment rating to color the space between the 100 EMA and 200 EMA, representing the strength of the trend.
If the sentiment is bullish (rating > 0), the band is shaded green. If the sentiment is bearish (rating < 0), the band is shaded red.
The intensity of the color is based on the strength of the sentiment, with stronger trends resulting in more saturated colors.
Utility for Traders:
The EMA Grid is ideal for traders looking to gauge the broader market trend by analyzing the structure and alignment of multiple EMAs. The color-coded band between the 100 and 200 EMAs provides an at-a-glance view of market momentum, helping traders make informed decisions based on the trend's strength and direction.
This indicator can be used to identify bullish or bearish conditions and offers a smoothed perspective on market trends, reducing noise and highlighting significant trend shifts.

Daksh RSI POINT to ShootHere are the key points and features of the Pine Script provided:
### 1. **Indicator Settings**:
- The indicator is named **"POINT and Shoot"** and is set for non-overlay (`overlay=false`) on the chart.
- `max_bars_back=4000` is defined, indicating the maximum number of bars that the script can reference.
### 2. **Input Parameters**:
- `Src` (Source): The price source, default is `close`.
- `rsilen` (RSI Length): The length for calculating RSI, default is 20.
- `linestylei`: Style for the trend lines (`Solid` or `Dashed`).
- `linewidth`: Width of the plotted lines, between 1 and 4.
- `showbroken`: Option to show broken trend lines.
- `extendlines`: Option to extend trend lines.
- `showpivot`: Show pivot points (highs and lows).
- `showema`: Show a weighted moving average (WMA) line.
- `len`: Length for calculating WMA, default is 9.
### 3. **RSI Calculation**:
- Calculates a custom RSI value using relative moving averages (`ta.rma`), and optionally uses On-Balance Volume (`ta.obv`) if `indi` is set differently.
- Plots RSI values as a green or red line depending on its position relative to the WMA.
### 4. **Pivot Points**:
- Utilizes the `ta.pivothigh` and `ta.pivotlow` functions to detect pivot highs and lows over the defined period.
- Stores up to 10 recent pivot points for highs and lows.
### 5. **Trend Line Drawing**:
- Lines are drawn based on pivot highs and lows.
- Calculates potential trend lines using linear interpolation and validates them by checking if subsequent bars break or respect the trend.
- If the trend is broken, and `showbroken` is enabled, it draws dotted lines to represent these broken trends.
### 6. **Line Management**:
- Initializes multiple lines (`l1` to `l20` and `t1` to `t20`) and uses these lines for drawing uptrend and downtrend lines.
- The maximum number of lines is set to 20 for uptrends and 20 for downtrends, due to a limit on the total number of lines that can be displayed on the chart.
### 7. **Line Style and Color**:
- Defines different colors for uptrend lines (`ulcolor = color.red`) and downtrend lines (`dlcolor = color.blue`).
- Line styles are determined by user input (`linestyle`) and use either solid or dashed patterns.
- Broken lines use a dotted style to indicate invalidated trends.
### 8. **Pivot Point Plotting**:
- Plots labels "H" and "L" for pivot highs and lows, respectively, to visually indicate turning points on the chart.
### 9. **Utility Functions**:
- Uses helper functions to get the values and positions of the last 10 pivot points, such as `getloval`, `getlopos`, `gethival`, and `gethipos`.
- The script uses custom logic for line placement based on whether the pivots are lower lows or higher highs, with lines adjusted dynamically based on price movement.
### 10. **Plotting and Visuals**:
- The main RSI line is plotted using a color gradient based on its position relative to the WMA.
- Horizontal lines (`hline1` and `hline2`) are used for visual reference at RSI levels of 60 and 40.
- Filled regions between these horizontal lines provide visual cues for potential overbought or oversold zones.
These are the main highlights of the script, which focuses on trend detection, visualization of pivot points, and dynamic line plotting based on price action.

Pi Cycle Top & Bottom Indicator [InvestorUnknown]The Pi Cycle Top & Bottom Indicator is designed for long-term cycle analysis, particularly useful for detecting significant market tops and bottoms in assets like Bitcoin. By comparing the behavior of two moving averages, one with a shorter period (default 111) and the other with a longer period (default 350), the indicator helps investors identify potential turning points in the market.
Key Features:
Dual Moving Average System:
The indicator uses two moving averages (MA) to create a cyclic oscillator. The shorter moving average (Short Length MA) is more reactive to recent price changes, while the longer moving average (Long Length MA) smooths out long-term trends. Users can select between:
Simple Moving Average (SMA): A straightforward average of closing prices.
Exponential Moving Average (EMA): Places more weight on recent prices, making it more responsive to market changes.
Oscillator Mode Options:
The Pi Cycle Indicator offers two modes of oscillation to better suit different analysis styles:
RAW Mode: This mode calculates the raw ratio of the Short MA to the Long MA, offering a simple comparison of the two averages.
LOG(X) Mode: In this mode, the oscillator takes the natural logarithm of the Short MA to Long MA ratio. This transformation compresses extreme values and highlights relative changes more effectively, making it particularly useful for spotting shifts in long-term trends.
Cyclical Analysis:
The core of the Pi Cycle Indicator is its ability to visualize the relationship between the two moving averages. The ratio of the Short MA to the Long MA is plotted as an oscillator. When the oscillator crosses above or below a baseline (which is 1 for RAW mode and 0 for LOG(X) mode), it signals potential market turning points.
Visual Representation:
The indicator provides a clear visual display of market conditions:
Orange Line: Represents the Pi Cycle Oscillator, which shows the relationship between the short and long moving averages.
Gray Baseline: A reference line that dynamically adjusts based on the oscillator mode. Crosses above or below this line help indicate possible trend reversals.
Shaded Areas: Color-filled areas between the oscillator and the baseline, which are shaded green when the market is bullish (oscillator above baseline) and red when bearish (oscillator below baseline). This provides a visual cue to assist in identifying potential market tops and bottoms.
Use Cases:
The Pi Cycle Top & Bottom Indicator is primarily used in long-term market analysis, such as Bitcoin cycles, to identify significant tops and bottoms. These moments often coincide with large cyclical shifts, making it valuable for those aiming to enter or exit positions at key moments in the market cycle.
By analyzing the interaction between short-term and long-term trends, investors can gain insight into broader market dynamics and make more informed decisions regarding entry and exit points. The ability to switch between moving average types (SMA/EMA) and oscillator modes (RAW/LOG) adds flexibility for adapting to different market environments.

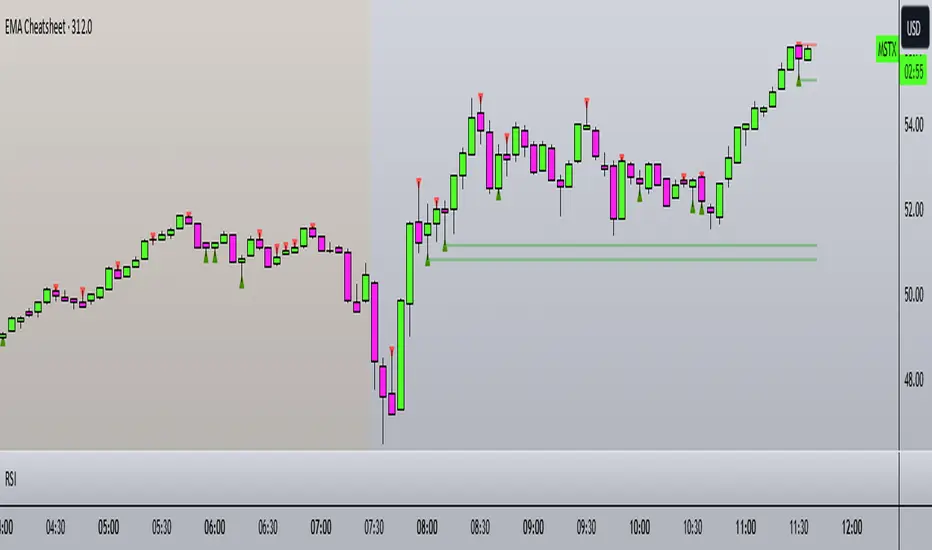
EMA CheatsheetEMA Clouds Indicator: A Comprehensive Guide for Traders
The Exponential Moving Average (EMA) Clouds indicator is a dynamic tool designed to provide traders with visual cues about the current trend and potential shifts in market momentum. The EMA is a type of moving average that gives more weight to recent price data, making it highly responsive to price changes compared to a Simple Moving Average (SMA). When used in the form of clouds, EMAs are layered on top of each other to form a visual representation of bullish and bearish trends.
Understanding EMA Clouds
EMA Clouds consist of two or more EMAs, typically a short-term EMA (e.g., 9-period) and a longer-term EMA (e.g., 21-period). When these two EMAs are plotted together, they create a "cloud" between them. The interaction between these EMAs gives traders critical insights into the market's trend:
Bullish Clouds: When the shorter-term EMA crosses above the longer-term EMA, the market is considered to be in a bullish trend. This creates a green (or lighter colored) cloud between the EMAs, signaling upward momentum. Bullish clouds suggest that buyers are in control, and the price is likely to continue higher.
Bearish Clouds: Conversely, when the shorter-term EMA crosses below the longer-term EMA, the market is considered to be in a bearish trend. This forms a red (or darker colored) cloud between the EMAs, indicating downward momentum. Bearish clouds imply that sellers are dominating the market, and the price is likely to decline.
Key Components of the EMA Clouds Indicator:
Short-Term EMA: This is the fast-moving average (e.g., 9-period EMA) and reacts quickly to recent price changes. It’s used to detect short-term shifts in momentum.
Long-Term EMA: This is the slower-moving average (e.g., 21-period EMA), which smooths out price data over a longer period and identifies the general trend direction.
Cloud: The area between the short-term and long-term EMAs. When this cloud is green (bullish), it indicates that the short-term trend is stronger than the long-term trend. When the cloud turns red (bearish), it suggests that the short-term trend is weaker than the long-term trend.
Cloud Thickness: The thickness of the cloud provides additional information about the strength of the trend. A thicker cloud suggests strong price divergence between short and long-term trends, which could indicate a robust trend. A thinner cloud, on the other hand, may signal trend weakness or consolidation.
Precision Cloud by Dr ABIRAM SIVPRASAD
Precision Cloud by Dr. Abhiram Sivprasad"
The " Precision Cloud" script, created by Dr. Abhiram Sivprasad, is a multi-purpose technical analysis tool designed for Forex, Bitcoin, Commodities, Stocks, and Options trading. It focuses on identifying key levels of support and resistance, combined with moving averages (EMAs) and central pivot ranges (CPR), to help traders make informed trading decisions. The script also provides a visual "light system" to highlight potential long or short positions, aiding traders in entering trades with a clear strategy.
Key Features of the Script:
Central Pivot Range (CPR):
The CPR is calculated as the average of the high, low, and close of the price, while the top and bottom pivots are derived from it. These act as dynamic support and resistance zones.
The script can plot daily CPR, support, and resistance levels (S1/R1, S2/R2, S3/R3) as well as optional weekly and monthly pivot points.
The CPR helps identify whether the price is in a bullish, bearish, or neutral zone.
Support and Resistance Levels:
Three daily support (S1, S2, S3) and resistance (R1, R2, R3) levels are plotted based on the CPR.
These levels act as potential reversal or breakout points, allowing traders to make decisions around key price points.
EMA (Exponential Moving Averages):
The script includes two customizable EMAs (default periods of 9 and 21). You can choose the source for these EMAs (open, high, low, or close).
The crossovers between EMA1 and EMA2 help identify potential trend reversals or momentum shifts.
Lagging Span:
The Lagging Span is plotted with a customizable displacement (default 26), which helps identify overall trend direction by comparing past price with the current price.
Light System:
A color-coded table provides a visual representation of market conditions:
Green indicates bullish signals (e.g., price above CPR, EMAs aligning positively).
Red indicates bearish signals (e.g., price below CPR, EMAs aligning negatively).
Yellow indicates neutral conditions, where there is no clear trend direction.
The system includes lights for CPR, EMA, Long Position, and Short Position, helping traders quickly assess whether the market is in a buying or selling opportunity.
Trading Strategies Using the Script
1. Forex Trading:
Trend-Following with EMAs: Use the EMA crossovers to capture trending markets in Forex. A green light for the EMA combined with a price above the daily or weekly pivot levels suggests a buying opportunity. Conversely, if the EMA light turns red and price falls below the CPR levels, look for shorting opportunities.
Reversal Strategy: Watch for price action near the daily S1/R1 levels. If price holds above S1 and the EMA is green, this could signal a reversal from support. The same applies to resistance levels.
2. Bitcoin Trading:
Momentum Breakouts: Bitcoin is known for its sharp moves. The script helps to identify breakouts from the CPR range. If the price breaks above the TC (Top Central Pivot) with bullish EMA alignment (green light), it could signal a strong uptrend.
Lagging Span Confirmation: Use the Lagging Span to confirm the trend direction. For Bitcoin's volatility, when the lagging span shows consistent alignment with the price and CPR, it often indicates continuation of the trend.
3. Commodities Trading:
Support/Resistance Bounce: Commodities such as gold and oil often react well to pivot levels. Look for price bouncing off S1 or R1 for potential entry points. A green CPR light along with price above the pivot range supports a bullish bias.
EMA Pullback Strategy: If price moves in a strong trend and pulls back to one of the EMAs, a green EMA light suggests re-entry on a pullback. If the EMA light is red and price breaks below the BC (Bottom Central Pivot), short positions could be considered.
4. Stocks Trading:
Long Position Strategy: For stocks, use the combination of the long position light turning green (price above TC and EMA alignment) as a signal to buy. This could be especially useful for riding bullish trends in growth stocks or during earnings seasons when volatility is high.
Short Position Strategy: If the short position light turns green, indicating price below BC and EMAs turning bearish, this could be an ideal setup for shorting overvalued stocks or during market corrections.
5. Options Trading:
Directional Bias for Options: The light system is particularly helpful for options traders. A green long position light provides a clear signal to buy call options, while a green short position light supports buying puts.
Pivot Breakout Strategy: Buy options (calls or puts) when the price breaks above resistance or below support, with confirmation from the CPR and EMA lights. This helps capture the sharp moves required for profitable options trades.
Conclusion
The S&R Precision Cloud script is a versatile tool for traders across markets, including Forex, Bitcoin, Commodities, Stocks, and Options. It combines critical technical elements like pivot ranges, support and resistance levels, EMAs, and the Lagging Span to provide a clear picture of market conditions. The intuitive light system helps traders quickly assess whether to take a long or short position, making it an excellent tool for both new and experienced traders.
The S&R Precision Cloud by Dr. Abhiram Sivprasad script is a technical analysis tool designed to assist traders in making informed decisions. However, it should not be interpreted as financial or investment advice. The signals generated by the script are based on historical price data and technical indicators, which are inherently subject to market fluctuations and do not guarantee future performance.
Trading in Forex, Bitcoin, Commodities, Stocks, and Options carries a high level of risk and may not be suitable for all investors. You should be aware of the risks involved and be willing to accept them before engaging in such activities. Always conduct your own research and consult with a licensed financial advisor or professional before making any trading decisions.
The creators of this script are not responsible for any financial losses that may occur from its use. Past performance is not indicative of future results, and the use of this script is at your own risk.

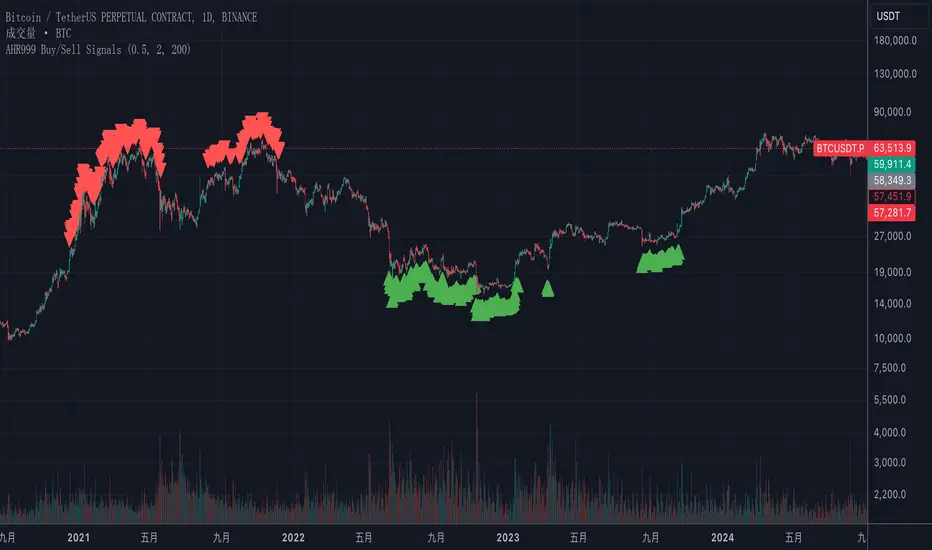
AHR999 Bitcoin Buy/Sell Signals Indicator - Accurate Trading OppThis Pine Script indicator combines the AHR999 metric with Bitcoin's historical price trends to provide clear buy and sell signals, assisting you in making informed trading decisions at crucial moments. It calculates the AHR999 index based on Bitcoin's 200-day Geometric Moving Average (GMA) and the estimated price, offering customizable buy and sell thresholds for precise entry and exit points. Ideal for traders looking to capture long-term investment trends, this indicator helps you effectively identify Bitcoin market opportunities.