Multi Timeframe 50EMA CloudDescription:
The Multi Timeframe 50EMA Cloud is a powerful tool for multi-timeframe trend analysis. This indicator allows you to display the 50-period Exponential Moving Average (EMA) and its volatility "cloud" from several higher timeframes directly on any chart.
Features:
* See the 50EMA cloud from multiple timeframes at once: 15m, 1H, 4H, and 1D.
* Flexible controls: Easily turn each timeframe’s cloud on or off in the settings - overlay as many as you want.
* Distinct colors: Each timeframe has customizable colors for its EMA line, cloud and borders to keep your chart clear and organized.
* Universal perspective: Great for identifying higher timeframe support and resistance, confluence zones and market structure without switching charts.
How it works:
Each enabled EMA cloud is plotted with a band above and below the EMA line, showing ± one-quarter standard deviation (stdev) of price. This "cloud" highlights short-term volatility around the higher timeframe EMA, making it easier to spot dynamic support, resistance and trend strength.
Best for:
* Day traders and swing traders who want to track key EMAs from multiple timeframes on a single chart
* Identifying multi-timeframe confluence, trend direction and volatility zones
Tip:
Try overlaying the 15m, 1H, and 4H EMA clouds on lower timeframe charts (e.g., 1m, 5m, or 15m) for deeper market insight and better trade timing.
⚠️ Important Notice
This tool is provided for educational and informational purposes only . It is designed to assist in technical analysis learning and visual chart study.
It is not intended to be used as financial advice, a buy/sell signal, or any form of investment recommendation .
By using this indicator, you acknowledge that all actions you take are your own and you assume full responsibility for any decisions made.
Moving Averages

50/100 EMA Crossover with Candle Confirmation📘 **50/100 EMA Crossover with Candle Confirmation – Strategy Description**
The **50/100 EMA Crossover with Candle Confirmation** is a trend-following strategy designed to filter high-probability entries by combining exponential moving average (EMA) crossovers with strong price action confirmation. This strategy aims to reduce false signals commonly associated with EMA-only systems by requiring a **candle close confirmation in the direction of the trend**, making it more reliable for intraday or swing trading across Forex, crypto, and stock markets.
---
### 🔍 **Core Logic**
* The strategy is based on the interaction of the **50 EMA** (fast-moving average) and the **100 EMA** (slow-moving average).
* **Trend direction** is determined by the crossover:
* **Bullish Trend**: When the 50 EMA crosses **above** the 100 EMA.
* **Bearish Trend**: When the 50 EMA crosses **below** the 100 EMA.
* To **filter out false breakouts**, a **candle confirmation** is used:
* For a **Buy signal**: After a bullish crossover, wait for a strong bullish candle (e.g., full-body green candle) to **close above both EMAs**.
* For a **Sell signal**: After a bearish crossover, wait for a strong bearish candle to **close below both EMAs**.
---
### ✅ **Entry Conditions**
**Buy Entry:**
* 50 EMA crosses above 100 EMA.
* Latest candle closes **above both EMAs**.
* Candle must be bullish (green/full body preferred).
**Sell Entry:**
* 50 EMA crosses below 100 EMA.
* Latest candle closes **below both EMAs**.
* Candle must be bearish (red/full body preferred).
---
### 🛑 **Exit or Take-Profit Options**
* **Fixed TP/SL**: 1:2 or 1:3 risk-reward.
* **Trailing Stop**: Based on recent swing highs/lows or ATR.
* **EMA Exit**: Exit trade when the candle closes on the opposite side of 50 EMA.
---
### ⚙️ **Best Settings**
* **Timeframes**: 5M, 15M, 1H, 4H (works well on most).
* **Markets**: Forex, Crypto (e.g., BTC/ETH), Indices (e.g., NASDAQ, NIFTY50).
* **Recommended filters**:
* Use with RSI divergence or volume confirmation.
* Avoid using during high-impact news (especially on lower timeframes).
---
### 🧠 **Why This Works**
The 50/100 EMA crossover provides a **medium-term trend signal**, reducing noise seen in fast EMAs (like 9 or 21). The candle confirmation adds a **momentum filter**, ensuring price supports the directional bias. This makes it suitable for traders who want a balance of trend and entry precision without overcomplicating with too many indicators.
---
### 📈 **Advantages**
* Simple yet effective for identifying trends.
* Filters out fakeouts using candle confirmation.
* Easy to automate in Pine Script or other trading bots.
* Can be combined with support/resistance or SMC zones for better confluence.
---
### ⚠️ **Limitations**
* May lag slightly in ranging markets.
* Late entries possible due to confirmation candle.
* Works best with additional volume or volatility filter.

7 EMA CloudThe "7 EMA Cloud" script was likely flagged because it reuses the core concept of EMA clouds (shading areas between multiple EMAs to visualize trends, support/resistance, and momentum) without crediting the original inventor, Ripster (author ripster47 on TradingView). This concept is prominently associated with Ripster's "EMA Clouds" indicator, which popularized filling spaces between EMA pairs for trading signals. TradingView's house rules require crediting authors when reusing open-source ideas or code, even if not a direct copy-paste, and mandate significant improvements where the original forms a small proportion of the script. Your version adds features like multiple color modes (Classic rainbow, Monochrome, Heatmap), customizable signal sizes, and crossover alerts between the first and last EMA, which are enhancements, but the foundational EMA ribbon/cloud idea needs explicit attribution in the description and ideally code comments to comply.
Additionally, the description might be seen as not fully self-contained (e.g., it uses promotional language like "Advanced" and "Adaptive Trend & Signal Suite" without deeply explaining calculations or use cases), potentially violating rules against relying on code or external references for clarity.
To fix this, republish a new version with proper credits, ensure the description is detailed and standalone, and emphasize your improvements (e.g., the 7 Fibonacci-based EMAs, color modes, and signals). Do not reuse the flagged script—create a fresh one. Here's a compliant description you can use:
7 EMA Cloud Indicator
Overview
The 7 EMA Cloud overlays seven exponential moving averages (EMAs) with Fibonacci-inspired periods and fills the spaces between them with customizable "clouds" to visually represent trend strength, direction, and convergence/divergence. It includes crossover signals between the shortest and longest EMAs for potential entry/exit points, with adjustable visual modes for different trading styles. This helps traders identify bullish/bearish momentum, support/resistance zones, and overextensions in trending or ranging markets.
This script builds on the EMA cloud concept popularized by Ripster (ripster47) in their "EMA Clouds" indicatortradingview.com, where areas between EMA pairs are shaded for trend analysis. Improvements include a fixed set of 7 Fibonacci EMAs, multiple color schemes (Classic rainbow, Monochrome grayscale, Heatmap for intensity), user-selectable signal sizes, and transparency controls. Released under the Mozilla Public License 2.0.
Key Features
7 EMAs with Clouds: EMAs at periods 8, 13, 21, 34, 55, 89, and 144; clouds filled between consecutive pairs to show alignment (tight clouds for consolidation, wide for trends).
Color Modes:
Classic: Rainbow gradients (blue to purple) for vibrant distinction.
Monochrome: Grayscale shades for minimalistic charts.
Heatmap: Red-to-blue spectrum to highlight "hot" (volatile) vs. "cool" (stable) areas.
Crossover Signals: Triangle markers (up for bullish, down for bearish) when the shortest EMA crosses the longest; sizes from Tiny to Huge.
Display Options: Toggle EMA lines on/off, adjust cloud transparency (0-100%), and enable alerts for crossovers.
Alerts: Notifications for "Bullish EMA Crossover" (EMA1 > EMA7) and "Bearish EMA Crossover" (EMA1 < EMA7).
How It Works
EMA Calculations: Each EMA is computed using ta.ema(close, period), with periods based on Fibonacci sequences for natural market rhythm alignment.
Clouds: Filled via fill() between plot pairs, with colors derived from the selected mode and transparency applied.
Signals: Detected with ta.crossover(ema1, ema7) and ta.crossunder(ema1, ema7), plotted as shapes with mode-specific colors (e.g., green/lime for bull, red for bear).
Customization: Inputs grouped into EMA Settings (periods), Display Settings (visibility, colors, transparency), and Signal Settings (size).
Customization Options
EMA Periods: Individually adjustable (defaults: 8, 13, 21, 34, 55, 89, 144).
Show EMAs: Toggle to hide lines and focus on clouds.
Cloud Transparency: 0% for solid fills, 100% for invisible (default 80%).
Color Mode: Switch between Classic, Monochrome, or Heatmap.
Signal Size: Tiny, Small, Normal, Large, or Huge for crossover markers.
Ideal Use Case
Suited for swing or trend-following on any timeframe (e.g., 15m-1h for intraday, daily for swings) and assets (stocks, forex, crypto, futures). Enter long on bullish crossovers above aligned clouds; exit on bearish signals or cloud widenings. Use Monochrome for clean charts or Heatmap for volatility emphasis. Combine with volume or RSI for confirmation.
Why It's Valuable
By expanding Ripster's EMA cloud idea with multi-mode visuals and integrated signals, this indicator provides a versatile, at-a-glance tool for trend assessment—reducing noise while highlighting key shifts. It's more adaptive than basic MA ribbons, with Fibonacci periods adding a layer of harmonic analysis.
Note: Test on historical data or demo accounts. Not financial advice—incorporate risk management. Optimized for Pine Script v5; some features may vary on non-overlay charts.

Auto-Calculated Pivot Line/Zone (Based on Time Range)Automatically Calculated Pivot Line/Zone
Harness the power of precision with this Custom Time Range Average Line indicator—designed to pinpoint key equilibrium and pivot levels within consolidation zones after a breakout. Select any start and end time to capture the critical price action shaping the market structure between swings, and calculate the true average price using your choice of open, close, high, low, or midpoint.
Once the defined period concludes, the indicator freezes the average and extends it forward as a clear horizontal ray, acting as a powerful reference for fair value and market balance. This dynamic line shines brightest within consolidation phases, helping traders identify pivot points and equilibrium zones that often serve as magnets for price after a breakout.
Customize the line width to suit your style—use a thinner line width input for a precise single average line, or increase the width to visually represent a broader range or zone. Fully adjustable line color and thickness options ensure this tool integrates seamlessly into any chart setup.
Elevate your trading edge by visualizing the hidden balance points between market swings—turning consolidation chaos into clear, strategic opportunities!

MACD + 1m EMA Zone FilterFeature Description
Run on Any Chart Works on any timeframe — 5m, 15m, 1h, etc.
MACD Crosses Detected on the current chart's timeframe
EMA Logic All EMA20/50/100/200 come from 1-minute timeframe
Buy Signal MACD crossover + all EMAs (1m) above EMA200
Sell Signal MACD crossunder + all EMAs (1m) below EMA200
Chart Arrows BUY/SELL arrows plotted at each signal
Alerts Configurable alerts for Buy/Sell conditions

STMD Indicator PROThe STMD Indicator PRO is designed for traders looking to capture strong trends using moving average alignment and the powerful Elephant Bar pattern, popularized by Oliver Velez.
📋 How it works?
✔ Simple Moving Averages:
SMA 8 (Black)
SMA 13 (Purple)
SMA 20 (Blue)
SMA 200 (Red, optional filter)
✔ Signal conditions:
All SMAs aligned and trending in the same direction
Price near the short-term SMAs
A strong candle (Elephant Bar) with a big body and small opposite wick
Signal only on the first or second consecutive candle of the same color
✅ Features
✔ Background color showing trend bias
✔ Alerts ready: STMD Buy and STMD Sell
✔ Optional SMA 200 filter for higher timeframe confirmation
📌 Disclaimer: This script is for educational purposes only. Not financial advice.

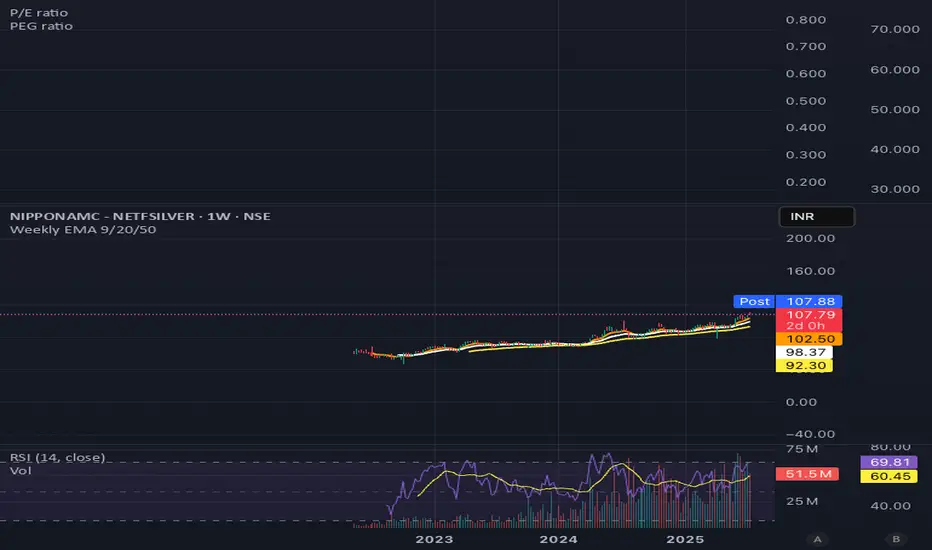
Weekly EMA 9/20/50Weekly EMA for 9, 20 and 50 weeks for any security.
This will show the trends that are otherwise not visible on the daily chart.
MACD & EMA Cross SignalsMACD and EMA Crossover Signals
-> This tool provides buy and sell signals directly on your chart. It helps you spot action points early.
Symbol Indicators:
"Triangle Up" (Green) shows a positive MACD crossover.
"Triangle Down" (Red) indicates a negative MACD crossover.
"Label Up" (Green) marks a positive EMA crossover.
"Label Down" (Red) signals a negative EMA crossover.
Golden Cross Alerts for MACD and EMAs
-> A "Buy" signal appears when both MACD and EMAs cross positive at the same time.
-> A "Sell" signal shows when both indicators cross negative together.
Option to set custom alerts
-> Golden Buy Signal: Both MACD and EMA cross positive.
-> Golden Sell Signal: Both cross negative.
-> Any Buy Signal: Either MACD or EMA crosses up.
-> Any Sell Signal: Either crosses down.
Note: You can change the values for EMAs, Symbol, and Color in the Settings to fit your needs.

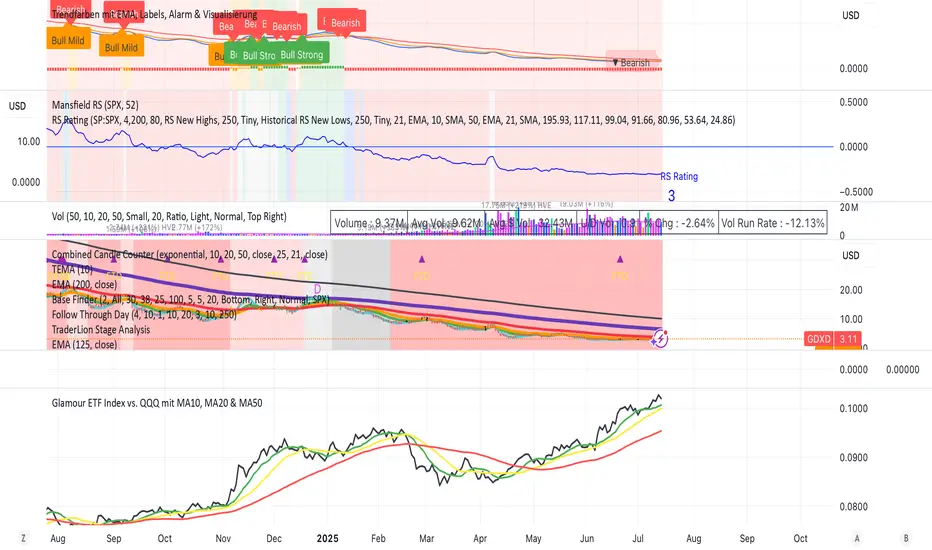
Glamour ETF Index vs. QQQ mit MA10, MA20 & MA50Stan Weinstein uses the term "Glamour Index" as a sentiment indicator to assess how speculative or overheated the stock market is. The Glamour Index measures the relationship between so-called "glamour stocks" (trendy stocks, hyped stocks with high media attention and sometimes extreme price increases) and solid, more conservative stocks. Weinstein uses this index to: 1) Analyze market sentiment – particularly whether the market is in a speculative euphoria phase.
2) Identify warning signs of a potential top formation or an impending downturn.
My basket compares performance against the QQQ (alternatively, SPY or any other benchmark is also possible).
My basket consists of the ETFs in the ARK universe, as well as other growth ETFs such as IPO, FFTY, and QQQJ.
TeeLek-HedgingLineIf we are DCA some assets and it happens to be in a downtrend, sitting and waiting is the best way, but it is not easy to do. There are other ways that allow us to buy DCA and keep collecting more. While the market is falling, don't be depressed. The more you buy, the more it drops. Should you continue buying? Plus, if it goes back to an uptrend, you will also get extra profit. Let's go check it out.
ถ้าเรา DCA ทรัพย์สินอะไรซักอย่างนึงอยู่ แล้วมันดันเป็นขาลงพอดี จะนั่งรอเฉยๆ เป็นวิธีที่ดีที่สุด แต่ไม่ได้ทำกันได้ง่ายๆ นะ ยังมีวิธีอื่นอีก ที่ให้เราสามารถ ซื้อ DCA เก็บของเพิ่มได้เรื่อยๆ ระหว่างที่ตลาดร่วง ไม่จิตตก ยิ่งซื้อ ยิ่งลง จะซื้อต่อดีไหม? แถมถ้า กลับมาเป็นขาขึ้น ยังมีกำไรแถมให้ด้วยนะ ไปหาดูกัน

Multi-Timeframe EMAs & WMAsMulti-Timeframe EMAs & WMAs (MTF EMAWMA)
The Multi-Timeframe EMAs & WMAs (MTF EMAWMA) indicator is a comprehensive tool designed to provide a multi-dimensional view of market trends by plotting various Exponential Moving Averages (EMAs) and Weighted Moving Averages (WMAs) from different timeframes onto your current chart. This allows traders to quickly assess confluent support and resistance levels, identify trend strength, and gain a broader market perspective without switching timeframes.
Key Features:
Multiple EMAs and WMAs:
This indicator includes:
- EMA 200: Plotted from H1 and M15 timeframes.
- EMA 100: Plotted from H1, M30, and M15 timeframes.
- EMA 50: Plotted from H4, H1, M30, and M15 timeframes.
- WMA 720: Plotted from H4, H1, M30, M15, and M1 timeframes.
Multi-Timeframe Analysis: By displaying moving averages from various timeframes, the indicator helps in understanding the interplay of different trends and their potential impact on price action.
Visual Distinction : Each moving average type and its timeframe representation are color-coded and styled (solid vs. dashed lines) for easy identification and clarity on the chart.
EMA 200: Dark Red
EMA 100: Cyan/Teal
EMA 50: SaddleBrown
WMA 720: Orange
Recommended Usage:
This indicator is specifically tailored for XAU/USD (Gold). It is intended to be used as a confluence tool to complement your existing trading strategies and indicators. It is not designed to be used solely as an entry or exit signal. Instead, leverage the information provided by these multi-timeframe moving averages to:
- Identify major trend directions: Observe the alignment and slope of longer-term moving averages.
- Spot potential support and resistance zones: Price often reacts to these key moving average levels from higher timeframes.
- Confirm trade bias: Use the higher timeframe moving averages to confirm the direction of your trades on lower timeframes.
- Enhance risk management: Understand where strong levels might exist to place stop-losses or take-profits.
Always combine this indicator with other forms of analysis, such as price action, chart patterns, volume analysis, or other technical indicators, to make informed trading decisions.
Remark: The script and description were created by AI.

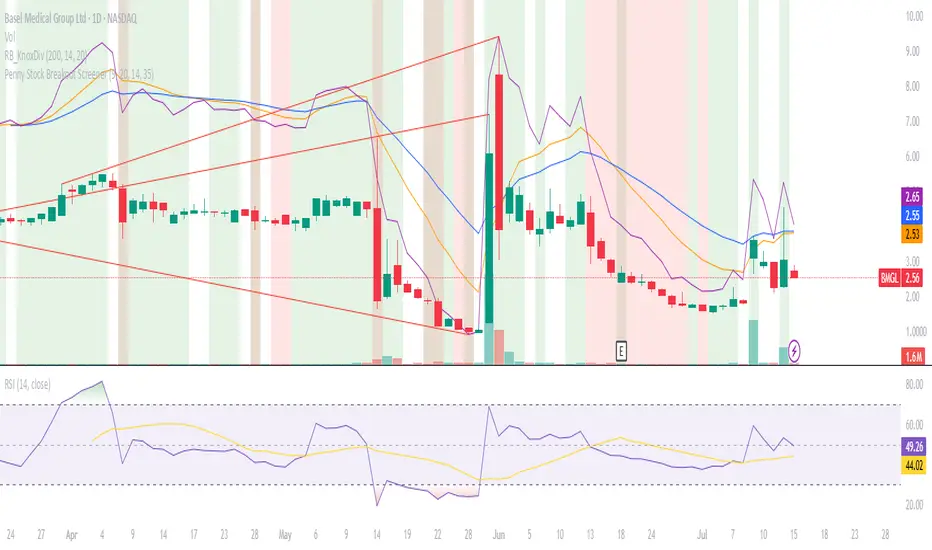
Penny Stock Breakout ScreenerLive Conditions Your Script Is Monitoring:
🔵 Bullish (Green Background = Entry Opportunity):
Breakout Pivot High
✅ Trigger: Price is breaking above the highest close of the last 20 candles (shows momentum).
🔔 Alert: "Price breaking above recent pivot high!"
Price Above VWAP
✅ Trigger: Price is currently above the VWAP (shows buyers are in control).
🔔 Alert: "Price is above VWAP - bullish control!"
EMA 9 > EMA 20 Crossover
✅ Trigger: 9-period EMA crosses above 20 EMA (trend shifting bullish).
🔔 Alert: "EMA9 has crossed above EMA20"
RSI Recovery
✅ Trigger: RSI (14) crosses above 35, indicating a bounce from oversold.
🔔 Alert: "RSI is rising from oversold - bounce incoming"
Volume Spike
✅ Trigger: Current volume is 1.5x greater than 20-day average (buying interest).
🔔 Alert: "Volume > 1.5x 20-day avg - possible breakout"
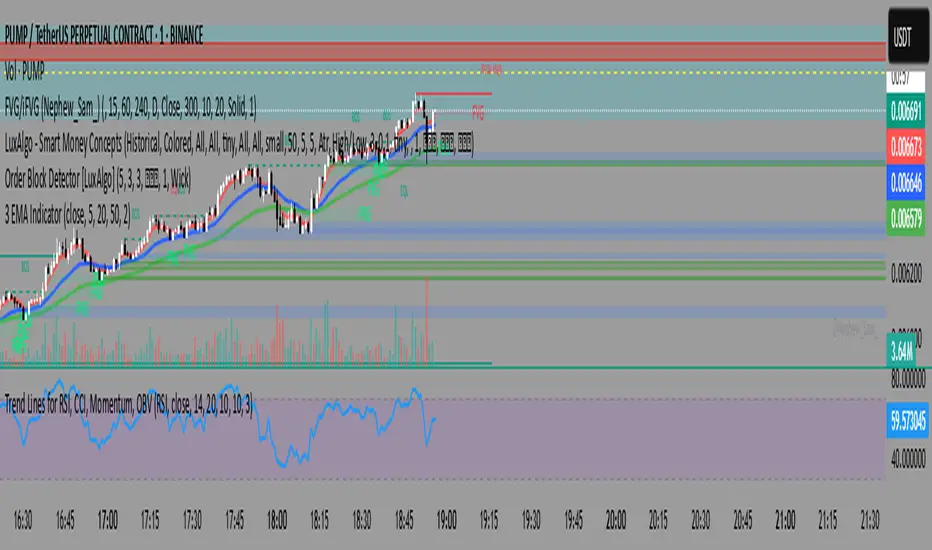
3 EMA Indicator3 EMA Indicator Description
The 3 EMA Indicator is a customizable TradingView indicator designed to plot three Exponential Moving Averages (EMAs) on a price chart. It helps traders analyze trends, identify potential trading signals, and monitor price momentum through the interaction of three EMAs with user-defined periods.
Features
Three EMAs: Displays three EMAs with default periods of 9, 21, and 50, which can be adjusted via input settings.
Customizable Parameters:
Source: Choose the price data (e.g., close, open, hlc3) for EMA calculations (default: close).
EMA Periods: Set custom lengths for each EMA (minimum 1).
Colors: Assign unique colors to each EMA for clear visualization (default: red, blue, green).
Line Width: Adjust the thickness of EMA lines (default: 2).
Dynamic Label: A label on the last bar displays the configured EMA periods (e.g., "EMA1: 9, EMA2: 21, EMA3: 50") for easy reference.
Overlay: Plots directly on the price chart, making it intuitive to compare EMAs with price action.
Usage
Trend Analysis: Use the relative positions of the EMAs to identify bullish (e.g., shorter EMA above longer EMA) or bearish trends.
Crossover Signals: Monitor EMA crossovers (e.g., 9-period EMA crossing above the 21-period EMA) for potential buy or sell signals.
Customization: Adjust periods, colors, and line width through the indicator’s settings to match your trading strategy.
How to Apply
Open TradingView’s Pine Editor.
Copy and paste the indicator’s Pine Script code.
Add the indicator to your chart.
Customize settings (periods, source, colors, line width) via the indicator’s input panel.
This indicator is ideal for traders seeking a simple yet flexible tool to track price trends and momentum using multiple EMAs.
Multi-Timeframe Trend Analysis [Aaron Diaz]🧠 Indicator Review: Multi-Timeframe Trend Analysis
📌 What Does It Do?
The "Multi-Timeframe Trend Analysis" indicator by Aaron Diaz performs a trend assessment across multiple timeframes using Exponential Moving Averages (EMAs) as internal logic. Instead of plotting EMAs on the chart, this version only displays a clean dashboard that shows whether each EMA is trending up or down, keeping your chart clutter-free.
🧾 Based on the original indicator by BigBeluga, this version was modified by Aaron Diaz to remove the EMA plots and focus solely on actionable trend information via a table.
🔍 How It Works
It calculates 5 different EMAs (default: 20, 30, 40, 50, 60 periods).
For each EMA, it checks if it’s trending up (EMA > EMA 2 candles ago) or down.
These signals are then evaluated across 5 customizable timeframes (e.g., 1h, 2h, 3h, etc.).
A dashboard/table appears on the top-right corner of your screen, showing:
🢁 = Uptrend for that EMA and timeframe.
🢃 = Downtrend.
It uses color codes (green = bullish, purple = bearish) to make trend reading fast and intuitive.
🧱 Technical Foundations
Exponential Moving Averages (EMAs):
EMAs give more weight to recent prices, making them highly responsive to current trends.
Widely used to detect momentum and reversals.
Multi-Timeframe Analysis (MTF):
Helps confirm trend strength by analyzing multiple timeframes.
Reduces false signals and noise found in a single timeframe.
📈 Suggested Strategy: "MTF Trend Confluence"
🎯 Goal:
Only trade when multiple timeframes confirm the same directional bias.
✅ Long Entry Rules:
At least 3 out of 5 timeframes must show 🢁 on at least 4 of the 5 EMAs.
Confirm entry with:
A bullish candlestick pattern.
A breakout above recent resistance.
Optional filter: RSI or MACD not in overbought zone.
🔻 Short Entry Rules:
At least 3 timeframes must show 🢃 on at least 4 EMAs.
Confirm with:
A bearish candle or breakdown below support.
Optional filter: RSI or MACD not in oversold zone.
🛑 Exit Rules:
Take Profit at key support/resistance levels or at a 2:1 risk-reward ratio.
Stop Loss below/above the last swing or fixed % (e.g., 1.5–2%).
Exit early if the dashboard shows a shift in trend across key timeframes.
🧪 Example Use Case
You're trading on a 15-minute chart:
The dashboard shows 🢁 across 1h, 2h, and 3h timeframes for EMA20, EMA30, and EMA40.
Price breaks a local resistance level.
You enter long and target the next liquidity zone, placing your stop-loss below the most recent swing low.
⚠️ Important Notes
This is not a signal generator—it’s a trend confirmation tool.
Best used for swing or intraday trend trading.
Avoid using it in ranging or sideways markets.

Dashboard EMA Unifié [touli]DISCLAIMER
This indicator is provided for educational and informational purposes only. It does not constitute investment advice, a recommendation to buy or sell, or a solicitation for any transaction. Past performance is not indicative of future results. Trading involves significant risk, including the potential loss of capital. The user assumes full responsibility for their own trading decisions and risk management. The author of this script cannot be held liable for any losses or damages resulting from its use.
Indicator Title: Unified EMA Dashboard
Overview
This indicator is a comprehensive technical analysis tool that combines the display of Exponential Moving Averages (EMAs) on the chart with a multi-timeframe dashboard. It is designed to provide traders with a quick and clear overview of the trend across multiple timeframes, while also providing visual cues directly on the current chart.
Key Features
Multi-Timeframe Dashboard: Displays a clean and concise table showing the price's position relative to four different EMAs (9, 21, 50, 200) across 6 timeframes (from 1 minute to 1 day).
A blue arrow ▲ indicates that the closing price is above the EMA (potential bullish trend).
A red arrow ▼ indicates that the closing price is below the EMA (potential bearish trend).
Display of 4 EMAs on the Chart:
EMA 9 & 21: Plotted on the current timeframe, they help identify the very short-term trend.
EMA 50 (from the 5m TF) & EMA 200 (from the 15m TF): Plotted on the current chart but calculated on higher timeframes. They offer a perspective on the stronger, underlying trends.
Full Customization: The indicator's settings allow the user to:
Modify the periods of the four EMAs.
Choose the dashboard's position on the screen.
Change the dashboard's theme (Dark or Light).
Enable or disable the display of the EMAs on the chart.
Optimized Code: The script is designed for performance, drawing and calculating the dashboard only on the last available price bar, thus avoiding chart lag.
How to Use
1. Installation
On TradingView, open the chart of your chosen asset.
At the bottom of the screen, click on the "Pine Editor" tab.
Copy the entire corrected script and paste it into the editor, replacing any existing content.
Click the "Add to Chart" button. The indicator will then appear on your chart.
2. Configuration
Click the gear icon (⚙️) next to the indicator's name to access its settings.
General Settings:
Dashboard Theme: Choose "Dark" or "Light" for better readability depending on your chart's color scheme.
Dashboard Position: Select where you want the dashboard to appear (e.g., "Bottom Right," "Top Left," etc.).
EMA Settings:
Modify the periods (9, 21, 50, 200) if you prefer to use other values for your analysis.
Chart Display Settings:
Check or uncheck the boxes to show or hide the EMA lines on your main chart. For instance, you can disable the lines and only use the dashboard.
3. Interpretation (For Informational Purposes)
The Dashboard:
Confluence Analysis: The dashboard's main strength is identifying trend "confluence." A column that is entirely blue (▲) or red (▼) suggests a strong, aligned trend across multiple time scales.
Identifying Reversal Points: If the shorter timeframes (1m, 5m) start to change color while the longer ones (4h, 1D) remain stable, this may indicate a pullback or the beginning of a trend change.
The EMAs on the Chart:
Dynamic Support and Resistance: The EMA lines can act as areas of support in an uptrend and resistance in a downtrend.
Underlying Trend: The price's position relative to the longer-period EMAs (50 and 200) gives an indication of the general underlying trend.
Best Practices and Limitations
Do Not Use in Isolation: This indicator is a trend confirmation tool. It is recommended to use it in conjunction with other analysis tools (volume, market structure, other indicators).
Lagging Indicator: Moving averages are trend-following indicators, which means they react to past price movements. They do not predict future movements.
Risk Management: Always set a stop-loss and take-profit for every trade. Never risk more than a small percentage of your capital on a single position.

Multi-Timeframe 200 SMAs (2m, 5m, 10m, 1H, 1D)Intraday 200 SMA Multi-Timeframe Overlay
This indicator displays the 200-period Simple Moving Averages (SMA) from the 2-minute, 5-minute, 10-minute, 1-hour, and 1-day timeframes on any chart — providing powerful multi-timeframe context for intraday trading.
Each moving average is color-coded and labeled for quick reference, helping traders identify dynamic support and resistance levels across key timeframes without needing to switch charts. Designed specifically for day traders, this tool enhances situational awareness and assists in aligning trades with broader trend direction.
Features:
2-minute 200 SMA (Yellow)
5-minute 200 SMA (Light Orange)
10-minute 200 SMA (Dark Orange)
1-hour 200 SMA (Red)
1-day 200 SMA (Purple)
Displayed on any intraday chart
Clean line styles with optional labels for timeframe reference
Perfect for scalpers and intraday swing traders who rely on higher timeframe moving averages for confluence and trade validation.

RAA Buy Sell[RanaAlgo]Overview
The RAA (RanaAlgo Adaptive Average) Buy Sell indicator is a trend-following tool that helps identify potential buy and sell signals based on price deviation from an adaptive moving average. It uses a combination of:
(Fractal Adaptive Moving Average) – Adjusts its sensitivity based on market volatility.
RAA Bands – Dynamic upper/lower bands calculated using a multiplier applied to the average deviation.
🔹 Key Features
Trend Identification
Bullish Trend →
Bearish Trend →
Signal Generation
Visual Enhancements
Colored candles (green for bullish, red for bearish).
Dynamic bands to visualize trend strength.
Alerts
Customizable buy/sell alerts for real-time notifications.
🔹 Usefulness in Trading
✅ Trend Confirmation – Helps confirm trend direction before entering trades.
✅ Reduces False Signals – Uses adaptive bands to filter out noise.
✅ Works Across Timeframes – Effective on intraday, swing, and long-term trading.
✅ Customizable – Adjustable length and multiplier for different market conditions.
🔹 Best Used For
Trend-following strategies (riding strong trends).
Breakout trading (entering when price confirms momentum).
Avoiding choppy markets (since the adaptive bands widen in volatility).

Scalp Trading Setup (EMA9/21 + VWAP + Stoch RSI)
On 1-minute, wait for candle confirmation and volume spikes to avoid false signals.
On 5-minute, this setup is most reliable for clean trend scalping (ideal entry alignment).
Use 15-minute for direction bias only, not for entry.

EMA HMA ATF Trade SignalThis indicator is designed as a discretionary trading tool to highlight high-quality trade setups across 15-minute and similar intraday timeframes. It uses a multi-layered logic framework combining trend, momentum, structure, and timing filters. It is not meant to fire frequently — its strength is in filtering out noise and emphasizing clean, aligned market moves.

EMA Slope First Flip Signal1. EMA Calculation:
It calculates 4 Exponential Moving Averages:
EMA 5 – very fast (captures short-term moves)
EMA 9 – fast
EMA 21 – medium
EMA 50 – long-term trend
2. Slope Calculation:
It finds the slope of each EMA using:
pinescript
Copy
Edit
slopeX = emaX - emaX
This checks if the EMA is rising (slope > 0) or falling (slope < 0).
3. Trend Condition:
Buy condition: All 4 EMA slopes must be positive
Sell condition: All 4 EMA slopes must be negative
4. First Signal Logic:
It only flashes a signal when the direction changes.
For example:
If EMAs were not all rising before, but now all are → BUY
If EMAs were not all falling before, but now all are → SELL
Prevents repeated signals during the same trend.
5. Safe Boolean Handling:
Uses bool(condition ) to access previous state without error
Avoids using nz() or na() on booleans (which causes errors)
📈 What You See on Chart:
✅ Green "BUY" label below candle when all EMA slopes turn positive for the first time
❌ Red "SELL" label above candle when all EMA slopes turn negative for the first time
🔄 No duplicate signals in the same direction — only on reversal

Dual Donchian Channels + Death CrossDual Donchain Channels with a 50/200 day angel/death cross indicator built in. Intended to be used on the daily time frame.

MCC Smart Reversal Signals📊 MCC Smart Reversal Signals (Stoch RSI) v1.0.9
© 2025 Jawid Iqbal Anwar — MIT License
This indicator is designed to help traders detect potential market reversal points by combining multiple confirmation tools such as:
Stochastic RSI
Classic RSI
Trend direction (EMA-based)
Candlestick reversal patterns
Re-entry logic
Dollar-Cost Averaging (DCA) strategy
Built-in alert system
🔄 What’s New in v1.0.9
✅ Time-Frame Presets: Choose from Custom, Weekly, Daily, 4H, 1H, or 15m profiles — each with optimized parameters.
🤖 Auto Mode: The script can automatically detect the chart timeframe and apply the best preset settings.
🎯 Dynamic Overbought/Oversold Levels:
On 15m and 1H, RSI and Stoch RSI use 6 (Oversold) and 94 (Overbought)
On 4H, Daily, and Weekly, it uses 30/70 for RSI and 20/80 for Stoch RSI
🧠 All original logic from v1.0.8 is retained: signal throttling, strong confirmation, and DCA logic.
🔧 How It Works
1. Watch Buy / Watch Sell Signals
These are early signals that notify you of a possible reversal forming.
🟠 Watch Buy: Triggered when the Stoch RSI enters oversold territory. Will only appear if the market isn’t trending strongly downward.
🔵 Watch Sell: Triggered when the Stoch RSI moves into overbought territory. Once fired, it will pause for a few candles unless the zone is exited.
⚠️ OB/OS zones are adjusted based on the selected preset or Auto mode.
2. Strong Reversal Signals (Higher Confidence)
These provide stronger confirmation when all of the following align:
RSI is in an extreme zone (very low or very high)
A reversal candlestick pattern appears (doji, bullish/bearish)
RSI recently changed direction
EMA trend supports the move (not against a strong trend)
When this happens, you’ll see a green (Buy) or red (Sell) label. These are typically high-probability entries.
3. Re-Entry Dots
If the price stays oversold or overbought for a while and forms a new valid candle setup, a new “Watch” dot will appear.
🔁 These help you catch continuation or delayed reversal setups.
4. DCA (Dollar-Cost Averaging) Signals
✅ DCA Buy: RSI is very low and Stoch RSI remains in the oversold zone — a good place to scale into a long position.
❌ DCA Sell: RSI and Stoch RSI are both in the overbought zone — ideal for scaling out or taking profit.
5. Signal Throttling (Smarter Alerts)
To avoid over-signal noise, the script includes throttling logic:
A signal won’t repeat unless the zone is exited and re-entered.
There’s a minimum bar gap between signals to reduce clutter.
🔔 Built-in Alerts (No Setup Needed)
The script includes alerts for all signal types:
Watch Buy / Watch Sell
Strong Buy / Strong Sell
DCA Buy / DCA Sell
Once you add the script to your chart, you can enable alerts immediately.
🕒 How to Use Timeframes
With v1.0.9, the indicator adapts to your chart:
Auto Mode: Just load the indicator — it adjusts based on your active timeframe.
Manual Presets: Choose a preset if you want specific control.
Timeframe Default OB/OS Settings
15m & 1H RSI & Stoch RSI: 6 / 94
4H+ RSI: 30 / 70, Stoch RSI: 20 / 80
🛠️ Suggested Trading Flow
Add the indicator and select a timeframe preset (or use Auto).
Wait for 🟠 Watch Buy or 🔵 Watch Sell — watch the price behavior.
If a 🟢 Strong Buy or 🔴 Strong Sell appears, consider entering with confirmation.
Use ✅ DCA Buy or ⏺️ DCA Sell to scale in/out slowly.
Use EMA trend and candlestick context to refine your decision.
💡 Final Tips
Let signals come to you — don’t force trades.
Use the OB/OS zones and alerts as part of a structured strategy.
Combine this tool with your price action knowledge for best results.

FInal Signal
This indicator for 4H timeframe by default
RSI + Moving Average of RSI from the 1-hour chart
MACD from the 1-hour chart
21 EMA from the 4-hour chart
5 EMA from the Daily chart
This multi-timeframe fusion offers strength: confirming shorter-term momentum with higher-timeframe support.
✅ Buy Conditions:
RSI is above its moving average → signals bullish momentum
MACD line > MACD signal line → confirms trend shift
RSI has upward slope (compared to 2 candles ago)
❌ Sell Conditions:
RSI falls below its moving average
MACD turns bearish (signal line overtakes)
RSI slopes downward
Price trades below daily EMA → confirms weakening trend
🔊 Volume Spike Detection
I also added a volume condition that checks:
If current volume > 2x the moving average (length = 10)
