Golden Pocket Syndicate [GPS]🔍 Golden Pocket Syndicate
The Golden Pocket Syndicate is a precision tool built for identifying high-probability reaction zones around dynamic golden pocket levels. Unlike generic fib overlays or EMA mashups, GPS uses a multi-timeframe approach to highlight key inflection zones based on institutional price behavior.
🧠 Core Logic:
• Golden Pocket Zones for Daily, Weekly, Monthly, Previous Periods & Yearly levels
• Volume-aware trend confirmation using WaveTrend + EMA alignment
• Clean Reversal Diamonds mark strong pivots with volume confluence
• Trend Strength Bubbles (white for bullish, purple for bearish) show when trend + momentum + volume align
• Visuals scale by proximity to price, minimizing noise and maximizing clarity
⚙️ How to Use:
• Use Golden Pocket zones to anticipate pullbacks, reversals, or continuation setups
• Look for Diamond signals near GP levels as potential pivot triggers
• Confirm with volume and EMA/WaveTrend alignment
• Use bubbles as secondary confirmation—not every bubble is a trade, but every major move confirms via bubble first
🆕 What Makes It Unique:
GPS isn’t a mashup of standard scripts—it filters only the most relevant price zones and prints actionable signals sparingly. It avoids overfitting by weighting volume trends and clean trend structure, giving it utility in scalping, swing, and intraday positioning.
🚫 Not Included:
• No repainting
• No built-in TradingView signals
• No automated alerts for every crossover—GPS only highlights high-probability moves.
Pivot points and levels

Rolling VWAP LevelsRolling VWAP Levels Indicator
Overview
Dynamic horizontal lines showing rolling Volume Weighted Average Price (VWAP) levels for multiple timeframes (7D, 30D, 90D, 365D) that update in real-time as new bars form.
Who This Is For
Day traders using VWAP as support/resistance
Swing traders analyzing multi-timeframe price structure
Scalpers looking for mean reversion entries
Options traders needing volatility bands for strike selection
Institutional traders tracking volume-weighted fair value
Risk managers requiring dynamic stop levels
How To Trade With It
Mean Reversion Strategies:
Buy when price is below VWAP and showing bullish divergence
Sell when price is above VWAP and showing bearish signals
Use multiple timeframes - enter on shorter, confirm on longer
Target opposite VWAP level for profit taking
Breakout Trading:
Watch for price breaking above/below key VWAP levels with volume
Use 7D VWAP for intraday breakouts
Use 30D/90D VWAP for swing trade breakouts
Confirm breakout with move beyond first standard deviation band
Support/Resistance Trading:
VWAP levels act as dynamic support in uptrends
VWAP levels act as dynamic resistance in downtrends
Multiple timeframe VWAP confluence creates stronger levels
Use standard deviation bands as additional S/R zones
Risk Management:
Place stops beyond next VWAP level
Use standard deviation bands for position sizing
Exit partial positions at VWAP levels
Monitor distance table for overextended moves
Key Features
Real-time Updates: Lines move and extend as new bars form
Individual Styling: Custom colors, widths, styles for each timeframe
Standard Deviation Bands: Optional volatility bands with custom multipliers
Smart Labels: Positioned above, below, or diagonally relative to lines
Distance Table: Shows percentage distance from each VWAP level
Alert System: Get notified when price crosses VWAP levels
Memory Efficient: Automatically cleans up old drawing objects
Settings Explained
Display Group: Show/hide labels, font size, line transparency, positioning
Individual VWAP Groups: Color, line width (1-5), line style for each timeframe
Standard Deviation Bands: Enable bands with custom multipliers (0.5, 1.0, 1.5, 2.0, etc.)
Labels Group: Position (8 options including diagonal), custom text, price display
Additional Info: Distance table, alert conditions
Technical Implementation
Uses rolling arrays to maintain sliding windows of price*volume data. The core calculation function processes both VWAP and standard deviation efficiently. Lines are created dynamically and updated every bar. Memory management prevents object accumulation through automatic cleanup.
Best Practices
Start with 7D and 30D VWAP for most strategies
Add 90D/365D for longer-term context
Use standard deviation bands when volatility matters
Position labels to avoid chart clutter
Enable distance table during high volatility periods
Set alerts for key VWAP level breaks
Market Applications
Forex: Major pairs during London/NY sessions
Stocks: Large cap names with good volume
Crypto: Bitcoin, Ethereum, major altcoins
Futures: ES, NQ, CL, GC with continuous volume
Options: Use SD bands for strike selection and volatility assessment

Opening Range Breakout (15 mins Range)Take the guesswork out of your trading with the Opening Range Breakout Pro script. This tool automatically marks the high and low of the first 15 minutes of the NYSE session, then highlights the first candle to break out above or below this range—removing ambiguity from your trade entries.
The opening range is one of the most powerful concepts in day trading. By identifying the price range set during the market’s first minutes, you gain a clear framework for your trades. When price breaks out above the range, it often signals a strong bullish move; a break below signals bearish momentum. This script visually marks these moments, so you can react quickly and confidently.
Why use Opening Range Breakout Pro?
• Defined Entry and Exit Points: The script gives you clear, objective breakout levels—no more guessing when to enter a trade.
• Removes Emotional Trading: With visual cues for breakouts, you can follow a systematic approach and avoid hesitation or FOMO.
• Backtested, Time-Tested Strategy: The opening range breakout has been used by professional traders for decades to capture early trends and maximize profit potential.
• High Reward Potential: By capitalizing on the volatility and momentum of the opening session, traders often catch the best moves of the day.
• Easy to Use: Just add to your chart—no configuration needed. The script works on any NYSE stock, on a 5-minute chart.
How it works:
• Draws the opening 15-minute high and low as orange lines.
• Labels the range prices for quick reference.
• Marks the first candle to close above the range with an orange ▲, and the first to close below with an orange ▼.
Take control of your trading day, remove uncertainty, and trade with confidence—just like the pros.

Liquidity Zones (JTS)Title: Liquidity Zones (JTS)
Description:
This script marks out key liquidity zones using pivot highs and lows. It includes:
Buy-Side Liquidity (Highs): Shown in red lines
Sell-Side Liquidity (Lows): Shown in green lines
Sweep Protection: Zones will only be removed after a defined number of bars AND a true sweep beyond the level
Toggle Controls: Enable/disable highs or lows individually
Adjustable Settings: Pivot length, sweep delay, max lines, and colors
Perfect for traders looking to track untapped or recently swept liquidity.
Created by JTS
For educational and strategic use

Single Line Fibs with Strict Overlap CheckSingle Line Fibs with Strict Overlap Check
Overview:
The "Single Line Fibs with Strict Overlap Check" indicator is a sophisticated tool designed for technical analysts and traders focusing on Elliott Wave theory. This indicator overlays Fibonacci retracement and extension levels on a price chart, specifically tailored for a single zigzag line (Line 2), to identify potential support, resistance, and impulse wave targets. It incorporates a strict overlap check to ensure valid impulse waves, adhering to Elliott Wave principles.
Key Features:
Zigzag Detection: Utilizes pivot highs and lows based on customizable lengths (White ZigZag: 2 bars, Yellow ZigZag: 15 bars) to construct a zigzag pattern.
Fibonacci Levels:
Retracements: 0.236, 0.382, 0.5, 0.618, 0.786 (gray, 50% transparency).
B Wave Extensions: 1.236, 1.386 (orange, 50% transparency).
Impulse Extensions: 1.0, 1.236, 1.386, 1.618 (green, 50% transparency), drawn from the next pivot low if valid.
Wave Count Filter: Displays Fibonacci levels only when the internal wave count from Line 1 reaches or exceeds a user-defined threshold (default: 5).
Overlap Validation: Implements a strict overlap check per Elliott Wave rules. If the next pivot low overlaps the previous high, no Impulse extensions are drawn, and a red 'X' (50% transparency) marks the invalid pivot low.
Customization:
White ZigZag Length: Adjusts the sensitivity of the initial pivot detection.
Yellow ZigZag Length: Sets the primary zigzag length.
Min Line 1 Waves for Line 2 Fib: Defines the minimum wave count threshold.
Enable Overlap Removal: Toggles the overlap validation feature.
Usage:
Apply the indicator to your chart (e.g., 30-minute timeframe).
Adjust input parameters to match your trading strategy (e.g., length2 = 15, waveThreshold12 = 5).
Observe Fibonacci levels appearing at pivot highs when the wave count threshold is met. Impulse extensions will only plot after a valid pivot low below the previous high.
Use the red 'X' as an alert for invalid impulse waves, indicating potential trend reversals or corrections.
Interpretation:
Retracements: Identify potential support levels within the upwave.
B Wave Extensions: Highlight extended correction targets.
Impulse Extensions: Project potential price targets for the next wave, valid only if the overlap check passes.
Red 'X': Signals an invalid impulse wave, suggesting a review of wave structure.
Limitations:
Designed for a single zigzag line; multi-line analysis requires additional customization.
Performance may vary with highly volatile instruments or short timeframes due to pivot sensitivity.
Author: Developed by ScottDog for TradingView users, this indicator leverages advanced Pine Script v6 features for precise wave analysis.
Version: 1.0 (Fail-Safe)
Last Updated: June 24, 2025

Reversal Levels (Magistr)The REVERSAL LEVELS indicator is designed to detect major reversals and track dynamic support/resistance zones.
This indicator analyzes price fluctuations using reversal highs/minima and a smoothed baseline trendline. It highlights key reversal levels and keeps them active until they are broken, providing a clear visual basis for price structure and trend alignment. The reversals are calculated in real time using lag-free logic, making it very responsive to market conditions.

ORB + Fib ZoneAllows user to adjust range of ORB. The box in the middle is the Fibonacci range between 38.2% and 61.8% designed for pullbacks into the ORB as confirmation before entry. Alerts can be set if the candle closes above or below the ORB.

MML Multi-Timeframe Overlapin testing working for multi time frame this will be based off MMLs and updates to tradingview for integration.

ORB + Fib ZoneAllows user to adjust range of ORB. The box in the middle is the Fibonacci range between 38.2% and 61.8% designed for pullbacks into the ORB as confirmation before entry.

Auto LevelsAutomatically paints open, high, low, and close levels from previous periods.
RTH data only in traditional cash markets.
Previous periods included are:
- Day
- Week
- Month
- Quarter
- Year.
Customization options allow for:
- Enabling/disabling of each type of level for each period
- Text size and colors of labels
- Colors and styles of lines
- Line extension length
*Also, there is a close-price ray included. Can be disabled.
Creates new levels once they generate, and removes old and outdated levels.
The idea is to be transparent about the relevancy of levels and portray them as they generate in time. Full 2-way-ray horizontal lines can appear to give false-reaction data in historical bars from before the level was generated. This can give traders a false sense of importance to a level.
Works on any ticker/symbol.
Known bugs:
** Open levels distort based on open/closed status in traditional markets. Fix pending.
** Different candle types (Heikin Ashi) distort all open/close level data. Fix pending.
** Line extension doesn't work in closed markets. Fix pending.
Message me on twitter for other bug reports.

DisplacementAndPinBar [TFO]# DisplacementAndPinBar v1.5 - Advanced Market Structure Indicator
## Overview
DisplacementAndPinBar v1.5 is a sophisticated technical indicator that combines displacement detection with advanced pin bar analysis to identify high-probability trading opportunities. Unlike traditional pin bar indicators that create chart clutter with insignificant signals, this indicator uses mathematical filtering to show only meaningful market structure patterns.
## Key Features
### 🎯 **True Pin Bar Detection**
- **Level Rejection Logic**: Pin bars must break recent highs/lows (adjustable lookback period)
- **Statistical Significance**: Uses standard deviation to filter candle size
- **Smart Classification**: Distinguishes between true pin bars and momentum impulse candles
- **Visual Clarity**: Green/red circles with "PIN" text for easy identification
### 📈 **Displacement Detection**
- **Momentum Identification**: Detects large body candles showing strong directional movement
- **Open-to-Close Analysis**: Measures true momentum (not just volatility)
- **Objective Filtering**: Uses standard deviation over customizable lookback period
- **Market Structure**: Identifies significant shifts in buying/selling pressure
### ⚡ **Advanced Signal Types**
#### 1. Pin Bar Signals
- **Bullish Pin Bars**: Long lower wicks rejecting at key support levels
- **Bearish Pin Bars**: Long upper wicks rejecting at key resistance levels
- **Requirements**: Must break recent 20-candle highs/lows + meet wick-to-body ratios
#### 2. Confirmation Signals
- **Follow-Through Detection**: Validates pin bar signals with directional movement
- **Smart Filtering**: Requires proper body size and minimal opposing wicks
- **Visual**: Large yellow/pink triangles (semi-transparent)
#### 3. Displacement Momentum Signals
- **Continuation Pattern**: Two displacement candles in same direction within timeframe
- **No Opposing Signal**: Ensures clean momentum without conflicting moves
- **Trade Signal**: Huge yellow/pink triangles indicating strong momentum building
#### 4. Impulse & Indecision Detection
- **Impulse Candles**: Large wicks without level rejection (gray triangles)
- **Indecision Patterns**: Range-bound rejection patterns (gray diamonds)
- **Context Awareness**: Helps understand market state and volatility
## Technical Specifications
### Mathematical Foundation
- **Standard Deviation Filtering**: Eliminates noise by requiring statistical significance
- **Historical Comparison**: Manual loop calculations for reliable level detection
- **Independent Criteria**: Pin bars use High-to-Low, Displacement uses Open-to-Close
- **Multi-Timeframe Logic**: Optimized for 5-minute charts but works on all timeframes
### Default Settings (Optimized for 5-minute)
- **Displacement Length**: 40 periods
- **Displacement Strength**: 4.0x standard deviation
- **Pin Bar Lookback**: 20 periods
- **Pin Bar Body-to-Wick Ratio**: 4.0
- **Displacement Signal Lookback**: 6 periods
- **FVG Requirement**: OFF (recommended for optimal signals)
## Visual Hierarchy
### Signal Priority (Most to Least Important)
1. **🔴🟢 PIN Circles**: True pin bars at key levels (highest probability reversals)
2. **🔺 Huge Triangles**: Displacement momentum signals (strong continuation)
3. **🔺 Large Triangles**: Pin bar confirmations (validation signals)
4. **🔺 Small Triangles**: Impulse patterns (momentum without level interaction)
5. **💎 Diamonds**: Indecision at range extremes
6. **🟡🟣 Colored Candles**: Base displacement detection
### Visual Enhancements
- **Semi-Transparent Triangles**: Prevents hiding pin bar signals when zoomed out
- **Black Text on Circles**: Enhanced readability
- **Size Differentiation**: Clear hierarchy through symbol sizing
- **Color Coding**: Intuitive green/red for direction, blue for momentum
## Trading Applications
### Reversal Trading
- **Pin Bar Entries**: High-probability reversals at key support/resistance
- **Confirmation Required**: Wait for follow-through triangle for validation
- **Stop Placement**: Just beyond pin bar wick for optimal risk/reward
### Momentum Trading
- **Displacement Signals**: Trade continuation when two displacement candles align
- **Trend Following**: Excellent for catching momentum shifts and breakouts
- **Multiple Timeframes**: Combine with higher timeframe bias for best results
### Market Context
- **Impulse Analysis**: Understand when market is in momentum vs. consolidation
- **Indecision Patterns**: Identify range-bound conditions and potential breakouts
- **Volume Confirmation**: Displacement often coincides with volume spikes
## Alert System
Comprehensive alert functionality for all major signals:
- Bullish/Bearish Pin Bar detection
- Pin Bar confirmation signals
- Displacement momentum signals
- Customizable alert messages with context
## Settings Organization
### 🎯 Trading Signals (Priority Settings)
- Displacement trade signal toggle and lookback period
- Pin bar and confirmation detection toggles
### 📊 Core Settings Groups
- **Displacement Settings**: Length, strength, FVG requirements
- **Pin Bar Settings**: Lookback periods, ratios, thresholds
- **Visual Settings**: Colors and display preferences
### 💡 Helpful Tooltips
- Detailed explanations for each setting
- Optimization recommendations
- Best practices for different timeframes
## Why This Indicator is Different
### ❌ **What Most Pin Bar Indicators Do Wrong**
- Show every candle with long wicks (creates noise)
- No context about market structure or significance
- Fixed parameters that don't adapt to volatility
- No distinction between rejection and momentum patterns
### ✅ **What DisplacementAndPinBar v1.5 Does Right**
- **Quality Over Quantity**: Only shows statistically significant patterns
- **Market Structure Awareness**: Considers recent highs/lows and volatility
- **Multiple Signal Types**: Comprehensive pattern recognition
- **Visual Clarity**: Clean, organized display with logical hierarchy
- **Professional Features**: Proper alerts, settings organization, documentation
## Best Practices
### Timeframe Recommendations
- **Primary**: 5-minute charts (optimized settings)
- **Secondary**: 15-minute and 1-hour for confirmation
- **Scalping**: 1-minute with adjusted sensitivity
### Market Application
- **Forex**: Excellent during London/NY sessions
- **Crypto**: Particularly effective on Bitcoin and major altcoins
- **Stocks**: Works well on liquid stocks and indices
- **Futures**: Optimal on high-volume contracts
### Risk Management
- **Stop Losses**: Use pin bar wicks and displacement candle extremes
- **Position Sizing**: Reduce size in low-probability setups
- **Confirmation**: Wait for follow-through signals when possible
- **Context**: Consider higher timeframe trends and major support/resistance
## Version History
- **v1.1**: Initial pin bar and displacement integration
- **v1.3**: Added confirmation logic and refined indecision detection
- **v1.5**: Added displacement momentum signals, organized settings, comprehensive alerts
## Credits
Based on original displacement work by tradeforopp, enhanced with advanced pin bar detection and signal classification by AleksandarPesic & Claude (Anthropic).
---
*DisplacementAndPinBar v1.5 represents a new standard in technical analysis, combining mathematical rigor with practical trading applications. Perfect for traders who want quality signals without the noise.*

ZY Return ZonesThe ZY Return Zones indicator automatically draws the potential support/resistance levels of the parity and clearly displays them on the chart. Although the default settings are the last support/resistance levels, users can change the settings to show the last 6 support/resistance points in the indicator settings.

Deep Z MA + 2 CC + OB + CPR + last 5 MinScript Overview
Two-Consecutive Candle Coloring
Tracks consecutive red/green candles and paints streak bars in softer hues.
Highlights candles piercing previous candle’s wick in bold colors (deep red/green).
Order Block (OB) Detection
Identifies bars with >1.5× range compared to prior bar and opposite color.
Marks them as OB and colors them bright green (bullish) or red (bearish).
Central Pivot Range (CPR) & Daily S1/R1
Calculates pivot, BC, TC, S1, R1 for daily timeframe using request.security.
Plots yesterday’s CPR and either yesterday’s S1/R1 or high/low depending on which level extends further.
Also plots current intraday high/low.
Moving Averages & Signals
Plots MA21 and MA50 (SMA or EMA by user choice), colored green if MA21 > MA50, otherwise red.
Marks crossover (buy) and crossunder (sell) with triangle shapes.
Prev-Day 5‑Minute Candle Box
Records last 5‑min candle before daily close, plots a shaded box next day to show its high/low zone.
Changes box color green or red if price breaks above/below—helps visualize early breakout.
Weak Candle Detection
Flags doji, hammer variants, and small-bodied candles, coloring them semi-transparent gray.
Daily Delta Label Near R1
Calculates dynamic “Δ” percentage per weekday.
Places a label ~36 bars ahead, offset above intraday high, showing that delta value.
Final Candle Coloring
Applies all coloring logic via barcolor().

YZH super wma modelYZH Super WMA Model
Overview
The "YZH Super WMA Model" is a customizable technical analysis indicator built in Pine Script v5 for TradingView. It generates trading signals using three configurable moving averages (MA1, MA2, MA3) and a wick-based filter to enhance signal accuracy. The indicator is overlaid on the price chart and supports multiple MA types: SMA, EMA, WMA, HMA, RMA, and VWMA.
Features
Flexible Moving Averages:
Three MAs (MA1, MA2, MA3) with customizable types and periods.
Default settings: MA1 (50-period SMA), MA2 (200-period HMA), MA3 (100-period EMA).
Adjustable visibility, colors, and line widths.
Wick-Based Filter:
Uses a wick ratio threshold (default: 0.5) to filter signals based on candle wick size.
Enhances signal reliability by focusing on significant wick patterns.
Signal and Trend Logic:
Signal MA (default: MA1) generates entry signals; trend MA (default: MA2) filters trend direction.
Long signals: Price crosses above signal MA, closes above trend MA, with sufficient lower wick.
Short signals: Price crosses below signal MA, closes below trend MA, with sufficient upper wick.
Signals confirmed within a user-defined bar range (default: 5).
Visualization:
Long signals: Green upward triangles below bars, labeled "L".
Short signals: Red downward triangles above bars, labeled "S".
Optional setup points and information table for enhanced analysis.
Alerts:
Triggers alerts on confirmed signals with detailed messages including signal type, MA settings, and price.
Recommended Settings
SMA20-SMA200: For swing trading, capturing short-term vs. long-term trends.
SMA50-HMA200: For trend-following, balancing medium-term signals with smooth long-term trends.
WMA48-WMA200: For volatile markets, emphasizing recent price action.
WMA174-SMA200: For higher time frame (HTF) trend following, ideal for long-term analysis.
Use Cases
Trend following, reversal trading, and customizable strategies.
Suitable for various markets (stocks, forex, crypto) and timeframes.
How to Use
Add to TradingView chart.
Configure MA types, periods, and colors.
Adjust wick threshold and trigger bars.
Enable visualizations and alerts as needed.
Conclusion
The "YZH Super WMA Model" is a robust tool for traders seeking reliable, customizable signals. Backtest the recommended settings to optimize for your market and timeframe.

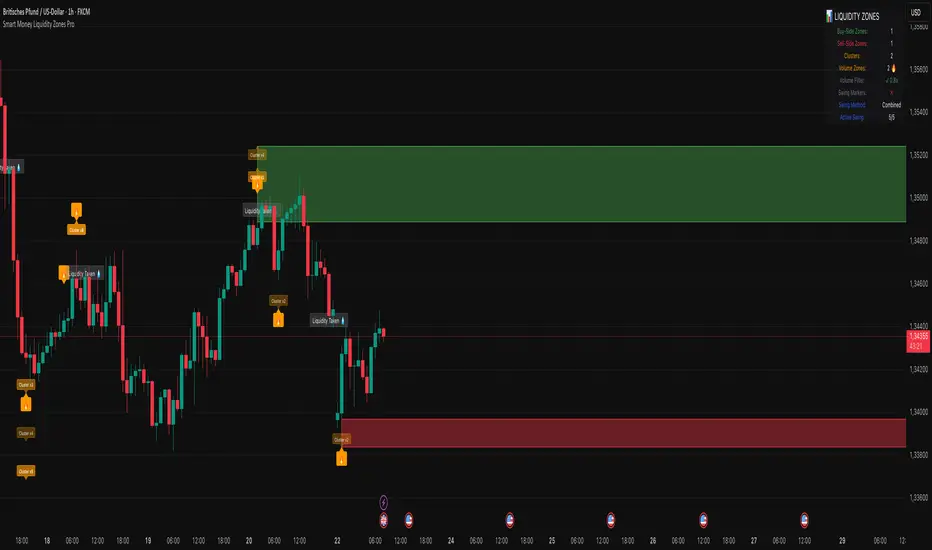
Smart Money Liquidity Zones ProThe Smart Money Liquidity Zones Pro indicator identifies and visualizes key liquidity areas in the market where institutional traders (smart money) are likely to have placed their stop-loss orders. These zones represent areas of high liquidity that often act as magnets for price, making them valuable reference points for trading decisions.
What the Indicator Does
Core Functionality
Swing Point Detection: The indicator identifies significant swing highs and lows using three different methods (Classic, Fractal, or Combined) to locate potential liquidity pools.
Liquidity Zone Creation: At each valid swing point, the indicator creates a horizontal zone representing an area where stop-loss orders are likely clustered.
Zone Clustering: When multiple swing points occur near the same price level, the indicator intelligently combines them into larger cluster zones, indicating stronger liquidity areas.
Volume Confirmation: The indicator can filter zones based on volume, showing only those swing points that occurred with significant trading volume.
Zone Break Detection: When price closes through a liquidity zone, the indicator marks it as "Liquidity Taken" and removes the zone from the chart.
Zone Types
Buy-Side Liquidity Zones (Green): Created at swing highs where short sellers' stop-losses are likely placed
Sell-Side Liquidity Zones (Red): Created at swing lows where long traders' stop-losses are likely placed
Trading Strategies
Basic Concepts
Liquidity Runs: Price often moves toward these zones to trigger stop-loss orders before reversing. This creates trading opportunities.
Support and Resistance: Unbroken liquidity zones can act as support (sell-side) or resistance (buy-side) levels.
Breakout Confirmation: When price breaks through a zone with strong momentum, it often continues in that direction.
Entry Strategies
Strategy 1: Liquidity Grab Reversa l
Wait for price to spike into a liquidity zone
Look for rejection candles (wicks) at the zone
Enter in the opposite direction after confirmation
Place stop-loss beyond the liquidity zone
Strategy 2: Zone Break Continuation
Wait for price to close decisively through a zone
Enter on the retest of the broken zone
Target the next liquidity zone in the direction of the break
Strategy 3: Zone Clustering Trade
Focus on areas with multiple overlapping zones (clusters)
These areas offer higher probability setups
Trade bounces from cluster zones with tighter risk management
Risk Management
Always use stop-losses beyond the liquidity zones
Consider the overall market context and trend
Zones on higher timeframes are generally more significant
Volume-confirmed zones have higher reliability
Settings Explanation
Swing Detection Settings
Swing Strength (Lookback Bars)
Determines how many bars to look back for swing point validation
Higher values find more significant swings but fewer zones
Recommended settings:
1m-5m charts: 3-5
15m-1h charts: 5-8
Daily charts: 5-10
Weekly charts: 3-5
Monthly charts: 2-3
Adaptive Swing Detection
Automatically adjusts swing detection based on available historical data
Prevents errors when there's limited chart history
Recommended to keep enabled
Minimum Bars for Swing
Sets the absolute minimum bars required for swing detection
Lower values allow detection in limited data conditions
Swing Detection Method
Classic: Strict price comparison for pure swing highs/lows
Fractal: Williams Fractal pattern (2 bars on each side)
Combined: Uses both methods for maximum zone detection
Auto-Adjust for Timeframe
Automatically optimizes settings based on chart timeframe
Prevents inappropriate settings on higher timeframes
Zone Settings
Max Number of Visible Zones
Limits the number of zones displayed to prevent chart clutter
Older zones are automatically removed
Max Zone Duration (Bars)
Zones older than this are automatically deleted
Keeps the chart focused on recent liquidity areas
Enable Zone Clustering
Groups nearby zones into larger clusters
Identifies stronger liquidity areas
Cluster Threshold (%)
Maximum price distance for zones to be clustered
Lower values create tighter clusters
Show Cluster Labels
Displays "Cluster x2", "Cluster x3" etc. on grouped zones
Volume Filter Settings
Enable Volume Filter
When enabled, only creates zones at high-volume swing points
Increases zone quality but reduces quantity
Volume Multiplier
Multiplier for average volume to determine "high volume"
Lower values (0.7-0.9) create more zones
Higher values (1.2+) create fewer, higher-quality zones
Volume SMA Period
Period for calculating average volume
Higher values create smoother volume baseline
Show Volume Confirmation Icon
Displays a fire emoji on volume-confirmed zones
Volume Visualization Settings
Show Volume Dots
Displays dots below high-volume bars
Dynamic Zone Colors
Volume-confirmed zones appear with more intense colors
Show Volume Background
Highlights the chart background on high-volume bars
Visual Settings
Buy-Side/Sell-Side Zone Colors
Customize colors for long and short liquidity zones
Border Width
Thickness of zone borders (1-3)
Show 'Liquidity Taken' Labels
Displays labels when zones are broken
Label Size
Size of the liquidity taken labels
Show Swing Point Markers
Displays triangles at detected swing points
Show Debug Info
Shows diagnostic information for troubleshooting
Dashboard Settings
Show Dashboard
Toggles the information panel display
Dashboard Position
Choose from 6 positions on the chart
Background Color
Dashboard background color
Text Color
Dashboard text color
Text Size
Dashboard text size (tiny/small/normal/large)
Tips for Effective Use
Start with default settings and adjust based on your trading style and timeframe
Use multiple timeframes to identify confluence between zones on different scales
Combine with other indicators like trend analysis or momentum oscillators
Pay attention to clusters as they represent stronger liquidity areas
Monitor volume-confirmed zones for higher probability setups
Adjust zone duration based on your trading timeframe (shorter for scalping, longer for swing trading)
Use the debug feature if zones aren't appearing to understand why
Keep the chart clean by limiting the number of visible zones
Common Issues and Solutions
No zones appearing:
Lower the Swing Strength setting
Switch to Combined detection method
Disable volume filter if active
Check if there's enough historical data
Too many zones:
Increase Swing Strength
Enable volume filter
Reduce Max Number of Visible Zones
Increase Cluster Threshold
Zones disappearing too quickly:
Increase Max Zone Duration
Check if zones are being broken by price
Poor performance on higher timeframes:
Enable Auto-Adjust for Timeframe
Use appropriate Swing Strength for the timeframe
Consider using Classic method instead of Fractal
Contrarian with 5 Levels5 Levels application was inspired and adapted from Predictive Ranges indicator developed by Lux Algo. So much credit to their work.
Indicator Description: Contrarian with 5 Levels
Overview
The "Contrarian with 5 Levels" indicator is a powerful tool designed for traders seeking to identify potential reversal points in the market by combining contrarian trading principles with dynamic support and resistance levels. This indicator overlays a Simple Moving Average (SMA) shadow and five adaptive price levels, integrating Institutional Concepts of Structure (ICT) such as Break of Structure (BOS) and Market Structure Shift (MSS) to provide clear buy and sell signals. It is ideal for traders looking to capitalize on overextended price movements, particularly on the daily timeframe, though it is adaptable to other timeframes with proper testing.
How It Works
The indicator operates on two core components:
Contrarian SMA Shadow: A shaded region between the SMA of highs and lows (default length: 100) acts as a dynamic zone to identify overbought or oversold conditions. When the price moves significantly outside this shadow, it signals potential exhaustion, aligning with contrarian trading principles.
Five Adaptive Levels: Using a modified ATR-based calculation, the indicator plots five key levels (two resistance, one average, and two support) that adjust dynamically to market volatility. These levels serve as critical zones for potential reversals.
ICT Structure Analysis: The indicator incorporates BOS and MSS logic to detect shifts in market structure, plotting bullish and bearish breaks with customizable colors for clarity.
Buy and sell signals are generated when the price crosses key levels while outside the SMA shadow, indicating potential reversal opportunities. The signals are visualized as small circles above (sell) or below (buy) the price bars, making them easy to interpret.
Mathematical Concepts
SMA Shadow: The indicator calculates the SMA of the highest highs and lowest lows over a user-defined period (default: 100). This creates a dynamic range that highlights extreme price movements, which contrarian traders often target for reversals.
Five Levels Calculation: The five levels are derived using a volatility-adjusted formula based on the Average True Range (ATR). The average level (central pivot) is calculated as a smoothed price, with two upper (resistance) and two lower (support) levels offset by a multiple of the ATR (default multiplier: 6.0). This adaptive approach ensures the levels remain relevant across varying market conditions.
ICT BOS/MSS Logic: The indicator identifies pivot highs and lows on a user-defined timeframe (default: daily) to detect structural breaks. A BOS occurs when the price breaks a prior pivot high (bullish) or low (bearish), while an MSS signals a shift in market direction, providing context for potential reversals.
Entry and Exit Rules
Buy Signal (Blue Dot Below Bar): Triggered when the closing price is below both the SMA shadow (smaLow) and the average level (avg), and the price crosses under either the first or second support level (prS1 or prS2). This suggests the market may be oversold, indicating a potential reversal upward.
Sell Signal (White Dot Above Bar): Triggered when the closing price is above both the SMA shadow (smaHigh) and the average level (avg), and the price crosses over either the first or second resistance level (prR1 or prR2). This suggests the market may be overbought, indicating a potential reversal downward.
Recommended Usage
This indicator is optimized for the daily timeframe, where it has been designed to capture significant reversal opportunities in trending or ranging markets. However, it can be adapted to other timeframes (e.g., 1H, 4H, 15M) with proper testing of settings such as SMA length, ATR multiplier, and structure timeframe. Users are encouraged to backtest and optimize parameters to suit their trading style and asset class.
Customization Options
SMA Length: Adjust the SMA period (default: 100) to control the sensitivity of the shadow.
Five Levels Length and Multiplier: Modify the length (default: 200) and ATR multiplier (default: 6.0) to fine-tune the support/resistance levels.
Timeframe Settings: Set separate timeframes for structure analysis and five levels to align with your trading strategy.
Color and Signal Display: Customize colors for BOS/MSS lines and toggle buy/sell signals on or off for a cleaner chart.
Why Use This Indicator?
The "Contrarian with 5 Levels" indicator combines the power of contrarian trading with dynamic levels and market structure analysis, offering a unique perspective for identifying high-probability reversal setups. Its intuitive design, customizable settings, and clear signal visualization make it suitable for both novice and experienced traders. Whether you're trading forex, stocks, or cryptocurrencies, this indicator provides a robust framework for spotting potential turning points in the market.
We hope you find the "Contrarian with 5 Levels" indicator a valuable addition to your trading toolkit! Happy trading!
Please leave feedback in the comments section.

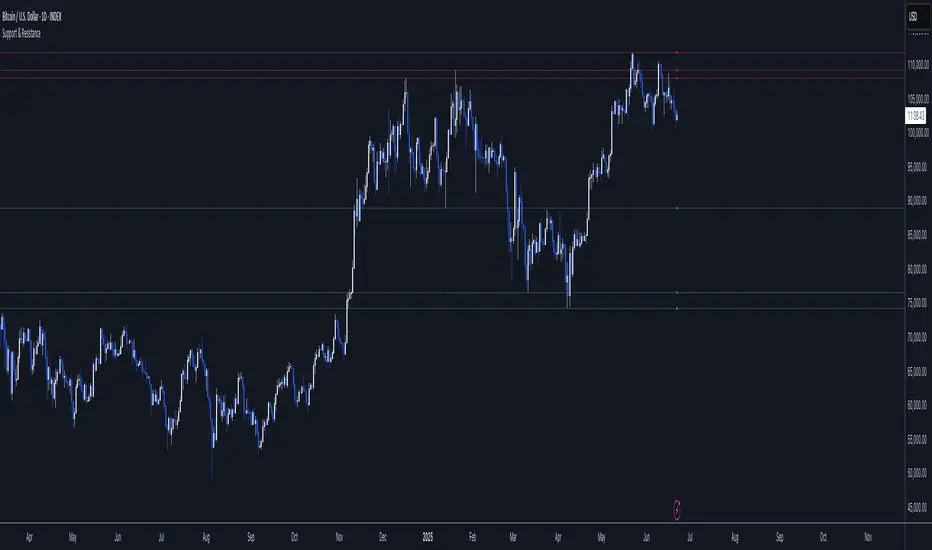
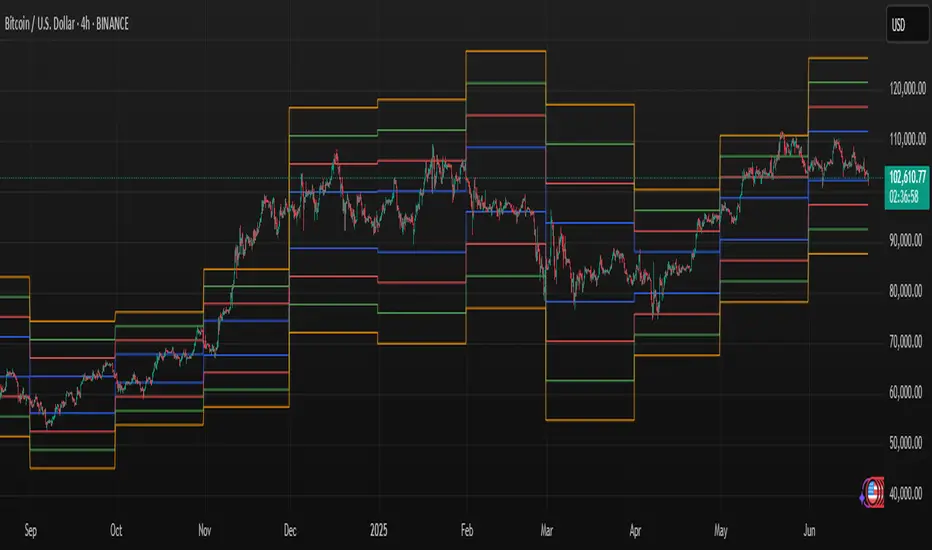
Support & ResistanceWhat is this script ?
Pivot points are tools used to identify potential support and resistance levels in trading. They are calculated using the previous period’s high, low, and close prices. This script leverages pivot points to plot up to four support levels and four resistance levels, helping traders visualize key price zones.
How to Use the Script?
Support and resistance levels represent price zones where significant liquidity often exists due to past price interactions. These levels are critical for traders to:
Assess Trend Continuation or Reversal: Prices may pause, reverse, or break through at these levels, signaling potential trend changes or continuations.
Manage Risk: Support and resistance levels are ideal for placing stop-loss orders or setting profit targets, as they indicate areas where price reactions are likely.
Plan Entries and Exits: Traders can buy near support levels, sell near resistance levels, or trade breakouts when prices move decisively beyond these zones.
Volume Zones IndicatorVolume Zones Indicator — VWAP with Dynamic Monthly Volume Zones
This indicator is an enhanced version of the classic VWAP (Volume Weighted Average Price), designed to create clear monthly zones around VWAP based on average price range (ATR) and volume activity.
The core idea is to highlight key zones where price is more likely to reverse or consolidate, based on where significant trading volume occurs.
How does it work?
VWAP is calculated over the last N days (set by the lookbackPeriod input).
Four zones are plotted above and below VWAP, spaced using a multiple of ATR.
Each zone has its own color for clarity:
Blue — closest to VWAP
Red — second band
Green — third band
Orange — outer band (potential breakout or exhaustion zone)
If the current volume exceeds the moving average of volume, it is highlighted directly on the chart. This helps detect accumulation or distribution moments more easily.
What does the trader see?
You see horizontal colored bands on the chart that update at the start of each new month. These zones:
Remain fixed throughout the month
Automatically adjust based on recent volume and volatility
Act as dynamic support/resistance levels
Best used for:
Mean reversion strategies — identifying pullbacks toward value areas
Support and resistance mapping — automatic SR zones based on price/volume behavior
Breakout filtering — when price reaches zone 3 or 4, trend continuation or reversal is likely
Adding volume context to price action — works well with candlestick and pattern analysis
Settings
Lookback Period (Days): VWAP and volume smoothing length
Volume Area Threshold %: Reserved for future functionality
Works on any timeframe; best suited for 4H timeframe.
Zones are calculated and fixed monthly for clean visual context
Combines price structure with actual volume flow for more reliable decision-making
Rapid Ultimat Trading ZonesCRITICAL: The "Set It and Forget It" Timezone System
Have you ever had your session indicators become misaligned when London or New York changes clocks for Daylight Saving Time (DST)? This is a universal problem for traders, forcing you to manually adjust settings twice a year to avoid missing key trading windows. It’s confusing, frustrating, and can lead to costly mistakes.
The Rapid Ultimate Trading Zones indicator permanently solves this issue. We have engineered it with a powerful 'Set It and Forget It' timezone system that provides unmatched accuracy and peace of mind.
How It Works : Automatic DST Adjustment
Each Killzone and each Opening Range in this indicator has its own independent timezone setting. You simply match each session to its real-world location one time. From that moment on, the indicator handles everything automatically.
For the London Session: Set its timezone to Europe/London. The indicator will automatically handle the switch between GMT (winter) and BST (summer). You do not need to do anything.
For the New York Session: Set its timezone to America/New_York. The indicator will automatically handle the switch between EST (winter) and EDT (summer).
Once configured, your session timings will remain perfectly accurate forever. No more manual adjustments. No more confusion. Just precise, reliable session data, day in and day out.
Here is the complete user guide with the newly emphasized section integrated for your convenience.
Rapid Ultimate Trading Zones - User Guide
Created by Rapid Lodgements
1. Introduction: Your All-in-One Session & Levels Tool
Tired of manually marking out trading sessions and key levels every day? The Rapid Ultimate Trading Zones indicator is a comprehensive, institutional-grade tool designed to automatically visualize the most important price and time levels on your chart.
From London Killzone highs and lows to multiple, flexible Opening Ranges, this indicator provides a clean, automated, and fully customizable solution to help you focus on what matters most: your trading.
2. CRITICAL: The "Set It and Forget It" Timezone System
Have you ever had your session indicators become misaligned when London or New York changes clocks for Daylight Saving Time (DST)? This is a universal problem for traders, forcing you to manually adjust settings twice a year to avoid missing key trading windows. It’s confusing, frustrating, and can lead to costly mistakes.
The Rapid Ultimate Trading Zones indicator permanently solves this issue. We have engineered it with a powerful 'Set It and Forget It' timezone system that provides unmatched accuracy and peace of mind.
How It Works: Automatic DST Adjustment
Each Killzone and each Opening Range in this indicator has its own independent timezone setting. You simply match each session to its real-world location one time. From that moment on, the indicator handles everything automatically.
For the London Session: Set its timezone to Europe/London. The indicator will automatically handle the switch between GMT (winter) and BST (summer). You do not need to do anything.
For the New York Session: Set its timezone to America/New_York. The indicator will automatically handle the switch between EST (winter) and EDT (summer).
Once configured, your session timings will remain perfectly accurate forever. No more manual adjustments. No more confusion. Just precise, reliable session data, day in and day out.
3. Feature Breakdown
Killzones & Killzone Pivots
This is the core feature of the indicator. Killzones are specific, high-volume time windows for the major market sessions. The indicator will automatically draw a box around these times and mark their high and low price pivots.
Killzones Settings:
Enable/disable each session (Asia, London, NY AM, NY Lunch, NY PM) with the checkbox.
Customize the Session start and end times.
Crucially, set the Timezone for each session to its local market time.
Killzone Pivots Settings:
Labels & Colors: Customize the text label and color for each Killzone's high and low pivot lines. The color you choose here controls the color for the pivots and the session box.
Extend Pivots: Choose if the pivot lines should disappear after being touched (Until Mitigated) or continue to extend.
Alert Broken Pivots: Enable this to receive a TradingView alert whenever price breaks a recent Killzone high or low.
Show Midpoints: Optionally display the 50% level between a Killzone's high and low.
Flexible Opening Ranges (Up to 3 Instances)
This powerful feature allows you to track the initial price range of up to three different sessions independently.
Use Cases:
Track the first 15 minutes of the New York session with Opening Range 1.
Track the first hour of the London session with Opening Range 2.
Track the Asian session range with Opening Range 3.
Configuration (for each OR):
Enable OR: Toggle the specific range on or off.
Session Start-End: Defines the main session you are analyzing.
Timezone: Set the correct local timezone for the session you are tracking.
Range Minutes: The most important setting. Defines how long the opening range lasts (e.g., 15 for the first 15 minutes).
Extend OR lines right: Extends the high and low lines into the future.
Custom Lines & Timestamps
For marking your own specific levels and times that are independent of the Killzones.
Dedicated Timezone : This entire section is controlled by one separate timezone menu, which is set to GMT+0 by default. All times you enter here will be interpreted based on this setting.
Horizontal Lines (H-Line): Draws a horizontal line at the open price of the candle that occurs at your specified time. You get two independent lines.
Vertical Lines (V-Line): Draws a vertical line at the time you specify. You get two independent lines.
Daily, Weekly, Monthly (DWM) Levels
For a higher-timeframe perspective, this feature automatically plots:
Daily, Weekly, and Monthly Opening Prices.
Previous Day, Week, and Month Highs and Lows.
Vertical line separators for the start of each Day, Week, or Month.
4. General Settings
Session Drawing Limit: This is your master history control. It sets how many past days of drawings (for Killzones, Opening Ranges, etc.) will be kept on your chart. A lower number improves performance.
Timeframe Limit: To keep your chart clean, drawings will not appear on timeframes greater than or equal to the one you select here.
Label Size / Text Color: Controls the appearance of all text and labels drawn by the indicator.

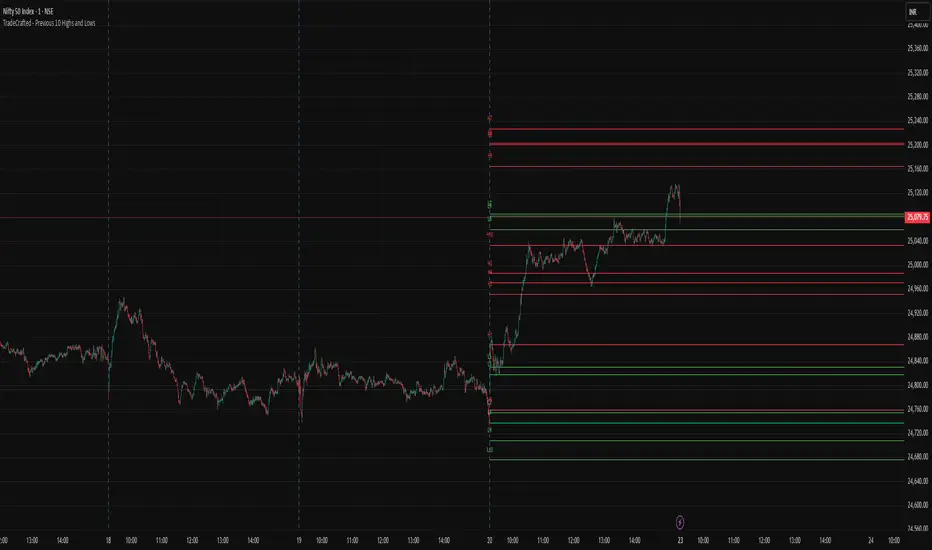
TradeCrafted - Previous 10 Highs and LowsUnlock the power of historical price action with the 10-Day Highs & Lows Indicator! This innovative tool analyzes the highest and lowest price levels of the past 10 trading days and projects them as fixed lines onto the current session. By plotting these crucial support and resistance levels, traders gain a clear visual edge to anticipate market reactions, trend reversals, and breakout opportunities.
🔥 Key Features:
✅ Precision Levels – Automatically plots the previous 10 days' highs and lows for accurate decision-making.
✅ Fixed Lines for Clarity – Levels remain unchanged throughout the session, providing a stable reference.
✅ Enhanced Market Structure Analysis – Identify key zones where price is likely to react.
✅ Ideal for All Traders – Whether you're a scalper, swing trader, or intraday enthusiast, these levels offer a strong foundation for your strategy.
🚀 Why Use This Indicator?
Markets move in cycles, and historical highs and lows act as magnets for price action. By integrating this tool into your trading arsenal, you can spot potential breakouts, retests, and reversals with greater confidence!
Elevate your technical analysis and trade smarter with the 10-Day Highs & Lows Indicator! 🔥
How to use : Trader Can take Buy entry if price is near line and taking reversal from it so it will be very good for trader to manage the stop loss. Simply if it goes below the line, just cut the trade to avoid unnecessary and huge loss. This Indicator will help Trader to take correct entry and exit.
Hope my effort will help trader to stay in profit.
QQQ NQ NDX SPY SPX ES Price Convert Overlay
_____________________________________________________________________
QQQ NQ NDX SPY SPX ES Price Convert Overlay Indicator
____________________
This 'Prices Overlay' indicator is a minimalist tool for traders who want to track and compare Nasdaq and S&P 500 instruments quickly and clearly, boosting efficiency and decision-making with minimal distraction.
How to Use It
____________________
Add the indicator onto your TradingView chart.
Adjust your Right Margin in TradingView Settings > Canvas to show as much or as little of the line as you want, based on the "Price Buffer" indicator setting.
Select which instruments to overlay (e.g., QQQ, SPX).
Adjust levels, buffer, font, transparency, and update interval.
Features and Functions
____________________
1. Automatic Ticker Detection:
The indicator identifies the ticker of your current chart (e.g., NQ, ES, SPY).
It then shows price levels for related instruments, eg:
On an NQ or MNQ chart, it can display QQQ or NDX levels.
On an ES or MES chart, it can display SPY or SPX levels.
...and vice versa
2. Adjustable Number of Levels
You can choose how many price levels to show, from 10 to 100.
This lets you decide how much detail you want based on your trading needs.
3. Visual Customization
Price Buffer: Move the lines and labels horizontally closer/further price action.
Font Size: Pick from "Tiny," "Small," or "Normal" for label text size.
Line Transparency: Adjust the opacity of the lines (0% = solid, 100% = invisible) to blend them with your chart.
4. Support for Micro Futures
Works with both regular futures (NQ, ES) and micro futures (MNQ, MES), perfect for traders using smaller contract sizes.
5. Update Frequency
Set how often the price levels refresh, from every 5 seconds to every 60 seconds.
This keeps the data current without slowing down your chart.
6. Accurate Price Conversion
Uses specific multipliers for each instrument (e.g., 100.0 for NDX and SPX, 1.0 for QQQ and SPY) to calculate and display price levels correctly.
Fetches real-time prices and converts them to match your chart’s scale.
Price conversions courtesy of PtGambler.
Benefits
____________________
Easier Analysis: See how prices from different instruments line up on one chart—no need for multiple screens or math.
Customizable: Turn on/off instruments and tweak visuals to fit your trading style.
Time-Saving: Automates price conversions, letting you focus on trading decisions.
Thanks!
____________________
Thank you for your interest in my work. This is something I use every day for my trading and wanted to share it with the public. If you have any comments, bugs, or suggestions, please leave them here, or you can find me on Twitter or Discord.
@ ContrarianIRL
Open-source developer for over 25 years

Prev Week POC Buy/Sell Signals
Hi, I’m Edward. I created a straightforward strategy for swing traders (4hr or 8hr timeframe users). This strategy is for traders that are not interested to look at charts all day long, 2 times a day max, but still be profitable.
The indicator:
Print a buy signal when the price closes above the previous week's Point of Control (POC).
Stay in the trade until the price closes below the previous week's POC, then print a sell signal.
The indicator calculates the weekly POC using a basic volume profile method, then tracks the previous week's POC for signals.
Previous week POC is valid from Monday to Thursday. By close of business on Thursday, the current week trend and POC should be well established and should be used make buy or sell decisions. Enjoy!

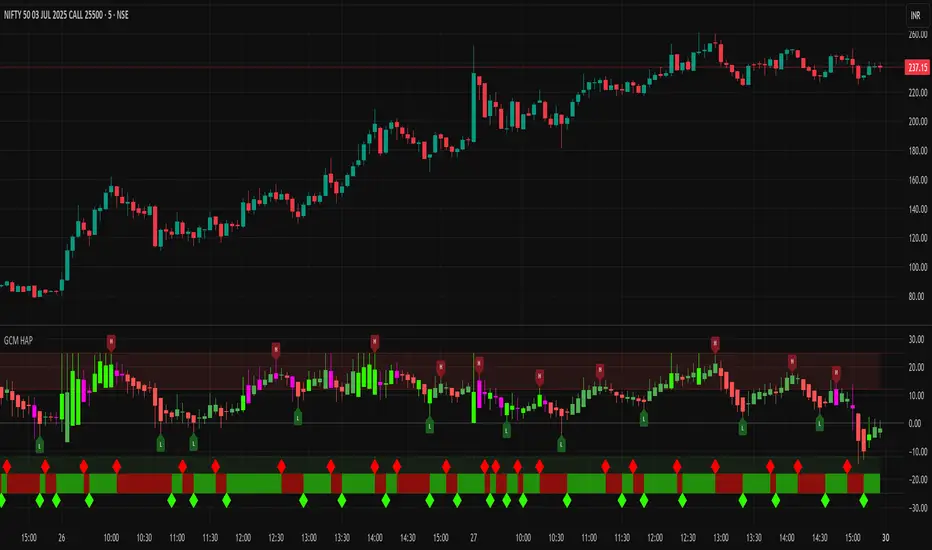
GCM Heikin Ashi with PivotsTitle: GCM Heikin Ashi with Pivots
Description:
Overview
This indicator provides a powerful combination of trend visualization, precise reversal signals, and volume confirmation in a clean, customizable sub-chart. It is designed to help traders identify trend momentum using Heikin Ashi candles, pinpoint confirmed swing highs and lows (pivots), and spot surges in buying pressure with our unique Volume Rate-of-Change (VROC) highlighter.
The key feature of this script is its non-repainting pivot signals. A pivot high or low is only confirmed and plotted after a specific number of subsequent bars have closed, ensuring the signals are reliable and do not change after they appear.
Key Features
Heikin Ashi Sub-Chart: Displays smoothed Heikin Ashi candles in a separate pane to clearly visualize trend strength and direction without cluttering the main price chart.
Non-Repainting Pivot Signals: Uses ta.pivothigh and ta.pivotlow to identify confirmed swing points. The signals will not repaint or move once they are printed on the chart.
Smart Volume Spike Analysis (VROC): A Heikin Ashi candle will be highlighted in a distinct bright green (#2dff00) when the volume increases significantly on a bullish price candle. This "volume-confirmed" candle can signal strong conviction behind a move.
Complete Label Customization: Take full control over the look and feel of your signals:
Label Mode: Choose between "High & Low" (H/L) or "Buy & Sell" (B/S) to match your trading terminology.
Custom Colors: Set unique colors for both the high and low pivot labels.
Label Style: Select from various shapes like boxes, circles, diamonds, or squares.
Label Size: Adjust the size of the labels from Tiny to Huge for perfect visibility.
Adjustable Pivot Sensitivity: Fine-tune the pivot detection algorithm by setting the number of bars required to the left (strength) and right (confirmation) of a pivot point.
How to Use & Interpret the Signals
Assess the Trend with Heikin Ashi:
A series of green HA candles with little to no lower wicks indicates strong bullish momentum.
A series of red HA candles with little to no upper wicks indicates strong bearish momentum.
Look for Volume Confirmation:
A bright green highlighted candle signals a surge in buying pressure (VROC spike). This adds significant weight to bullish moves and can act as a leading indicator for a new leg up.
Identify Entry/Exit Points with Pivot Labels:
An "L" or "B" label marks a confirmed swing low. This is a potential buying opportunity, especially if it is followed by green Heikin Ashi candles and, ideally, a bright green VROC spike candle.
An "H" or "S" label marks a confirmed swing high. This is a potential selling/shorting opportunity, especially as HA candles turn red.
Example Strategy (High-Confluence)
A powerful way to use this indicator is to look for a sequence of events:
Wait for a "Buy" (B) or "Low" (L) signal to appear, confirming a bottom has likely formed.
Wait for the first bright green VROC spike candle to appear after the signal. This confirms that buyers are stepping in with conviction.
Consider an entry based on this high-confluence setup, using the swing low as a potential stop-loss area.
Settings Explained
Pivot Detection:
Left Bars (Strength): Number of bars to the left of a pivot. A higher number finds more significant pivots.
Right Bars (Confirmation): Number of bars to the right required to confirm a pivot. This creates a lag for reliability.
Volume Spike Detection (VROC):
Enable Volume Spike Highlighting: Turn the bright green candle highlight on or off.
VROC Length: The lookback period for calculating the volume's rate of change.
VROC Threshold %: The percentage volume must increase to trigger a highlight.
Label Customization:
Label Text Mode: Choose between "High & Low" or "Buy & Sell".
Label Color, Style, and Size: Full cosmetic control for the pivot labels.
Final Note
This indicator is a tool to aid in technical analysis and should not be used as a standalone trading system. Always use it in conjunction with other analysis methods, proper risk management, and a sound trading plan.
Enjoy!