GibbsFunctional Categories
Time Management
Timezone Settings: Configurable to adjust for different global time zones (e.g., GMT, GMT+1).
Daily and Weekly Resets: Functions to detect new days and weeks, used to mark specific periods on the chart.
Session Range Calculation: Ability to determine timeframes in minutes, hours, days, weeks, and months for precise market analysis.
Day and Week Separators
Daily Separators: Option to display daily separators that demarcate different trading days on the chart.
Weekends Highlight: Automatically grays out weekends for easy visual distinction.
Trading Sessions
Custom Sessions: Display trading sessions, such as:
Kill Zones: Morning and afternoon trading zones with customizable time ranges and background highlights.
Asian Session: Highlights the Asian market hours with liquidity data.
Session Background: Customizable colors for different sessions to visually separate them on the chart.
Liquidity Management
High and Low Points: Tracks previous day and week high/low prices, marking them for reference.
Labeling: Uses labels and lines to indicate if significant liquidity levels have been breached.
Session Liquidity: Identifies areas where liquidity is likely to accumulate, marking high and low ranges for Asian, CBDR, and other sessions.
Session-Specific Features
CBDR (Central Bank Dealers Range): Marks specific ranges based on sessions relevant for market analysis.
Range Projections: Projects key levels based on the size of the CBDR range for additional price targets.
Previous Day CBDR: Option to display CBDR from the previous day, aiding in historical price movement analysis.
Header and Display Customization
Header Text: Customizable text for the indicator's header to provide a quick reference.
Table Management: Simple table for organizing and displaying important textual information.
This indicator is ideal for traders who focus on session-based strategies and wish to have comprehensive visibility of previous liquidity points, trading zones, and day/week high and low levels on their charts.
Educational
3 CANDLE SUPPLY/DEMANDExplanation of the Code:
Demand Zone Logic: The script checks if the second candle closes below the low of the first candle and the third candle closes above both the highs of the first and second candles.
Zone Plotting: Once the pattern is identified, a demand zone is plotted from the low of the first candle to the high of the third candle, using a dashed green line for clarity.
Markers: A small triangle marker is added below the bars where a demand zone is detected for easy visualization.
Efficient Logic: The script checks the conditions for demand zone formation for every three consecutive candles on the chart.
This approach should be both accurate and efficient in plotting demand zones, making it easier to spot potential support levels on the chart.

ICT Setup 02 [TradingFinder] Breaker Blocks + Reversal Candles🔵 Introduction
The "Breaker Block" concept, widely utilized in ICT (Inner Circle Trader) technical analysis, is a crucial tool for identifying reversal points and significant market shifts. Originating from the "Order Block" concept, Breaker Blocks help traders pinpoint support and resistance levels. These blocks are essential for understanding market trends and recognizing optimal entry and exit points.
A Breaker Block is essentially a failed Order Block that changes its role when price action breaks through it. When an Order Block fails to hold as a support or resistance level, it reverses its function, becoming a Breaker Block.
There are two primary types : Bullish Breaker Blocks and Bearish Breaker Blocks. These Breaker Blocks align with the prevailing market trend and indicate potential entry points after a liquidity sweep or a shift in market structure.
Understanding and applying the Breaker Block strategy enables traders to capitalize on the behavior of institutional investors, enhancing their trading outcomes.
Bullish Setup :
Bearish Setup :
🔵 How to Use
The ICT Setup 02 indicator designed to automate the identification of Bullish and Bearish Breaker Blocks. This tool enables traders to easily spot these blocks on a chart and utilize them for entering or exiting trades. Below is a breakdown of how to use this indicator in both bullish and bearish setups.
🟣 Bullish Breaker Block Setup
A Bullish Breaker Block setup is identified in an uptrend, where it serves as a potential entry point. This setup occurs when a Bearish Order Block fails and the price moves above the high of that Order Block. In this scenario, the previously bearish Order Block turns into a Bullish Breaker Block, which now acts as a support level for the price.
To trade a Bullish Breaker Block, wait for the price to retest this newly formed support level. Confirmation of the uptrend can be achieved by analyzing lower time frames for further market structure shifts or other bullish indicators.
A successful retest of the Bullish Breaker Block provides a high-probability entry point for a long trade, as it signals institutional support. Traders often place their stop-loss below the low of the Breaker Block zone to minimize risk.
🟣 Bearish Breaker Block Setup
A Bearish Breaker Block setup, conversely, is used in a downtrend to identify potential sell opportunities. This setup forms when a Bullish Order Block fails, and the price moves below the low of that Order Block.
Once this Order Block is broken, it reverses its role and becomes a Bearish Breaker Block, providing resistance to the price as it pushes downward. For a Bearish Breaker Block trade, wait for the price to retest this resistance level.
A confirmation of the downtrend, such as a market structure shift on a lower time frame or additional bearish signals, strengthens the setup. The Bearish Breaker Block retest provides an opportunity to enter a short position, with a stop-loss placed just above the high of the Breaker Block zone.
🔵 Settings
Pivot Period : This setting controls the look-back period used to identify pivot points that contribute to the detection of Order Blocks. A higher period captures longer-term pivots, while a lower period focuses on more recent price action. Adjusting this parameter allows traders to fine-tune the indicator to match their trading time frame.
Breaker Block Validity Period : This setting defines how long a Breaker Block remains valid based on the number of bars elapsed since its formation. Increasing the validity period keeps Breaker Blocks active for a longer duration, which can be useful for higher time frame analysis.
Mitigation Level BB : This option lets traders choose the level of the Order Block at which the price is expected to react. Options like "Proximal," "50% OB," and "Distal" adjust the zone where a reaction may occur, offering flexibility in setting up the entry and stop-loss levels.
Breaker Block Refinement : The refinement option refines the Breaker Block zone to display a more precise range for aggressive or defensive trading approaches. The "Aggressive" mode provides a tighter range for risk-tolerant traders, while the "Defensive" mode expands the zone for those with a more conservative approach.
🔵 Conclusion
The Breaker Block indicator provides traders with a sophisticated tool for identifying key reversal zones in the market. By leveraging Breaker Blocks, traders can gain insights into institutional order flow and predict critical support and resistance levels.
Using Breaker Blocks in conjunction with other ICT concepts, like Fair Value Gaps or liquidity sweeps, enhances the reliability of trading signals. This indicator empowers traders to make informed decisions, aligning their trades with institutional moves in the market.
As with any trading strategy, it is crucial to incorporate proper risk management, using stop-losses and position sizing to minimize potential losses. The Breaker Block strategy, when applied with discipline and thorough analysis, serves as a powerful addition to any trader’s toolkit.

MACD Histogram Fibonacci Retracement LevelsMACD Histogram Fibonacci Retracement Level s.
MACD Histogram Fibonacci Retracement Levels indicator considers the highest and lowest histogram bar levels from Intraday Day Open.
Fibonacci retracement levels 23.6%, 38.2%, 50%, 61.8%, and 78.6% are displayed for the Highest and Lowest histogram bar .As the day progress revised Fibonacci Retracement Levels are set in based on change in Highest and Lowest histogram bar levels.
Histogram bars positions are monitored vis a vis the Fibonacci Retracement Levels to plan the trade entry or exit as per MACD indicator.
MACD and Signal levels are opted out to get clear histogram bar image on chart. Input check in box is available to display MACD and signal lines at Users option.
A Histogram intraday average line (Histo Intra Avg) indicate the intraday average movement of histogram bars.
MACD Histogram Fibonacci Retracement Levels is very useful to know the level of upward and downward Histogram bar movements vis a vis Fibonacci Retracement Levels compared to general MACD Indicator Histogram levels.
DISCLAIMER: For educational and entertainment purpose only .Nothing in this content should be interpreted as financial advice or a recommendation to buy or sell any sort of security/ies or investment/s.

Dynamic Linear CandlesDynamic Linear Candles is a unique and versatile indicator that reimagines traditional candlestick patterns by integrating customizable moving averages directly into candle structures. This dynamic approach smooths the appearance of candlesticks to better highlight trends and suppress minor market noise, allowing traders to focus on essential price movements.
Key Features:
1. Dynamic Candle Smoothing: Choose between popular smoothing types (SMA, EMA, WMA, HMA) to apply directly to each candle’s Open, High, Low, and Close values. This adaptive smoothing reveals hidden trends by refining price action into simplified, flowing candles, ideal for spotting subtle changes in market sentiment.
2. Signal Line Overlay: The signal line provides an additional layer of trend confirmation. Select from SMA, EMA, WMA, or HMA smoothing to match your trading style. The line dynamically changes color based on the price’s relative position, helping traders quickly identify bullish or bearish shifts.
3. Enhanced Candle Visualization: Candles adjust in color and opacity based on bullish or bearish trends, providing immediate visual cues about market momentum. The customized color and opacity settings allow for clearer distinction, especially in noisy markets.
Why This Combination?
This script is more than just an aesthetic adjustment; it’s a purposeful combination of moving averages and candle smoothing designed to enhance readability and actionable insights. Traditional candles often suffer from excessive noise in volatile markets, and this mashup addresses that by creating a smooth, flowing chart that adapts to the underlying trend. The Signal Line adds confirmation, acting as a filter for potential entries and exits. Together, these elements serve as a concise toolset for traders aiming to capture trend-based opportunities with clarity and precision.

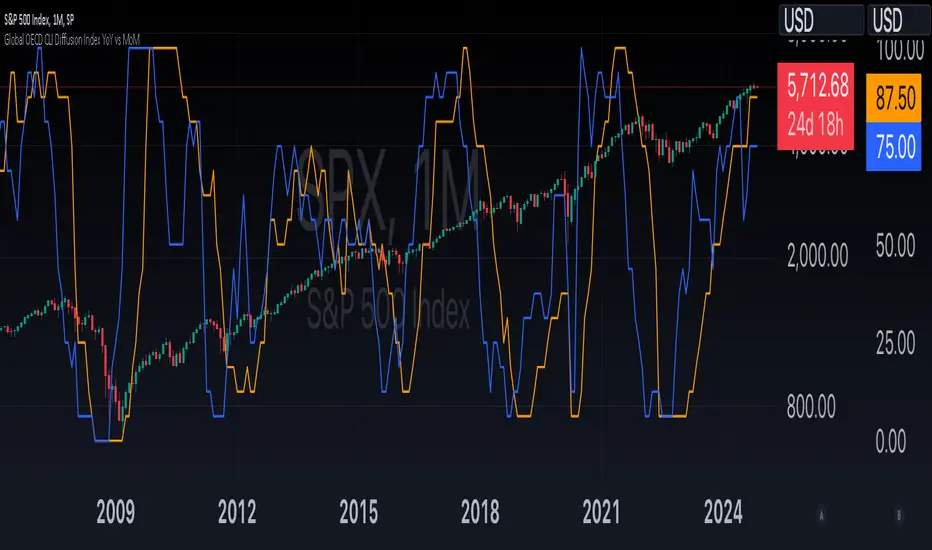
Global OECD CLI Diffusion Index YoY vs MoMThe Global OECD Composite Leading Indicators (CLI) Diffusion Index is used to gauge the health and directional momentum of the global economy and anticipate changes in economic conditions. It usually leads turning points in the economy by 6 - 9 months.
How to read: Above 50% signals economic expansion across the included countries. Below 50% signals economic contraction.
The diffusion index component specifically shows the proportion of countries with positive economic growth signals compared to those with negative or neutral signals.
The OECD CLI aggregates data from several leading economic indicators including order books, building permits, and consumer and business sentiment. It tracks the economic momentum and turning points in the business cycle across 38 OECD member countries and several other Non-OECD member countries.
CCI Threshold StrategyThe CCI Threshold Strategy is a trading approach that utilizes the Commodity Channel Index (CCI) as a momentum indicator to identify potential buy and sell signals in financial markets. The CCI is particularly effective in detecting overbought and oversold conditions, providing traders with insights into possible price reversals. This strategy is designed for use in various financial instruments, including stocks, commodities, and forex, and aims to capitalize on price movements driven by market sentiment.
Commodity Channel Index (CCI)
The CCI was developed by Donald Lambert in the 1980s and is primarily used to measure the deviation of a security's price from its average price over a specified period.
The formula for CCI is as follows:
CCI=(TypicalPrice−SMA)×0.015MeanDeviation
CCI=MeanDeviation(TypicalPrice−SMA)×0.015
where:
Typical Price = (High + Low + Close) / 3
SMA = Simple Moving Average of the Typical Price
Mean Deviation = Average of the absolute deviations from the SMA
The CCI oscillates around a zero line, with values above +100 indicating overbought conditions and values below -100 indicating oversold conditions (Lambert, 1980).
Strategy Logic
The CCI Threshold Strategy operates on the following principles:
Input Parameters:
Lookback Period: The number of periods used to calculate the CCI. A common choice is 9, as it balances responsiveness and noise.
Buy Threshold: Typically set at -90, indicating a potential oversold condition where a price reversal is likely.
Stop Loss and Take Profit: The strategy allows for risk management through customizable stop loss and take profit points.
Entry Conditions:
A long position is initiated when the CCI falls below the buy threshold of -90, indicating potential oversold levels. This condition suggests that the asset may be undervalued and due for a price increase.
Exit Conditions:
The long position is closed when the closing price exceeds the highest price of the previous day, indicating a bullish reversal. Additionally, if the stop loss or take profit thresholds are hit, the position will be exited accordingly.
Risk Management:
The strategy incorporates optional stop loss and take profit mechanisms, which can be toggled on or off based on trader preference. This allows for flexibility in risk management, aligning with individual risk tolerances and trading styles.
Benefits of the CCI Threshold Strategy
Flexibility: The CCI Threshold Strategy can be applied across different asset classes, making it versatile for various market conditions.
Objective Signals: The use of quantitative thresholds for entry and exit reduces emotional bias in trading decisions (Tversky & Kahneman, 1974).
Enhanced Risk Management: By allowing traders to set stop loss and take profit levels, the strategy aids in preserving capital and managing risk effectively.
Limitations
Market Noise: The CCI can produce false signals, especially in highly volatile markets, leading to potential losses (Bollinger, 2001).
Lagging Indicator: As a lagging indicator, the CCI may not always capture rapid market movements, resulting in missed opportunities (Pring, 2002).
Conclusion
The CCI Threshold Strategy offers a systematic approach to trading based on well-established momentum principles. By focusing on overbought and oversold conditions, traders can make informed decisions while managing risk effectively. As with any trading strategy, it is crucial to backtest the approach and adapt it to individual trading styles and market conditions.
References
Bollinger, J. (2001). Bollinger on Bollinger Bands. New York: McGraw-Hill.
Lambert, D. (1980). Commodity Channel Index. Technical Analysis of Stocks & Commodities, 2, 3-5.
Pring, M. J. (2002). Technical Analysis Explained. New York: McGraw-Hill.
Tversky, A., & Kahneman, D. (1974). Judgment under uncertainty: Heuristics and biases. Science, 185(4157), 1124-1131.

US Presidents with Market Returns by Party (1910s-Present)Colored background for presidents by party affiliation with table displaying market returns for each US president and sum of total returns by party.

Weekly Range & Trend (Signed)Weekly Trend & Range is basically calculated every week.
It helps to get a broad idea whether coming week market can be directional , volatile or range bound action. So this helps me to get a hint which style of approach should be given more important on positional basis like directional or non-directional.
I mostly track in NSE:BANKNIFTY , NSE:NIFTY , BSE:SENSEX
For example:
Average range difference of past 4 weeks is bigger in compare to current week range difference means good chance for directional opportunities.
Average range difference of past 4 weeks is lesser in compare to current week range difference means good chance for non-directional opportunities.
Directional or Non-directional hint is been shown in terms of probability . So based on this i plan my week and trades.

Implied Fair Value Gap (IFVG) ICT [TradingFinder] Hidden FVG OTE🔵 Introduction
The Implied Fair Value Gap (IFVG) is distinctive due to its unique three-candlestick formation, which differentiates it from conventional Fair Value Gaps.
Implied fair value represents an estimated worth of an asset—often a business or its goodwill—based on the price likely to be received in a structured transaction between market participants at a specific point in time.
In the ever-evolving world of technical analysis, pinpointing price reversal points and market anomalies can significantly enhance trading strategies and decision-making for traders and investors. Among the advanced concepts gaining traction in this field is the Implied Fair Value Gap (IFVG), introduced by the renowned analyst Inner Circle Trader (ICT).
This tool has proven to be an effective method for identifying hidden supply and demand zones in financial markets, offering a unique edge to traders looking for high-probability setups.
Unlike traditional gaps that are visible on price charts, IFVG is a hidden gap that doesn’t appear explicitly on the chart and thus requires specialized technical analysis tools for accurate identification.
This hidden gap can signal potential price reversals and offers traders insight into high-liquidity areas where price is likely to react. This article will guide you through using the ICT Implied Fair Value Gap Indicator effectively, covering its settings, usage strategies, and key features to help you make informed decisions in the market.
🟣 Bullish Implied FVG
🟣 Bearish Implied FVG
🔵 How to Use
The IFVG indicator is designed to assist traders in recognizing hidden support and resistance zones by identifying Bullish and Bearish IFVG patterns. With this tool, traders can make better-informed decisions about suitable entry and exit points for their trades based on these patterns.
🟣 Bullish Implied Fair Value Gap
This pattern occurs in an uptrend when a large bullish candlestick forms, with the wicks of the previous and following candles overlapping the body of the central candlestick.
This overlap creates a demand zone or a hidden support level, which can act as an ideal entry point for buy trades. Often, when the price returns to this area, it is likely to resume its upward trend, presenting a profitable buying opportunity.
🟣 Bearish Implied Fair Value Gap
This pattern is similar but forms in downtrends. Here, a large bearish candlestick appears on the chart, with the wicks of adjacent candles overlapping its body. This overlap defines a supply zone or a hidden resistance level and serves as a signal for potential sell trades.
When the price returns to this zone, it often continues its downward trend, providing an optimal point for entering sell trades.
The IFVG indicator also includes various filters that traders can use to refine their analysis based on market conditions. These filters, including Very Aggressive, Aggressive, Defensive, and Very Defensive, allow users to customize the IFVG zones' width, offering flexibility according to the trader’s risk tolerance and trading style.
🟣 Example Trading Scenarios
Suppose you’re in a strong uptrend and the IFVG indicator identifies a Bullish IFVG zone. In this scenario, you could consider entering a buy trade when the price retraces to this zone, expecting the uptrend to resume. Conversely, in a downtrend, a Bearish IFVG zone can signal a favorable entry point for short trades when the price revisits this area.
🔵 Settings
Implied Block Validity Period: This parameter specifies the validity period of each identified block, taking into account the number of bars that have passed since its formation. Proper adjustment of this period helps traders focus only on relevant zones, increasing the accuracy of the analysis.
Mitigation Level OB : This option defines the mitigation level for supply and demand blocks (Order Blocks), with settings including Proximal, 50% OB, and Distal.
Depending on the selected level, the indicator will focus on closer, mid-range, or farther points for block identification, allowing traders to adjust for the level of precision required.
Implied Filter : Activating this filter allows traders to apply conditions based on the width of the IFVG zones. With options like Very Aggressive and Very Defensive, traders can control the width of IFVG zones to suit their risk management strategy—whether they prefer high-risk setups or low-risk setups.
Display and Color Settings : This section enables users to customize the appearance of the IFVG zones on their charts. Traders can set different colors for Bullish and Bearish zones, allowing for easier distinction and improved visualization.
Alert Settings : One of the standout features of the IFVG indicator is the alert system. By setting up alerts, users can be notified whenever the price approaches a demand or supply zone.
Alerts can be customized to trigger Once Per Bar (one alert per bar) or Per Bar Close (alert at the close of each bar), ensuring that traders stay updated on critical price movements without needing to monitor the chart continuously.
🔵 Conclusion
The ICT Implied Fair Value Gap (IFVG) indicator is a powerful and sophisticated tool in technical analysis, allowing professional traders to identify hidden supply and demand zones and use them as entry and exit points for buy and sell trades.
This indicator’s automatic detection of IFVG zones helps traders uncover hidden trading opportunities that can enhance their analysis.
While the IFVG indicator offers numerous advantages, it is important to use it in conjunction with other technical analysis tools and sound risk management practices.
IFVG alone does not guarantee profitability in trading; it works best when combined with other indicators such as volume analysis and trend-following indicators for a comprehensive trading strategy.

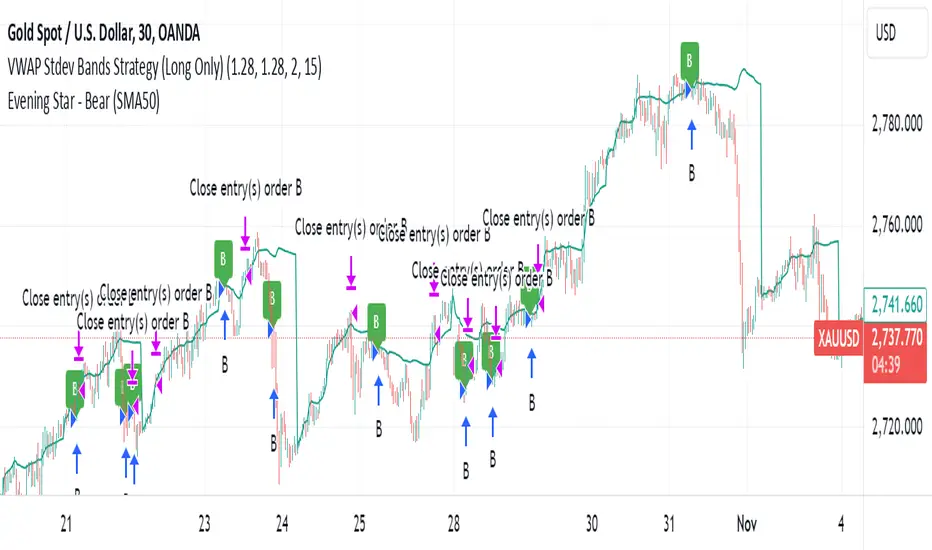
VWAP Stdev Bands Strategy (Long Only)The VWAP Stdev Bands Strategy (Long Only) is designed to identify potential long entry points in trending markets by utilizing the Volume Weighted Average Price (VWAP) and standard deviation bands. This strategy focuses on capturing upward price movements, leveraging statistical measures to determine optimal buy conditions.
Key Features:
VWAP Calculation: The strategy calculates the VWAP, which represents the average price a security has traded at throughout the day, weighted by volume. This is an essential indicator for determining the overall market trend.
Standard Deviation Bands: Two bands are created above and below the VWAP, calculated using specified standard deviations. These bands act as dynamic support and resistance levels, providing insight into price volatility and potential reversal points.
Trading Logic:
Long Entry Condition: A long position is triggered when the price crosses below the lower standard deviation band and then closes above it, signaling a potential price reversal to the upside.
Profit Target: The strategy allows users to set a predefined profit target, closing the long position once the specified target is reached.
Time Gap Between Orders: A customizable time gap can be specified to prevent multiple orders from being placed in quick succession, allowing for a more controlled trading approach.
Visualization: The VWAP and standard deviation bands are plotted on the chart with distinct colors, enabling traders to visually assess market conditions. The strategy also provides optional plotting of the previous day's VWAP for added context.
Use Cases:
Ideal for traders looking to engage in long-only positions within trending markets.
Suitable for intraday trading strategies or longer-term approaches based on market volatility.
Customization Options:
Users can adjust the standard deviation values, profit target, and time gap to tailor the strategy to their specific trading style and market conditions.
Note: As with any trading strategy, it is important to conduct thorough backtesting and analysis before live trading. Market conditions can change, and past performance does not guarantee future results.
Ido strategy RSI Oversold with MACD Buy Signal Indicator
This indicator combines the Relative Strength Index (RSI) and the Moving Average Convergence Divergence (MACD) to help identify potential buy signals based on oversold conditions and trend reversals. This script is designed for traders looking to identify entry points when an asset is likely undervalued (oversold) and showing bullish momentum.
How It Works
RSI Oversold Detection: The RSI measures the speed and change of price movements. This indicator flags when the RSI falls below 30, signaling that the asset may be oversold. The user can customize the RSI lookback period and the timeframe within which oversold conditions are considered relevant.
MACD Crossover: The MACD line crossing above the Signal line often indicates a shift to bullish momentum. In this script, a buy signal is generated when a MACD bullish crossover occurs after an RSI oversold condition has been met within a user-defined lookback window.
Buy Signal: A green triangle appears below the price chart each time both conditions are met—when the RSI has recently been in oversold territory and the MACD line crosses above the Signal line. This signal suggests that the asset may be positioned for a potential upward trend, providing a visual cue for entry points.
Customizable Settings
RSI Settings: Adjust the RSI source and period length.
MACD Settings: Customize the fast, slow, and signal lengths of the MACD to suit different market conditions.
Lookback Period: Define how many bars back to check for an RSI oversold condition before confirming a MACD crossover.
Visual Elements
Oversold Background Color: The background on the price chart is shaded red whenever the RSI is below 30.
Buy Signal: A green triangle is displayed on the chart to indicate a potential entry point when both conditions are met.
Alerts
This indicator includes optional alerts, allowing traders to receive notifications whenever the conditions for a buy signal are met, making it easier to monitor multiple assets and stay informed of trading opportunities.
This indicator is ideal for traders using a combination of momentum and trend reversal strategies, especially in volatile markets where oversold conditions often precede a trend change.
Cumulative Volume Delta Custom AlertDescription
This script calculates and visualizes the Cumulative Volume Delta (CVD) on multiple timeframes, enabling traders to monitor volume-based price action dynamics. The CVD is calculated based on up and down volume approximations and displayed as a candle plot, with color-coded alerts when significant changes occur.
Key Features:
Multi-Timeframe Analysis: The script uses a customizable anchor period and a lower timeframe for scanning, allowing it to capture more granular volume movements.
Volume-Based Trend Detection: Plots CVD candles with color indicators (teal for increasing volume delta, red for decreasing), helping traders to visually track volume trends.
Dynamic Alerts for Volume Shifts:
Triggers an alert when there is a significant (over 25%) change in CVD between consecutive periods.
The alert marker color adapts based on the current CVD value:
Blue when the current CVD is positive.
Yellow when the current CVD is negative.
Markers are placed above bars for volume increases and below for volume decreases, simplifying visual analysis.
Customizable Background Highlight: Adds a background highlight to emphasize significant CVD changes.
Use Cases:
Momentum Detection: Traders can use alerts on large volume delta changes to identify potential trend reversals or continuation points.
Volume-Driven Analysis: CVD helps distinguish buy and sell pressure across different timeframes, ideal for volume-based strategies.
How to Use
Add the script to your TradingView chart.
Configure the anchor and lower timeframes in the input settings.
Set up alerts to receive notifications when a 25% change in CVD occurs, with color-coded markers for easy identification.

Silen's EMA AreasAre you tired of reading candles? 🧨 Do you want to bring more meaning to your chart? 🧹
Then this is the script for you!
This script does:
- Add several meaningfully pre-configured EMA lines to your chart - up to EMA 300
- Colors the areas between EMA lines in 3d colors - green and red
- The Smaller the EMA, the firmer the color
- Highlights the EMA 300 in a golden color
What is the meaning of this?
Let me introduce a new word to you: EMA FOLDING .
Yes, you heard right. With this indicator you can see in 3D how EMA lines are folding above and below each other, indicating severe mood swings in the chart.
This helps you keep track of what your instrument is actually doing while it enables you to cancel out the noise and messyness of ordinary candles which can be quite random and hard to read.
Once an EMA is fully positive or negatively folded (all ema lines are green and above each other from largest EMA to smallest EMA and vice versa for negatively folded) you can be sure that you are in a Trend or certain mood (for higher timeframes, from 15mins on).
I don't ever want to read any chart without having this indicator on. Whenever I present charts to anybody I use this indicator - and the feedback is insanely positive. People tend to read and understand charts much better with this indicator than just staring at candles.
Why is this indicator different to other EMA indicators and should thereby not be deleted by the TradingView Team due to redundance with other EMA indicators?
- This is not a simple indicator for EMAs
- Rather, this is an indicator to better and easier read the whole chart
- You can detect mood swings very easily which is very hard to do with a normal EMA indicator
- I haven't found any EMA indicator on TradingView that does this job so i sincerely believe it is extremely unique
- I sincerely believe it can help people get a much better understanding of charts without actualy getting into details of EMA's or even needing to know what an EMA is.
This indicator isn't intended for trading purposes, rather it is intended to give you a better and easier understanding of the chart. Of course - you can also use it for your trading but like I said, that is not the primary intended purpose.
This indicator comes pre-configured with quite optimal values (in my opinion) but of course can be fully customized. 🧮
Test it for yourself!
Dual Momentum StrategyThis Pine Script™ strategy implements the "Dual Momentum" approach developed by Gary Antonacci, as presented in his book Dual Momentum Investing: An Innovative Strategy for Higher Returns with Lower Risk (McGraw Hill Professional, 2014). Dual momentum investing combines relative momentum and absolute momentum to maximize returns while minimizing risk. Relative momentum involves selecting the asset with the highest recent performance between two options (a risky asset and a safe asset), while absolute momentum considers whether the chosen asset has a positive return over a specified lookback period.
In this strategy:
Risky Asset (SPY): Represents a stock index fund, typically more volatile but with higher potential returns.
Safe Asset (TLT): Represents a bond index fund, which generally has lower volatility and acts as a hedge during market downturns.
Monthly Momentum Calculation: The momentum for each asset is calculated based on its price change over the last 12 months. Only assets with a positive momentum (absolute momentum) are considered for investment.
Decision Rules:
Invest in the risky asset if its momentum is positive and greater than that of the safe asset.
If the risky asset’s momentum is negative or lower than the safe asset's, the strategy shifts the allocation to the safe asset.
Scientific Reference
Antonacci's work on dual momentum investing has shown the strategy's ability to outperform traditional buy-and-hold methods while reducing downside risk. This approach has been reviewed and discussed in both academic and investment publications, highlighting its strong risk-adjusted returns (Antonacci, 2014).
Reference: Antonacci, G. (2014). Dual Momentum Investing: An Innovative Strategy for Higher Returns with Lower Risk. McGraw Hill Professional.

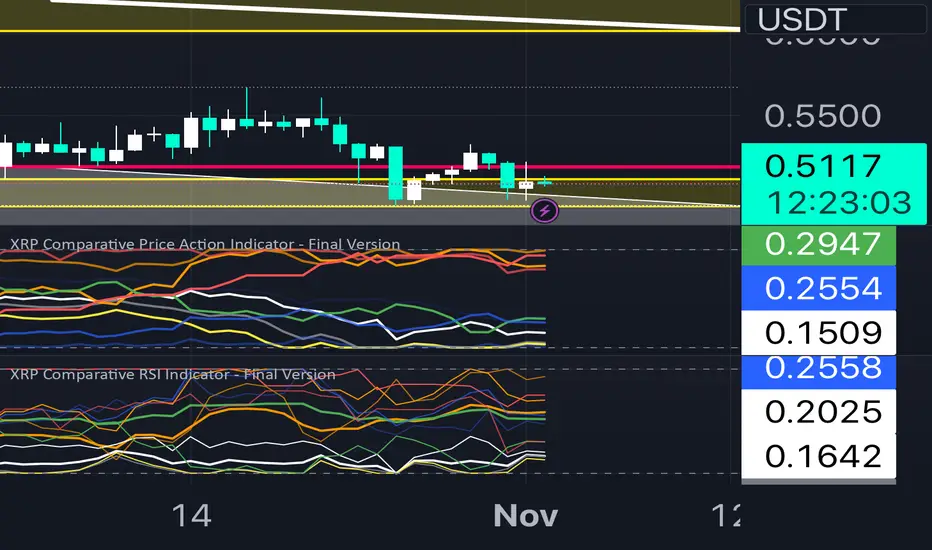
XRP Comparative RSI Indicator - Final VersionXRP Comparative RSI Indicator - Final Version
The XRP Comparative RSI Indicator offers a dynamic analysis of XRP’s market positioning through relative strength index (RSI) comparisons across various cryptocurrencies and major market indicators. This indicator allows traders and analysts to gauge XRP’s momentum and potential turning points within different market conditions.
Key Features:
• Normalized RSIs: Each RSI value is normalized between 0.00 and 1.00, allowing seamless comparison across multiple assets.
• Grouped Analysis: Three RSI groups provide specific insights:
• Group 1 (XRP-Specific): Measures XRPUSD, XRP Dominance (XRP.D), and XRP/BTC, focusing on XRP’s performance across different trading pairs.
• Group 2 (Market Influence - Bitcoin): Measures BTCUSD, BTC Dominance (BTC.D), and XRP/BTC, capturing the influence of Bitcoin on XRP.
• Group 3 (Liquidity Impact): Measures USDT Dominance (USDT.D), BTCUSD, and ETHUSD, evaluating the liquidity impact from key assets and stablecoins.
• Individual Asset RSIs: Track the normalized RSI for each specific pair or asset, including XRPUSD, BTCUSD, ETHUSD, XRP/BTC, BTC Dominance, ETH Dominance, and the S&P 500.
• Clear Color Coding: Each asset’s RSI is plotted with a unique color scheme, consistent with the first indicator, for easy recognition.
This indicator is ideal for identifying relative strengths, potential entry and exit signals, and understanding how XRP’s momentum aligns or diverges from broader market trends.