Live Price Watermark (Flashing Overlay)Displays the current price as a large, centered watermark directly on your chart. The text color updates dynamically:
- Green when price rises
- Red when price falls
- Translucent black when unchanged
Portfolio management

Multi-timeframe Spot ETH ETF flowsDescription of Multi-timeframe Spot ETH ETF Flows Pine Script
This Pine Script™ (version 6) creates a Multi-timeframe Spot ETH ETF Flows indicator to track and visualize net and cumulative capital flows for various Ethereum (ETH) Spot Exchange-Traded Funds (ETFs) listed on AMEX and NASDAQ. The script calculates up and down volume based on price movements in a lower timeframe, multiplies these by the average price (HLC3) for accuracy, and aggregates the data to display net and cumulative flows.
Key Features:
ETF List : Tracks nine ETH Spot ETFs (e.g., AMEX:ETHE, NASDAQ:ETHA, etc.).
Custom Timeframe Input : Allows users to override the default lower timeframe (automatically selected based on the chart’s timeframe) with a custom timeframe (default: 720 minutes). Higher timeframes provide more historical data but less precision.
Volume Analysis : Calculates positive (up) and negative (down) volume based on price movements (close vs. open or close vs. previous close) in the lower timeframe, weighted by the average price.
Net and Cumulative Flows :
Net flow is the sum of up and down volumes across all ETFs, displayed as colored columns (green for positive, red for negative, with transparency based on trend direction).
Cumulative flow is the running total of net flows since the ETFs' launch, plotted as a line. Visualization : Uses dynamic colors for net flow columns to indicate direction and strength, with a black line for cumulative flow.
Technical Details:
Data Retrieval : Uses request.security and request.security_lower_tf to fetch price and volume data from lower timeframes.
Array Processing : Sums up and down volume arrays to compute net flows for each ETF.
Auto Timeframe Switching : Selects an appropriate lower timeframe (e.g., 1-second for seconds-based charts, 5-minute for daily charts) unless a custom timeframe is specified.
Styling : Net flow is plotted as columns, with color intensity reflecting flow direction and trend continuity.
Purpose:
The indicator helps traders and investors monitor capital inflows and outflows for ETH Spot ETFs, providing insights into market sentiment and fund activity across multiple timeframes.
License : Mozilla Public License 2.0.

Turtle Trading Strategy (Simplified)This TradingView script is a powerful implementation of the classic Turtle Trading strategy, designed to help traders capitalize on significant market trends. Built using Pine Script, it can function as an indicator to highlight the specific entry and exit signals derived from the Turtle rules, or as a fully automated strategy to execute trades based on these signals. Users can fine-tune critical parameters like the lookback periods for breakouts and exits, enabling them to adapt the strategy to different market conditions and asset classes. The script leverages Pine Script's robust capabilities to accurately calculate and display the Turtle System's core logic, including position sizing based on volatility (ATR), providing a clear and systematic approach to trend-following directly on their TradingView charts.

[TCV] - Position Tool Position Tool by TheCryptoVizier is a trade-planning widget that lets you drop Entry, Take-Profit and Stop-Loss levels directly on the chart, instantly calculates risk-to-reward and position size, and shows only the numbers you actually need. It’s designed for traders who plan visually and don’t want to juggle spreadsheets or external calculators.
WHAT PROBLEM DOES IT SOLVE?
When you drag price levels on TradingView you still have to:
work out how many contracts / coins you can buy for a fixed $ risk,
check that your R:R is acceptable,
copy the final values somewhere else.
The Position Tool automates all of that inside the chart and keeps the screen clean.
HOW TO USE
Add the indicator to any chart.
Drag the blue (Entry), green (TP) and red (SL) lines to your desired levels.
Set your Risk in USDT and toggle the check-boxes to show / hide extra fields.
Read off the position size, risk and R:R in the corner table or copy the exact numbers from the Data Window.
Place your order with confidence – the maths is already done.
Whether you scalp lower-timeframes or swing trade higher ones, the Position Tool removes friction from trade preparation and lets you focus on execution.
KEY FEATURES
Drag-and-drop Entry / TP / SL lines – plan the trade visually.
Fixed-risk position sizing – enter how much you’re willing to lose in USDT (or account currency) and the script tells you the exact position value and quantity.
Live R-to-R ratio – instantly see whether the reward compensates the risk as you move levels.
Smart info panel – overlay table shows Entry, TP, SL, R:R and – optionally via check-boxes – position in USDT, position in $TICKER and risk in USDT. Hide what you don’t need.
Copy-ready Data Window values – the same numbers appear in TradingView’s Data Window, so you can click any cell to copy it straight to the clipboard.
----------
Disclaimer: This indicator is provided for educational purposes only. Trading involves substantial risk, and nothing here should be construed as financial advice or a recommendation to trade. Always do your own research and consult a qualified professional.

🧪 Yuri Garcia Smart Money Strategy FULL (Slope Divergence))📣 Yuri Garcia – Smart Money Strategy FULL
This is my private Smart Money Concept strategy, designed for my family and community to learn, trade, and grow sustainably.
🔑 How it works:
✅ Volume Cluster Zones: Automatically detects areas where strong buyers or sellers concentrate, acting as dynamic S/R levels.
✅ HTF Institutional Zones (4H): Higher timeframe trend filter ensures you’re always trading in the direction of major flows.
✅ Wick Pullback Filter: Confirms price rejects the zone, catching smart money traps and reversals.
✅ Cumulative Delta (CVD): Confirms whether buyers or sellers are truly in control.
✅ Slope-Based Divergence: Optional hidden divergence between price & CVD to spot reversals others miss.
✅ ATR Dynamic SL/TP: Adapts stop loss and take profit to live volatility with adjustable risk/reward.
🧩 Visual Markers Explained:
🟦 Blue X: Price inside HTF zone
🟨 Yellow X: Price inside Volume Cluster zone
🟧 Orange Circle: Wick pullback detected
🟥 Red Square: CVD confirms order flow strength
🔼 Aqua Triangle Up: Bullish slope divergence
🔽 Purple Triangle Down: Bearish slope divergence
🟢 Green Triangle Up: Final Long Entry confirmed
🔴 Red Triangle Down: Final Short Entry confirmed
⚡ Who is this for?
This strategy is best suited for traders who understand smart money concepts, order flow, and want an adaptive framework to trade major assets like BTC, Gold, SP500, NASDAQ, or FX pairs.
🔒 Important
Use responsibly, backtest extensively, and combine with solid risk management. This is for educational purposes only.
✨ Credits
Built with ❤️ by Yuri Garcia – dedicated to my family & community.
✅ How to use it
1️⃣ Add to chart
2️⃣ Adjust inputs for your asset & timeframe
3️⃣ Enable/disable slope divergence filter to match your style
4️⃣ Set your alerts with built-in conditions

Box Breakout EMA OI Strategy
🔹 Matching Tool for Order Flow Insight 🔹
This is a proprietary-level matching tool I designed to reverse-engineer order flow behavior in a way that’s clear, visual, and instantly actionable.
Rather than relying on traditional volume indicators or lagging signals, this tool reveals who is in control of the market in real time—buyers or sellers—using a unique algorithm built from the logic of professional order flow systems.
It’s an excellent companion for traders across forex, futures, options, commodities, and equities, and works seamlessly for both scalping and swing trading styles.
This tool is not just reactive—it’s strategically built to mirror institutional behavior, helping traders align their execution with the actual flow behind price moves. When paired with live order flow data (like we use in our community), it becomes a powerful real-time edge.

ParthFintech MARKETSParthFintech MARKETS
Session Mapping & Real-Time Countdown Indicator
Overview
ParthFintech MARKETS is a lightweight, fully on-chart Pine Script indicator that:
Automatically detects your chart’s timezone
Shades each of the four major FX sessions (Tokyo, London, New York, Sydney) in muted background colors
Highlights the currently active session with a soft green overlay
Displays a live countdown label showing time remaining until the end of the current session—or, if markets are closed, until the next session opens
Whether you trade forex, indices or commodities, this tool gives you instant visual context around session openings and closings—so you can better plan entries, exits and high-volatility news events.
---
🚀 Key Features
Auto-Timezone: All session times (Tokyo 00:00–09:00, London 08:00–17:00, New York 13:00–22:00, Sydney 22:00–06:00) are calculated in your chart’s local timezone—no manual offsetting required.
Session Shading:
Tokyo: semi-transparent blue
London: semi-transparent orange
New York: semi-transparent purple
Sydney: semi-transparent yellow
Current-Session Highlight: A light green background indicates which session is now active.
Countdown Label:
When a session is open: “Session: ends in hh:mm”
When closed: “No session. Next in hh:mm”
Automatically updates on every new bar.
Flexible Timeframes: Works on any chart timeframe (1 m, 5 m, 15 m, 1 h, 4 h, daily, etc.).
---
📈 How to Use
1. Add to Chart: In TradingView’s Pine Editor, paste the ParthFintech MARKETS script and click Add to Chart.
2. Publish: When you publish, use the description above to let other traders know exactly what they’re getting.
3. Customization (Optional):
Open the script and modify the session start/end hours at the top if you have a different trading schedule.
Adjust the shading opacity or colors by editing the color.new() parameters.
------
> Note: This indicator is designed for informational and planning purposes. Always combine session-based insights with your own technical and fundamental analysis before placing trades.
Enjoy clearer session visibility and pinpoint timing on your charts—courtesy of ParthFintech MARKETS!
For more information, contact support@parth-fintech, Telegram: @ParthFintech
www.parth-fintech.com

Biotech WarningFor traders that don't like the risks of trading biotechs, but like to examine 100's or 1,000's of charts at a time, it can potentially take some time to identify if a stock is a biotech or not. This simple indicator places a large "Biotechnology Warning" on your chart if the stock you're looking at falls into this industry.

Micro Futures Contract Calculator Micro Futures Contract Calculator
Synopsis: The Micro Futures Contract Calculator is a sleek, minimalist indicator that calculates the number of Micro E-mini Nasdaq-100 (MNQ) or S&P 500 (MES) contracts you can trade based on a fixed dollar risk and stop-loss (in ticks). Displayed in a compact, professional table in the top-right corner, it shows your risk, stop-loss, contract type, and calculated contracts, helping traders maintain consistent risk management.
How to Use:
Add the indicator to your chart (search “Micro Futures Contract Calculator”).
In settings, input:
Maximum Risk ($): Your total risk per trade (e.g., $100).
Stop-Loss (Ticks): Stop-loss size in ticks (e.g., 20 ticks = 5 points).
Contract Type: Select MNQ or MES.
Check the top-right table for:
Risk, stop-loss, contract type, and number of contracts (e.g., “10” for MNQ, “4” for MES).
Use the contract number to size trades, ensuring risk stays fixed.
Why Standardized Risk is Important:
Consistency: Fixed risk per trade (e.g., $100) prevents oversized losses, stabilizing long-term performance.
Discipline: Removes emotional guesswork, enforcing a systematic approach across MNQ/MES trades.
Capital Protection: Limits exposure, preserving your account during losing streaks and volatile markets.
Scalability: Aligns position sizing with your risk tolerance, enabling confident scaling as your account grows.
This indicator simplifies risk management, making it essential for disciplined futures trading.

Signalgo S&DThis script combines multi-timeframe net volume analysis with trend filtering. Unlike typical scripts that simply plot moving averages or basic S/R levels, this tool synthesizes net volume shifts across different timeframes, then confirms signals with a Moving Average trend filter.

Signalgo NVThis script combines multi-timeframe net volume analysis with trend filtering. Unlike typical scripts that simply plot moving averages or basic S/R levels, this tool synthesizes net volume shifts across different timeframes, then confirms signals with a Moving Average trend filter.

Signalgo XThis script delivers a multi-layered approach to real-time news, hype, and institutional activity detection across different timeframes. Unlike traditional indicators or simple news overlays, this tool uses multiple and different analytics with a proprietary anti-hype filter and institutional tracking system.
The indicator does not use external news headlines or economic calendar events. Instead, it generates "news" signals in real time by analyzing price, volume, volatility, and sentiment data across multiple timeframes. These signals are algorithmically classified as "bullish news," "bearish news," "strong, or "hype" events, and are displayed as chart labels. The script also includes a proprietary anti-hype filter that suppresses signals during periods of abnormal or unreliable market conditions.

Signalgo S/RThis script combines multi-timeframe S/R detection with a proprietary breakout confirmation and signal grading system. Unlike generic S/R indicators, this tool analyzes and synthesizes S/R levels from different timeframes, then generates trade signals only when breakouts are confirmed and aligned across multiple timeframes.

Signalgo MAThis script generates buy/sell signals by combining multi-timeframe analysis with trend filtering and signal logic. Unlike typical moving average indicators that operate on a single timeframe, this tool simultaneously analyzes moving averages across multiple timeframes. It then synthesizes these crossovers through proprietary multi-layered logic to identify trend alignments and produce graded trading signals.

Global Risk Matrix [QuantAlgo]🟢 Overview
The Global Risk Matrix is a comprehensive macro risk assessment tool that aggregates multiple global financial indicators into a unified risk sentiment framework. It transforms diverse economic data streams (from currency strength and liquidity measures to volatility indices and commodity prices) into standardized Z-Score readings to identify market regime shifts across risk-on and risk-off conditions.
The indicator displays both a risk oscillator showing weighted average sentiment and a dynamic 2D matrix visualization that plots signal strength against momentum to reveal current market phase and historical evolution. This helps traders and investors understand broad market conditions, identify regime transitions, and align their strategies with prevailing macro risk environments across all asset classes.
🟢 How It Works
The indicator employs Z-Score normalization across various global macro components, each representing distinct aspects of market liquidity, sentiment, and economic health. Raw data from sources like DXY, S&P 500, Fed liquidity, global M2 money supply, VIX, and commodities undergoes statistical standardization. Several components are inverted (USDT.D, DXY, VIX, credit spreads, treasury bonds, gold) to align with risk-on interpretation, where positive values indicate bullish conditions.
This unique system applies configurable weights to each component based on selected asset class presets (Crypto Investor/Trader, Stock Trader, Commodity Trader, Forex Trader, Risk Parity, or Custom), creating a weighted average Z-Score. It then analyzes both signal strength and momentum direction to classify market conditions into four distinct phases: Risk-On (positive signal, rising momentum), Risk-Off (negative signal, falling momentum), Recovery (negative signal, rising momentum), and Weakening (positive signal, falling momentum). The 2D matrix visualization plots these dimensions with historical trail tracking to show regime evolution over time.
🟢 How to Use
1. Risk Oscillator Interpretation and Phase Analysis
Positive Territory (Above Zero) : Indicates risk-on conditions with capital flowing toward growth assets and higher risk tolerance
Negative Territory (Below Zero) : Signals risk-off sentiment with capital seeking safety and defensive positioning
Extreme Levels (±2.0) : Represent statistically significant deviations that often precede regime reversals or trend exhaustion
Zero Line Crosses : Mark critical transitions between risk regimes, providing early signals for portfolio rebalancing
Phase Color Coding : Green (Risk-On), Red (Risk-Off), Blue (Recovery), Yellow (Weakening) for immediate regime identification
2. Risk Matrix Visualization and Trail Analysis
Current Position Marker (⌾) : Shows real-time location in the risk/momentum space for immediate situational awareness
Historical Trail : Connected path showing recent market evolution and regime transition patterns
Quadrant Analysis : Risk-On (upper right), Risk-Off (lower left), Recovery (lower right), Weakening (upper left)
Trail Patterns : Clockwise rotation typically indicates healthy regime cycles, while erratic movement suggests uncertainty
3. Pro Tips for Trading and Investing
→ Portfolio Allocation Filter : Use Risk-On phases to increase exposure to growth assets, small caps, and emerging markets while reducing defensive positions during confirmed green phases
→ Entry Timing Enhancement : Combine Recovery phase signals with your technical analysis for optimal long entry points when macro headwinds are clearing but prices haven't fully recovered
→ Risk Management Overlay : Treat Weakening phase transitions as early warning systems to tighten stop losses, reduce position sizes, or hedge existing positions before full Risk-Off conditions develop
→ Sector Rotation Strategy : During Risk-On periods, favor cyclical sectors (technology, consumer discretionary, financials) while Risk-Off phases favor defensive sectors (utilities, consumer staples, healthcare)
→ Multi-Timeframe Confluence : Use daily matrix readings for strategic positioning while applying your regular technical analysis on lower timeframes for precise entry and exit execution
→ Divergence Detection : Watch for situations where your asset shows bullish technical patterns while the matrix shows Risk-Off conditions—these often provide the highest probability short opportunities and vice versa

[DEM] % Risk % Risk calculates and plots the average daily percentage change in price, which can be interpreted as a measure of short-term price volatility or "risk." It is displayed as a percentage.

Position Averaging CalculatorDescription:
A powerful utility indicator for active traders.
Input up to 10 averaging trades (entry price and dollar amount), and get a real-time calculation of:
Average position price
Spread (%) between last entry and average
Total position size
Potential profit based on a custom sell price
All inputs are editable directly in the indicator settings.
A clean table display shows detailed breakdowns for fast decision-making during trade management.


EMA CCI SSL BUY SELL Signal [CongTrader]📌 Indicator Description
EMA CCI SSL BUY SELL Signal is a powerful trading tool that combines HTF SSL Channel, EMA trend filtering, and precise crossover-based signals to generate high-probability BUY and SELL entries.
It is designed to work effectively in crypto, forex, and stock markets, especially on 15m, 1H, and 4H timeframes.
🔍 Key Features:
✅ Clear BUY / SELL labels with visual markers.
📈 EMA trend filter helps eliminate false signals in sideways or weak trend markets.
⏫ SSL Channel is calculated from higher timeframe data for increased accuracy.
🔔 Built-in alerts to notify you when a new signal is triggered.
🧠 Informative price & percentage change table shown directly on the chart.
📊 Regression channel included to help analyze trend direction visually.
🧾 How to Use
Add the indicator to your chart and choose your preferred timeframe (recommended: 15min, 1H, or 4H).
Customize the EMA length and switch between Auto / Manual HTF Mode to suit your strategy.
Watch for:
BUY signals with green “BUY” labels and upward arrows.
SELL signals with red “SELL” labels and downward arrows.
Signal table showing entry price and % change since signal.
Enable alerts to be notified of new BUY/SELL signals.
For best results, combine this tool with your own price action analysis and risk management strategy.
🙏 Thank You
Thank you for using the CongTrader indicator!
We strive to provide useful and easy-to-understand trading tools to help traders across different markets.
If you find this indicator helpful, please consider leaving a like ❤️, sharing your feedback, or recommending it to others in the community!
⚠️ Disclaimer
This is a technical analysis tool intended for educational and informational purposes only.
It does not constitute financial or investment advice.
Past performance is not indicative of future results. Always trade responsibly and use proper risk management.
EMA Buy Sell Signal, SSL Channel Indicator, HTF Trend Filter, Crypto Signal Tool, Forex Buy Sell Alert, CongTrader Indicator, TradingView Signal Script, EMA Crossover Strategy, Regression Channel, Best TradingView Indicator.

Visual SL/TP con ATR + Pips/TicksThis indicator automatically displays the current ATR size along with suggested SL (Stop Loss) and TP (Take Profit) values, expressed in key units such as pips and ticks.
✅ Compatible with:
Forex (e.g., EURUSD)
Indices (e.g., NAS100, US30)
Gold (XAUUSD)
Cryptocurrencies (e.g., XRPUSDT)
🎯 Ideal for scalping, intraday, or swing trading.
🧠 Saves calculation time and improves trading speed.
Includes:
Automatic SL/TP calculation based on ATR multiples
Conversion to pips and ticks for quick reading
Dynamic support for different instrument types
📌 Tip: Use this indicator alongside your entry strategy with EMAs or volume for more precise trading.

Multi-Ticker Daily Change DisplayThis give you the ability to add a 5-ticker table to your charts to be able to track indices or specific stock change percentages.

Assets Correlation by GDM📊 Correlation Matrix Table between Two Assets
This indicator calculates and displays the rolling correlation between the asset on your chart and a second asset of your choice. The correlation is computed based on log returns over a user-defined lookback period. A live summary table appears in the bottom left corner, providing a real-time snapshot of the current correlation and its context.
How it works:
Comparison Asset:
Select any symbol to compare with the chart asset (e.g., compare BTCUSD to ETHUSD).
Lookback Period:
Choose the rolling window (in bars) used to calculate the Pearson correlation coefficient.
Dynamic Table:
A table in the lower left corner summarizes:
Main asset symbol
Comparison symbol
Analysis period (bars)
Current correlation value (rounded to 2 decimals)
Correlation strength & direction (Strong, Moderate, Weak | Positive/Negative)
Visual Plot:
The indicator plots the correlation value over time so you can observe changes and trends.
Table Positioning:
Table location can be adjusted from settings (bottom left/right, top left/right).
How to use:
Risk Management & Diversification:
Quickly assess if two assets move together (positive correlation), in opposite directions (negative correlation), or independently.
Pairs Trading:
Identify opportunities when correlation diverges from historical norms.
Portfolio Construction:
Avoid overexposure to highly correlated assets, or use negative correlation for hedging.
Limitations & Tips:
Correlation values are based on historical returns and may change during periods of market stress or volatility.
Use multiple lookback periods (short, medium, long) for a more robust view.
Correlation does not imply causation—always complement with additional analysis.
Script Features:
User-selectable comparison asset and lookback window.
Real-time correlation calculation.
Clean summary table with correlation stats.
Optional alert logic and correlation plot for more advanced usage.
If you find this indicator useful, please leave a like and let me know your suggestions for improvements!

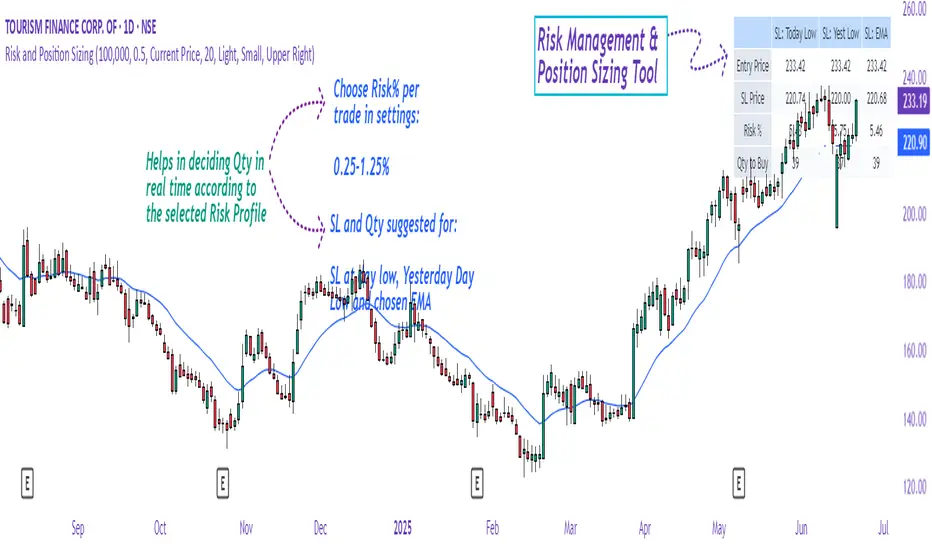
Risk and Position Sizing📏 Why Position Size Should Be Based on Risk?
Let’s say you are ready to lose 1,000 in a trade. Based on your stop loss level, you can calculate how many shares (or quantity) to buy, so that if the stop hits, you only lose that ₹1,000.
This is called risk-based position sizing. It makes your trade size dynamic — small when SL is wide, bigger when SL is tight. No more random position sizes — just systematic.
Portfolio size is multiplied by the selected risk % to get money risk per trade.
This amount is then used to calculate how many shares can be bought for the given stop-loss.
So chose your portfolio size in settings. Default Portfolio size is 1,00,000 .
You can select your risk % per portfolio in the settings — for example:
0.25% for conservative style
0.5% to 1% for balanced traders
1.25% or 1.5% for aggressive ones (not recommended for beginners)
This script will automatically calculate how much quantity you should buy, for each stop-loss scenario.
📈 Progressive & Inverse-Progressive Risk Styles
Some traders follow progressive position sizing — they start with small risk when the trend is just starting, and increase the risk % as the trend confirms.
Others follow inverse-progressive sizing — they take high risk at early stages of a bull market, and reduce risk as the trend matures (when upside becomes limited).
📌 This script allows you to manually control the risk % in settings, so you can adjust it based on your trading phase and style.
📋 Three SL Scenarios – Choose What Matches Your Style
The table shows three different stop-loss conditions, and for each one it calculates:
Today’s Low – tightest stop loss
Yesterday’s Low – slightly safer, ideal for short-term swing trades
EMA Stop (configurable) – gives more breathing room.
You can visually compare all 3 in the table and choose whichever fits your strategy and comfort.
Also, you can customize:
Theme: dark or light
Font size
Table position (upper/lower corners)
🧠 Designed for traders who take risk management seriously.
Let this script handle the math. You focus on execution.
Happy Trading!
– LensOfChartist