SPY/QQQ Plan Your Trade For 4-9 : Top/Resistance PatternToday's pattern suggests the SPY/QQQ will attempt to move a bit higher in early trading - trying to identify a resistance area. Then, roll over into a downward price trend.
Be cautious of the overnight price range, potentially already setting the upper boundary of the TOP pattern for today. It can happen that overnight trading sets a PEAK/TOP, and we move into sideways/downward trading related to the current TOP/Resistance pattern.
I believe the US markets will attempt to move upward, toward the $490-500+ level before topping out today. I believe this move will be related to the strong support near the $480 level and will attempt to further establish the downward price channel established by the big breakdown in trend over the past 9+ days.
Ultimately, I believe price is struggling for direction, but I also believe this process (with tariffs) is working out as expected.
This is obviously a very volatile market - so stay cautious as we move into a more consolidated price trend over the next few weeks.
I don't expect the markets to try to make any really big moves over the next 2+ week (unless news hits). At this point, I believe the markets will try to UNWIND the volatility over the next 2+ weeks.
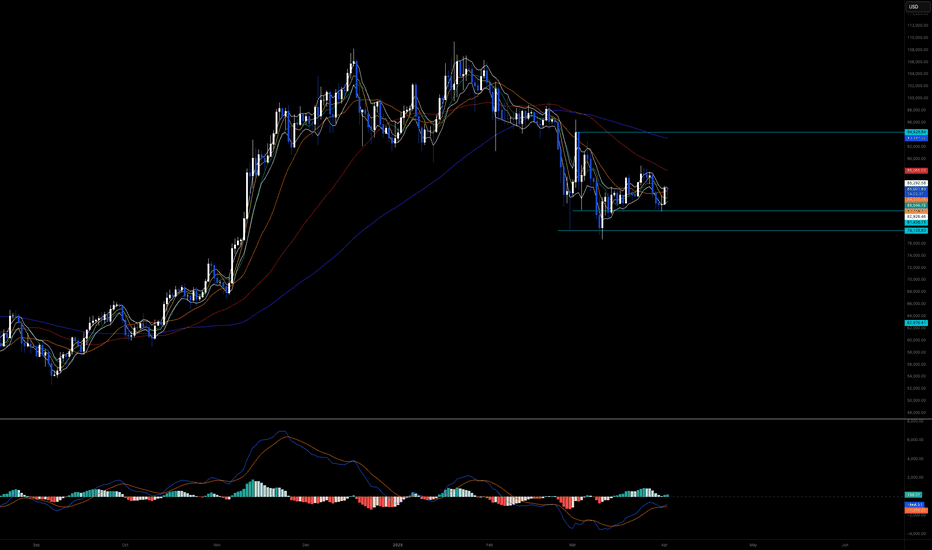
BTCUSD is trading near the lower range of the consolidation phase. This could be the start of the breakdown to the Ultimate Low.
GOLD and Silver are moving higher after forming the base (just as I expected). Metals will likely rally strongly as global fear elevates.
Thank you for all the great comments. I'll try to publish a few new videos today and tomorrow to help everyone out.
Remember, price gives us new information every minute/bar. It is a matter of unraveling the puzzle with price - one bar at a time.
If you like what I do, follow along.
Get some.
#trading #research #investing #tradingalgos #tradingsignals #cycles #fibonacci #elliotwave #modelingsystems #stocks #bitcoin #btcusd #cryptos #spy #gold #nq #investing #trading #spytrading #spymarket #tradingmarket #stockmarket #silver
1-BTCUSD
SPY/QQQ Plan Your Trade Update For 4-8 : Absolute PerfectionThank you. Thank you to all of you who follow my videos and believe in my research.
The last few days/weeks have been absolutely incredible.
My SPY Cycle Patterns, on average, are about 70-80% accurate over a 12-month span of time. There are things, like news and big events (elections, outside forces, big news) that can disrupt any market trend and completely invalidate my SPY Cycle Patterns.
But, when the markets are generally left to their own accord, the SPY Cycle Patterns play out almost perfectly.
Yes, traders need to learn to adopt a PLAN A vs. PLAN B mentality with my SPY Cycle Patterns.
If Brad is right - this will happen. And if Brad is wrong, the opposite will likely happen.
But, the comments I've been receiving over the past 20+ days have been incredible.
Thank you.
Knowing that I'm reaching a larger group of people now (than when I started doing these videos about a year ago) and knowing that some of you are really seeing some BIG GAINS following my research is simply incredible.
I started doing these videos to prove my research and tools were incredible solutions for traders. But, at the same time, I started doing this to combat some of the scammers that are out there.
In my world, watching people (or hearing from them) after they've been scammed a couple of times is heartbreaking.
Most people put a lot of time and effort into trying to become skilled traders. I get it.
That's why I'm doing this - to show you the right path and to show you that price is the ultimate indicator.
Again, thank you from the bottom of my heart. Keep sending me those success stories and...
GET SOME.
#trading #research #investing #tradingalgos #tradingsignals #cycles #fibonacci #elliotwave #modelingsystems #stocks #bitcoin #btcusd #cryptos #spy #gold #nq #investing #trading #spytrading #spymarket #tradingmarket #stockmarket #silver
SPY/QQQ Plan Your Trade Update 4-8 : Counter Trend Bottom/RallyThis video was created to help you better understand why it is important to WAIT for the SPY Cycle Patterns to setup efficiently.
It is critically important that all of you learn the three basic rules of trading.
1. Never try to force a position/trade. If your research tells you some type of price event/trend is likely - don't jump into the trade too early. Wait for confirmation and wait for price to confirm your analysis is correct.
2. Start with a small position. Never GO BIG on your initial trade. If you are wrong, you can manage the trade with a small win/loss. If price moves in the direction you expect, you can add more once you get confirmation the trend will continue (potentially).
3. BOOK PROFITS early and keep BOOKING PROFITS as the trend continues higher. You can always get back into the trade with CALL/PUT options - but if you don't learn to BOOK PROFITS EARLY (20-30% profits in the trade), then you'll very likely FAIL to build your account efficiently.
(Trust me, #3 is VERY IMPORTANT)
Beyond these three simple concepts, one of the most important aspects of trading with my SPY cycle patterns is to learn to WAIT for the pattern to setup efficiently.
Today is a great example.
The BOTTOM/Rally Start pattern was in Counter-trend mode. Thus, I expected it to be INVERTED - turning it into a TOP/Selloff Start pattern.
In order for that pattern to play out, we needed to see the markets open higher (and potential trend higher for a bit of time), then roll over into a top pattern. After that tops pattern setup, the markets should continue to move into a moderate selloff trend (downward).
Think about it. Were you smart trying to SELL INTO the rally this morning or were you smart to wait for the ROLLOVER and sell into the breakdown trend?
IMO, smart traders waited for the top to setup/confirm and started selling as we got into the breakdown trend phase.
Again, I'm trying to help you learn to become a better trader.
I hope this video helps.
Get some.
#trading #research #investing #tradingalgos #tradingsignals #cycles #fibonacci #elliotwave #modelingsystems #stocks #bitcoin #btcusd #cryptos #spy #gold #nq #investing #trading #spytrading #spymarket #tradingmarket #stockmarket #silver
Were To Buy BITCOINMartyBoots here , I have been trading for 17 years and sharing my thoughts on COINBASE:BTCUSD here.
.
BTC is very interesting chart for now that it has dipped 30% and trying to find support.
Do not miss out on BTC at the important levels as this will be a great opportunity
Watch video for more details
SPY/QQQ Plan Your Trade For 4/8 : Bottom/Rally Start - CounterFirst off, today's pattern is in a COUNTER TREND mode. Think of that as the pattern being INVERTED to the current price trend.
Next, the Bottom/Rally Start pattern is usually a base/bottom type of pattern that prompts a fairly strong bullish/rally phase in price.
This time, because it is inverted (in Counter-trend mode) and is forming within the broad consolidation phase of the current EPP pattern, I believe this Bottom/Rally Start pattern will really be a Top/Selloff start type of pattern.
Where price will find resistance in early trading, form a rollover top, and start to move back downward towards the 500-505 level on the SPY.
I don't believe this downward price move will attempt to break below 480-485 today. I believe today's move will be a moderate pullback in the trend.
Although any BIG news could disrupt the current support near $480, so be aware that any big news event could crush the markets (again) and send the SPY trying to retest the $480 support level.
Gold and Silver appear to be basing - perfect. I'm watching for Metals to really start to reflect the FEAR in the markets and rally above $3200 (Gold)/$39 (Silver).
BTCUSD appears trapped in the breakdown stage of the current EPP Consolidation phase and the new CRADLE pattern. No matter how I try to identify if I'm wrong with BTCUSD, I keep seeing the breakdown as the more dominant trend.
Get some.
#trading #research #investing #tradingalgos #tradingsignals #cycles #fibonacci #elliotwave #modelingsystems #stocks #bitcoin #btcusd #cryptos #spy #gold #nq #investing #trading #spytrading #spymarket #tradingmarket #stockmarket #silver
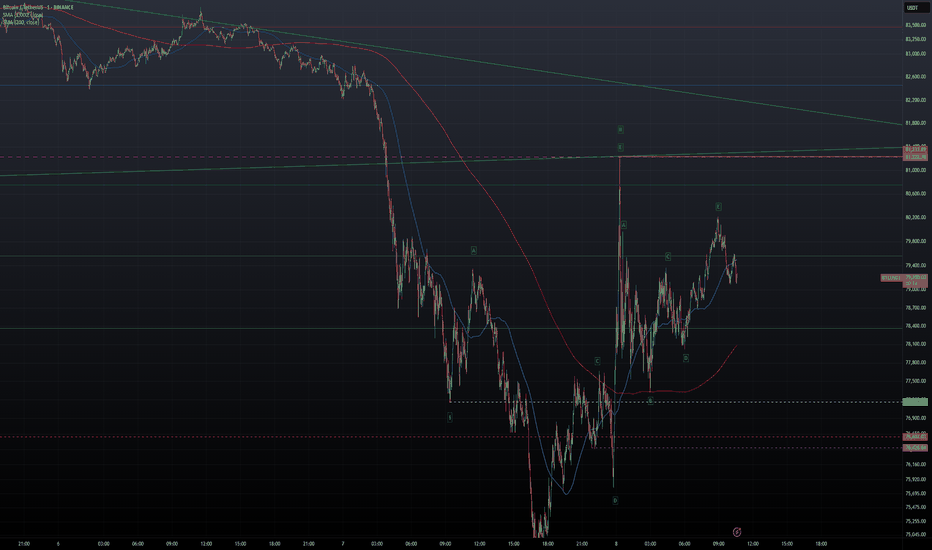
BITCOIN - Short Trade Idea Update - Wave ii Looks Complete...In this video, I break down what I woke up to this morning regarding the wave structure.
With wave ii appearing to be complete, I’m looking to add to my short position and adjust my stop level down to 81,223—creating another potential entry point for the short trade.
Recognizing and understanding these developing patterns is essential if you want to stay in the game.
SPY/QQQ Plan Your Trade EOD Review : POP PatternToday's pattern played out perfectly.
I'm really amazed that the SPY rallied up to my resistance level ($520-525) and stalled/bottomed exactly near my $480 support.
Absolutely PERFECT reflection of the data I presented this morning and from my research over the weekend.
Now, if my analysis is correct, we move into a sideways consolidation pattern for the next 3+ weeks where price will attempt to establish a range (moving slightly downward in trend) before we get to the late-June breakdown (setting up the July 2025 low), then another big breakdown in October 2025.
I can't tell you how pleased I am with the comments and messages I get every day. Some of you are KILLING IT and I'm so happy to be able to help.
Remember, we are all trying to find the best way to profit from these market trends. So remember to share your success with others and let them know how to find the best tools for trading (on TradingView).
Now, let's get busy trying to get ready for the next phase of this market trend (which will come in June).
I'll keep you updated.
Get some.
#trading #research #investing #tradingalgos #tradingsignals #cycles #fibonacci #elliotwave #modelingsystems #stocks #bitcoin #btcusd #cryptos #spy #gold #nq #investing #trading #spytrading #spymarket #tradingmarket #stockmarket #silver
BITCOIN - Price Could Be Heading Towards 60K...After multiple rejections at higher price levels, the most recent major rejection—followed by a break of the lows—suggests that the corrective move we've seen since the end of February may have concluded.
In this video, I outline the key reasons why a larger upside move no longer appears likely.
With the potential end of the corrective wave combinations now in sight, I'm shifting to a bearish outlook, targeting a potential move down to $61K. To validate this view, we need to see a break below $81,222, confirming the start of a deeper breakdown.
As it stands, I can no longer support a short-term bullish scenario unless we see a strong break above $84,715. However, given the recent sharp move to the downside, this seems unlikely and may, in fact, mark the beginning of a larger downward trend.
SPY/QQQ Plan Your Trade For 4-4 : Breakaway PatternToday is a very interesting day because my MRM investment model turned BEARISH on the Daily chart. That means we have broken through major support because of this tariff war and the markets are not OFFICIALLY (based on my models) into a Daily BEARISH trend (or a Daily Broad Pullback Phase).
What that means is we need to start thinking of the markets as OVERALL BEARISH and trying to identify support - or a base/bottom in the near future.
This is no longer a BULLISH market - everything seems to have flipped into a BEARISH primary trend (OFFICIALLY).
So, watch this video to understand how Fibonacci price levels will likely play out as the SPY targeting the 500-505 level (possibly lower) and where the same Fibonacci price levels will prompt the QQQ to target 395-400.
BUCKLE UP. This is a BIG CHANGE related to overall market trend.
Gold is holding up much better than Silver. But I still believe this is a PANIC selling phase in Gold/Silver and they will both base/recovery and RALLY much higher.
The funny thing about the cycles in Gold/Silver is this:
In 2007-08, just after the major expansion phase completed, the Global Financial Crisis hit - prompting a large downward price rotation in metals.
Maybe, just maybe, this forced tariff war issue is a disruption that will "speed up" the process of metals rallying above $5000++ over the next 60+ days.
I see this move as PHASES and it appears the tariff disruption may prompt a faster Phase-Shift for metals over the next few months. We'll see.
BTCUSD seems to be in SHOCK. It's really going nowhere on very low volume.
If BTCUSD is a true hedge or alternate store of value - I would think it would have an upward reaction to this selling.
We'll see how this plays out.
Get some.
#trading #research #investing #tradingalgos #tradingsignals #cycles #fibonacci #elliotwave #modelingsystems #stocks #bitcoin #btcusd #cryptos #spy #gold #nq #investing #trading #spytrading #spymarket #tradingmarket #stockmarket #silver
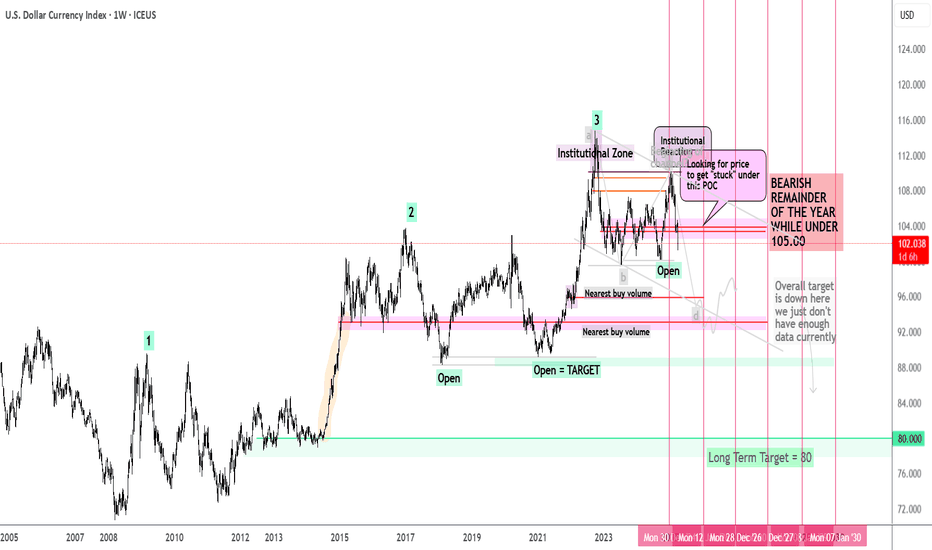
DXY to 80? ...Tariffs the First Domino in a Multi-Year Collapse?This is a pure technical walkthrough of the U.S. Dollar Index—no fluff, no indicators, no fundamentals. Just market structure, smart money, and liquidity concepts.
Back on January 14th , I posted about a potential 20%+ drop in the DXY — you can view it here . This video builds on that thesis and walks you through the full technical story from 1986 to today , including accumulation cycles, yearly trap zones, and my long-term target of 80. Am I crazy? Maybe. Let's see if I can convince you to be crazy too 😜
There is a video breakdown above, and a written breakdown below.
Here are timestamps if you want to jump around the video:
00:00 – The Case for $80: Not as Crazy as It Sounds
02:30 – The 0.786 Curse: Why the Dollar Keeps Faking Out
06:15 – How Smart Money Really Moves: The 4-Phase Playbook
12:30 – The Trap Is Set: Yearly Highs as Liquidity Bait
20:00 – Inside the Mind of the Market: 2010–2025 Unpacked
25:00 – The Bear Channel No One’s Talking About
36:00 – The First Domino: Is the Dollar’s Slide Just Beginning?
👇 If you're a visual learner, scroll down—each chart tells part of the story.
Chart: Monthly View – Three Highs, .786 Retraces, and Trendline Breaks
History doesn’t repeat, but it sure rhymes.
Each major DXY rally has formed a sequence of three swing highs right after a break of trendline structure. In both instances, price retraced to the .786 level on the yearly closes—an often overlooked fib level that institutional players respect.
We’re now sitting at a high again. You’ll notice price has already reversed from that zone. That doesn’t guarantee a collapse, but when we line it up with other confluences (next charts), the probability of a deeper markdown becomes hard to ignore.
I'd also like to note that all of the highlighted moves, are 2-3 year trend runs. Which means if we are bearish, this could be the exact start of a 2-3 bear market.
Market Phases Since 1986
This chart illustrates how DXY has moved through repeating cycles of:
🟡 Accumulation: Smart money building positions quietly.
🔵 Markup: Price accelerates with buy orders + media hype.
🟣 Distribution: Smart money sells to latecomers.
🔴 Markdown: Public panic → smart money reloads.
If we are indeed entering another markdown phase, this would align perfectly with the pattern seen over the past 40 years.
You’ll also notice the "Point of Control" (POC) zones—volume-based magnets that price often returns to. These spots often act as the origin of the move, and as such, they make for strong targets and areas of interest.
Liquidity Zones and Stop Loss Traps
This is where it gets juicy.
The majority of breakout traders placed long entries at the blue lines—above swing highs, thinking resistance was broken. But what’s under those highs? Stop loss clusters.
Institutions use these areas as liquidity harvests.
Several key levels are marked as “OPEN” in this chart, meaning price has yet to return to sweep those orders. That’s why I’m expecting price to begin seeking out that liquidity over the coming months.
There's also an imbalance gap (thin price action) around the 85–86 zone. If price falls into that trap door, there’s nothing to stop it until the 80s.
The 2025 Outlook
Here’s how I’m approaching this year:
✅ Bearish bias under 105
🎯 Targets at 100, 95, and 90
🚪 Trap door under 86 if volume is thin
Price is currently stuck under the recent point of control and showing signs of distribution. If that level continues to hold as resistance, we could see a multi-leg push downward, with the 100 and 95 zones acting as check-in points.
If we break under the 90s and enter the imbalance zone, 80 becomes more than just possible—it becomes probable.
🗣️ Let’s Sharpen Together
Do you see this unfolding the same way?
Do you disagree with the 80 target?
Drop a comment with your view or share your own markup—this is why we trade!
Stay safe,
⚠️ Risk Disclaimer
This post is for educational purposes only and reflects my personal analysis and opinions. It is not financial advice. Trading involves significant risk and may not be suitable for all investors. Always do your own research, manage your risk appropriately, and never trade money you can’t afford to lose.
SPY/QQQ Plan Your Trade For 4-3 : GAP Breakaway PatternFirst off, thank you for all the great comments and accolades related to my calling this breakdown (nearly 60+ days ago).
Did I get lucky having these new tariffs announced, causing the markets to break downward? Probably.
Did my research suggest the markets were going to break downward anyway? YES.
Did my research predict these tariffs? NO.
My research is specifically price-based. You'll notice I don't use many indicators, other than my proprietary price pressure and momentum indicators.
The purpose of what I'm trying to teach all of you is that price is the ultimate indicator. You can use other indicators if you find them helpful. But, you should focus on the price chart and try to learn as much as you can from the price chart (without any indicators).
Why, because I believe price tells us everything we need to know and we can react to price more efficiently than getting confused by various technical indicators.
At least, that is what I've found to be true.
Today's pattern suggests more selling is likely. After the markets open, I suggest there will be a bunch of longs that will quickly be exited and shorts that will be exited (pulling profits). Thus, I believe the first 30-60 minutes of trading could be extremely volatile.
My extended research suggests the markets will continue to try to move downward (over the next 60+ days) attempting to find the Ultimate Low. But, at this point, profits are profits and we all need to BOOK THEM if we have them.
We can always reposition for the next breakdown trade when the timing is right.
Gold and Silver are moving into a PANIC selling phase. This should be expected after the big tariff news. Metals will recover over the next 3-5+ days. Get ready.
BTCUSD is really not moving on this news. Kinda odd. Where is BTCUSD as a hedge or alternate store of value? I don't see it happening in price.
What I do see is that BTCUSD is somewhat isolated from this tariff news and somewhat isolated from the global economy. It's almost as if BTCUSD exists on another planet - away from global economic factors.
Still, I believe BTCUSD will continue to consolidate, attempting to break downward over the next 30+ days.
Remember, trading is about BOOKING PROFITS and moving onto the next trade. That is what we all need to focus on today.
Get Some.
#trading #research #investing #tradingalgos #tradingsignals #cycles #fibonacci #elliotwave #modelingsystems #stocks #bitcoin #btcusd #cryptos #spy #gold #nq #investing #trading #spytrading #spymarket #tradingmarket #stockmarket #silver
BITCOIN - Long Trade Price Action Update...In this video, I break down the latest price action while incorporating some AriasWave analysis along the way.
There's nothing unusual happening—just psychological reactions testing your patience.
Welcome to the world of trading lol, where you can be riding high one moment and facing losses the next, shifting between excitement and frustration.
Today, I dive into the psychology of trading—what drives a trader’s mindset, the balance between logic and mental discipline, and how mastering both can help grow your bank account. Everything begins in the mind, whether it’s knowledge or habit.
I remain bullish, and while the external picture hasn’t changed much, what about your internal one?
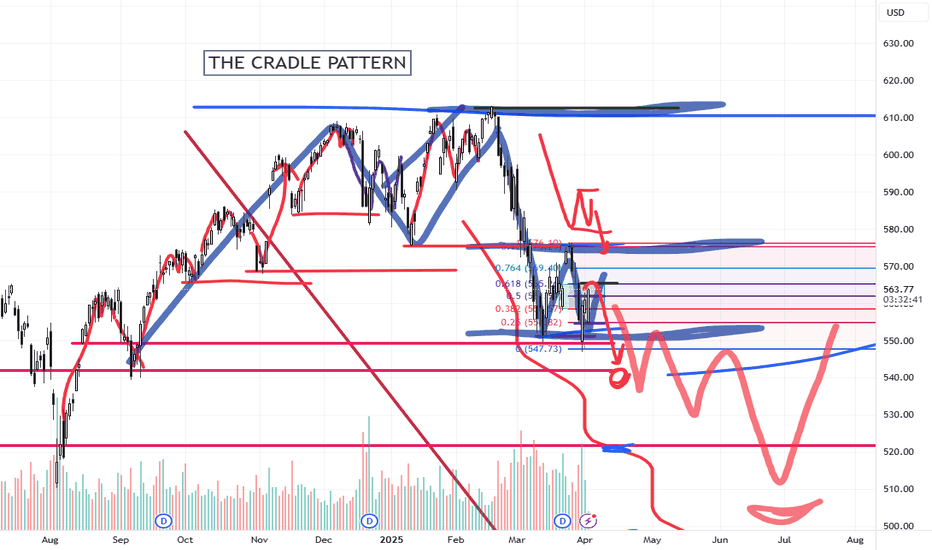
Using The CRADLE Pattern To Time/Execute TradesThis simple video highlights one of my newest pattern definitions - the Cradle Pattern.
In addition to the many other patterns my technology identified, this Cradle Pattern seems to be a constant type of price construct.
I'm sharing it with all of you so you can learn how to identify it and use it for your trading.
Ideally, this pattern represents FLAGGING after a trend phase.
It is a consolidation of price within a flag after a broad trending phase.
It usually resolves in the direction of the major trend, but can present a very solid reversal trigger if the upper/lower pullback range is broken (see the examples in this video).
Learn it. Use it.
Price is the ultimate indicator.
Learn to read price data more efficiently to become a better trader.
Get some.
#trading #research #investing #tradingalgos #tradingsignals #cycles #fibonacci #elliotwave #modelingsystems #stocks #bitcoin #btcusd #cryptos #spy #gold #nq #investing #trading #spytrading #spymarket #tradingmarket #stockmarket #silver
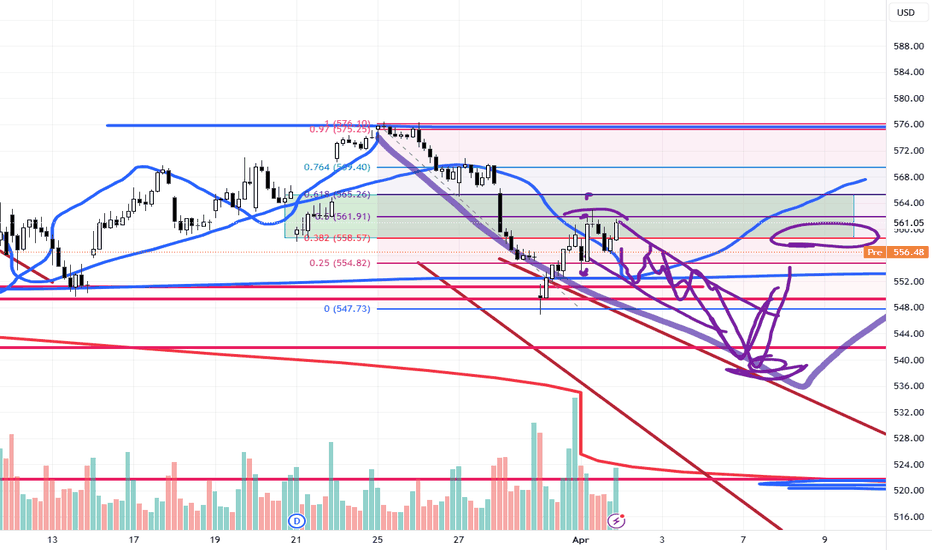
SPY/QQQ Plan Your Trade Update Update For 4-2 : ConsolidationThis quick update shows why I believe the SPY/QQQ will struggle to make any big move as long as we stay within the 382-618 "Battle Zone".
The SPY continues to rally up into this zone and stall out. If the SPY stays within this zone, I believe the markets will simply roll around in a tight range and go nowhere today.
Thus, I published this article to warn traders not to expect any big trends until we breakout - away from this Fibonacci "Battle Zone".
You can't kick the markets to make it go anywhere. And, unless you are trading very short-term swings in price - you are probably better off sitting on the sidelines waiting for a broad market trend to establish.
This is a warning. As long as we stay in the Fibonacci "Battle Zone", price will struggle to build any major trend.
So, play your trades accordingly - or just take a break from trading while you wait for the markets to roll out of the "Battle Zone".
Get some.
#trading #research #investing #tradingalgos #tradingsignals #cycles #fibonacci #elliotwave #modelingsystems #stocks #bitcoin #btcusd #cryptos #spy #gold #nq #investing #trading #spytrading #spymarket #tradingmarket #stockmarket #silver
SPY/QQQ Plan Your Trade For 4-2 : GAP Reversal Counter TrendToday's pattern suggests price may attempt to move downward in early trading, trying to find support near recent lows, then potentially roll a bit higher.
I do expect price to move into a downward price trend - attempting to break below the 549 price level and targeting the 535-545 target Fib level this week.
Today, Thursday, and Friday are all GAP/Breakaway types of patterns. So we should be entering an expansion of price trend and I believe that trend will be to the downside.
Gold and Silver are nearing a Flag Apex level. Very exciting for a potential breakout rally driving Gold up above $3250 and Silver up above $36.
I personally believe there is nothing stopping Gold and Silver in this rally phase until Gold reaches levels above $4500. GET SOME.
BTCUSD had a very interesting spike low. I still believe BTCUSD will roll downward - targeting the $76-78k level, then break downward towards the $60k level. Time will tell.
The rest of this week should be very exciting with the Breakaway and GAP patterns.
Get some.
#trading #research #investing #tradingalgos #tradingsignals #cycles #fibonacci #elliotwave #modelingsystems #stocks #bitcoin #btcusd #cryptos #spy #gold #nq #investing #trading #spytrading #spymarket #tradingmarket #stockmarket #silver
Tariff Tensions, Dollar Dips & Gold’s Record Rally!"As of April 2, 2025, the financial markets have been significantly influenced by recent economic data releases and geopolitical developments, particularly concerning the U.S. Dollar Index (DXY), gold (XAU/USD), and Bitcoin (BTC/USD).
1. Key Economic Data Reports and Their Impact:
U.S. Dollar Index (DXY): The DXY has experienced fluctuations due to recent economic indicators and policy announcements. The Job Openings and Labor Turnover Survey (JOLTS) reported softer figures, indicating a slight cooling in the labor market. Additionally, the Institute for Supply Management (ISM) released data reflecting a slowdown in manufacturing activity. These reports have contributed to a marginal decline in the DXY, which decreased by 0.02% to 104.2418 on April 2 .Financial TimesTrading Economics
Gold (XAU/USD): Gold prices have surged to record highs, nearing $3,150 per ounce. This increase is largely driven by investor concerns over potential economic slowdowns and uncertainties surrounding impending tariff announcements by President Trump . The anticipation of these tariffs has led investors to seek safe-haven assets, bolstering demand for gold.
Bitcoin (BTC/USD): Bitcoin has shown signs of recovery, trading above $84,000 with a nearly 2% gain in the past 24 hours . This rebound follows weeks of price weakness and is occurring amid the backdrop of upcoming tariff announcements, which have introduced volatility into the cryptocurrency markets.
2. Implications of the Data Reports:
Labor Market and Manufacturing Data: The softer JOLTS figures and the ISM manufacturing slowdown suggest a potential deceleration in economic growth. These indicators may influence the Federal Reserve's monetary policy decisions, potentially impacting interest rates and, consequently, the strength of the U.S. dollar.The Guardian+3EWF Pro+3KuCoin+3
Tariff Announcements: The anticipation of new tariffs has heightened market uncertainty. Investors are closely monitoring these developments, as they could have significant implications for international trade relations and economic stability. Such uncertainties often lead to increased demand for safe-haven assets like gold and can introduce volatility into both traditional and digital asset markets.
3. Major Contributors to Recent Market Movements:
Tariff Uncertainty: President Trump's impending announcement of new tariffs has been a primary driver of recent market volatility. The potential for widespread tariffs has led to concerns about a global economic slowdown, prompting shifts in investor sentiment .
Investor Sentiment and Safe-Haven Demand: The uncertainty surrounding trade policies has led investors to seek refuge in assets perceived as safe havens, such as gold. This shift has contributed to the significant rise in gold prices.
Cryptocurrency Market Dynamics: While Bitcoin has faced headwinds from global trade tensions, it has also shown resilience. Analysts suggest that traders may be overstating the impact of the U.S.-led tariff war on Bitcoin's price, indicating that other factors, such as market sentiment and technological developments, also play crucial roles .
In summary, the recent economic data releases and the anticipation of new tariffs have collectively influenced the DXY, gold, and Bitcoin markets. Investors are advised to monitor these developments closely, as they have the potential to significantly impact market dynamics in the near term.
BITCOIN - Long Trade Update - Third-of-a-Third Wave Incoming...In this video, I share an update on the developments I've observed since yesterday as we prepare for a move higher in a third-of-a-third wave.
As price movements become smaller and sharper at lower degrees, identifying the correct count becomes more challenging.
That’s why I always consider bearish alternatives and play devil’s advocate. However, at the moment, I don’t see any conflicting signals, so it’s just a matter of waiting for the next upward thrust to begin from here.
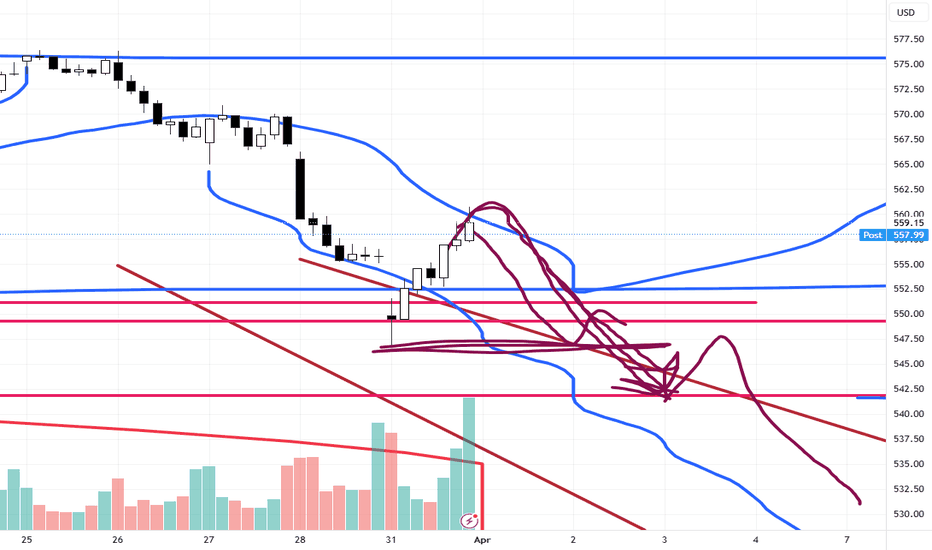
SPY/QQQ Plan Your Trade For 4-1-25 : Temp Bottom PatternToday's pattern suggests the SPY/QQQ will attempt to find temporary support near recent lows or a bit lower.
I'm not expecting much in terms of price trending today. I do believe the downward price trend will continue today with the SPY attempting to move down to the 548-550 level trying to find support.
The QQQ will likely attempt to move downward toward the 458-460 level trying to find the support/base/bottom level today.
Gold and Silver are in a moderate consolidation phase that I believe is transitioning through a Flag-Trend-Flag-Trend-Flag-Trend type of phase. Ultimately, the trend will continue to push higher through this phase as metals have moved into the broad Expansion phase. This phase should see gold attempt to move above $4500+ before the end of May/June 2025.
BTCUSD is rolling within the 0.382 to 0.618 Fibonacci price levels related to the last price swing. I see this middle Fib level and the "battle ground" for price. I expect price to stall, consolidate, and roll around between these levels trying to establish a new trend.
Thus, I believe BTCUSD will move downward, attempting to move back down to the $78,000 level.
Nothing has really changed in my analysis except that we are experiencing a 48-96 hour consolidation phase before we move back into big trending.
Play smart. Position your trades so that you can profit from this rolling price trend and prepare for the bigger price move downward (targeting the bigger base/bottom near April 15, 2025).
Get some.
#trading #research #investing #tradingalgos #tradingsignals #cycles #fibonacci #elliotwave #modelingsystems #stocks #bitcoin #btcusd #cryptos #spy #gold #nq #investing #trading #spytrading #spymarket #tradingmarket #stockmarket #silver
Bearish Trend Meets Bullish Momentum: Is BTC Ready for a Rebound📉 Bitcoin is currently in a strong bearish trend on higher timeframes, but 📈 the 1-hour timeframe shows a break of structure and bullish momentum. This suggests a potential short-term pullback into the previous range, aligning with the 50% Fibonacci retracement level. 🔄 Additionally, there’s a bearish imbalance above that could be rebalanced. While this presents a possible buy opportunity, ⚠️ it’s a high-risk setup due to the overall bearish trend. Always trade with caution! 🚨
Disclaimer
⚠️ This is not financial advice. Trading involves significant risk, and you should only trade with funds you can afford to lose. Always do your own research and consult a professional if needed. 💡
SPY/QQQ Plan Your Trade EOD Update : Rejecting The BreakdownDoes this big rejection bar mean the selling trend is over?
I doubt it.
In my opinion and experience, big rejection bars like this reflect a critical price level where the markets will attempt to REVISIT in the near future.
Normally, when we get a big rejection bar, like today, we are testing a critical support/resistance level in price and you can see the difference between the SPY, DIA and QQQ charts.
The QQQ price data is already below the critical support level and barely trying to get back above the rejection level. Whereas the SPY and DIA are still above the rejection lows.
I see this as a technology driven breakdown and because of the continued CAPTIAL SHIFT, we may move into a broader WAVE-C breakdown of this current trend.
I see the SPY already completing a Wave-A and Wave-B. If this breakdown plays out like I expect, we'll see a bigger breakdown in price targeting $525-535, then possibly reaching $495-505 as the immediate ultimate low.
If you follow my research, there is a much lower level near $465-475 that is still a likely downward target level, but we'll have to see how price reacts over the next 2+ days before we can determine if that level is still a valid target.
Watch for more support near recent lows tomorrow, then a potential breakdown in the SPY/QQQ/DIA.
Get some.
#trading #research #investing #tradingalgos #tradingsignals #cycles #fibonacci #elliotwave #modelingsystems #stocks #bitcoin #btcusd #cryptos #spy #gold #nq #investing #trading #spytrading #spymarket #tradingmarket #stockmarket #silver
BITCOIN - Long Trade Idea Update - We Could See One More Low...In this video, I discuss why Bitcoin may still make another low before the Wave 2 correction is fully complete.
Upon closer examination of Wave iv in the previous Wave 5 correction, it appears the level where Wave iv ended was slightly miscalculated.
Technically, Bitcoin should have dipped below the perceived low, but either its strength has prevented this, or the ongoing correction is nearing completion.
The key level to watch is $82,445—if Bitcoin breaks above this, we should continue higher.
However, it’s more likely that we first dip below $81,274 before experiencing a strong upward move.
Pay close attention when Bitcoin makes another low, as the reversal could be sharp, potentially piercing through $82,445, which would confirm the trend shift.
If we make a new low then I would suggest price would turn back up after tagging $81,071.
SPY/QQQ Plan Your Trade For 3-31 : Carryover PatternToday's pattern suggests the SPY/QQQ will attempt to carryover Friday's selling trend.
I do believe the SPY/QQQ will attempt to find some support as we move into a Temp Bottom pattern tomorrow. So be aware that the SPY/QQQ may attempt to find support near 535-540/450-455 over the next few days.
I would also urge traders to not get very aggressive in terms of trying to pick a bottom in this downtrend.
In my opinion, I don't see any reason why anyone should be buying into this breakdown unless you are prepared to take a few big lumps. Just wait it out - wait for a base/bottom to setup.
Gold and Silver are moving higher and I believe this trend will continue for many weeks/months.
BTCUSD should continue to move downward - trying to establish the Consolidation Phase range.
As we move into trading this week. Be aware that Tuesday/Wednesday of this week are more ROTATION type days. They may be wide-range days - but they are still going to be ROTATIONAL.
Get some.
#trading #research #investing #tradingalgos #tradingsignals #cycles #fibonacci #elliotwave #modelingsystems #stocks #bitcoin #btcusd #cryptos #spy #gold #nq #investing #trading #spytrading #spymarket #tradingmarket #stockmarket #silver


