Simple and efficient MACD crypto strategy with risk managementToday I am glad to bring you another great creation suited for crypto markets.
MARKET
Its a simple and efficient strategy, designed for crypto markets( btcusd , btcusdt and so on), and suited for for higher time charts : like 1hour, 4hours, 1 day and so on.
Preferably to use 1h time charts.
COMPONENTS
MACD with simple moving average
ENTRY DESCRIPTION
For entries we have :
We check the direction with MACD . Depending if its an uptrend and positive level on histogram of MACD we go long, otherwise we go short.
RISK MANAGEMENT
In this strategy we use a stop loss based on our equity. For this example I choosed a 2% risk .That means if our account has 100.000 eur, it will automatically close the trade if we lose 2.000.
We dont use a take profit level.
In this example also we use a 100.000 capital account, risking 5% on each trade, but since its underleveraged, we only use 5000 of that ammount on every trade. With leveraged it can be achieved better profits and of course at the same time we will encounter bigger losses.
The comission applied is 5$ and a slippage of 5 points aswell added.
For any questions or suggestions regarding the script , please let me know.
1-BTCUSD

DePriExchange weighted price for cryptocurrencies
DECENTRALIZED PRICE CHART FOR DECENTRALIZED WORLD
See non-manipulated , globally price action that comes from whole liquidity!
The main idea behind this script is that...
The value of each trading pair finally determined globally and the price displayed in exchanges is its own and not global! differences between exchanges, reduced to near zero gradually by market makers and arbitrages, so..
Every min tick price changes Must be backed by liquidity to be part of the global fluctuations
more liquidity gives it more credibility
more credibility give it more weight
..Against opposing movements.
This script can collect price of crypto pairs from 12 exchanges that listed on TV and have effective volume.
In the first step, summarizes the volume of all exchanges and creates the total volume
In the next step, divide each exchange volume to total volume to obtain relative weight of each exchange.
In the final step, multiply each exchange price to weight of itself and summarizes these numbers .. now, we have Exchange weighted price!
The results on high liquidity pairs like BTCUSDT, ETHUSDT, is not much differ then simple chart but when you apply it on lower liquidity, lower time frames of altcoins, you realize its benefits and usefulness. Altcoins chart in composite and simple mode is very differ, I hope you enjoy from TRUE CHART.
With this, also you can..
Filter and smooth candlestick chart with SMA or EMA
Plot a line chart of pair at your desired frame separate from the main chart for monitor important price levels
Get realtime report of whole volume of pair on included exchanges
Get realtime report of each exchange weight and share
Note.1:
some of pairs queted on more than one like BTCUSD, BTCUSDT, BTCUSDC and etc. In this pairs we choose the one that usually has more volume on that exchange.
Note.2:
At this time, supported queted currencies are BTC, ETH, USD, USDT, BUSD, USDC, USDK.
Note.3:
This script is relatively heavy! This is not cuz of bad coding.
Each bar compution contains at least one plot and some of security calls, so 10 to 15 seconds is normal load time.
Note.4:
You can combine this with your price action base scripts and use balanced OHLCV. The necessary explanations about this are available in the code.
Note.5:
You must only include exchanges that support your ticker, Otherwise you will receive an error.
I hope it comes useful to you.


Underdog Trading Signal SystemBased on & modified from popular ATR strategies, This is our very own buy and sell signals system. it should work on any pair, with standard settings, from btcusd , to us30.
It does work on most time frames, but with standard settings, i find the best results come from 15m time frames and 4h, along side general charting knowledge, this is a very powerful tool.
The printed line on the chart is a DMA (displaced Moving Average) which can be used for finding the trend direction, so if the price is above the DMA, only take the long positions, and if below, only take shorts.
The entries are designed to show you the direct buy and sells (as i said above), but also, will show you potential reversals, if the price is on the wrong side of the DMA.
As usual, if you have any further questions on how this system works, or if you wish to get access to this system, please DM on TradingView or follow the links below to find out more.
Look forward to hearing from you
TradingSargentAlpha @ UnderdogTrading

PWTPROv5 TrendIndicator with LONG/SHORT BTC ETH alerts
This PWTPRO indicator is based on VWAP , MACD and EMAs
Best fits for BTC /USDT and ETH/USDT trading for 1H timeframe for positional trading (3-5 trades per week)
15min TF is good for intraday scalping. 4H is good for longterm. Fits for any coin, forex, metals, oil and bonds.
There are 4 types of entries, 1,3 and 4 are on by default. It's more accurate. Rest you can test.
Warning. Not yet works with huge trend continuation. Use it manually with you own risk management, don't forget stop-losses.
Show take profits and stop-loss (It's off by defaults)
You can now add 3 take-profit and 1 stop-loss labels on chart in %
Use 0 values to remove any of them from the charts.
New option: Show entering position price as label
Minor visual improvements with price labels (y position is now correctly above/below bars)
+added new option to round prices for integer values (i.e. 9251 for btc instead of 9251.35) off by defaults and now fits for altcoins and any asses that has price below 1 (usd, btc etc)
This is invite only script. PM me if you want to test it.

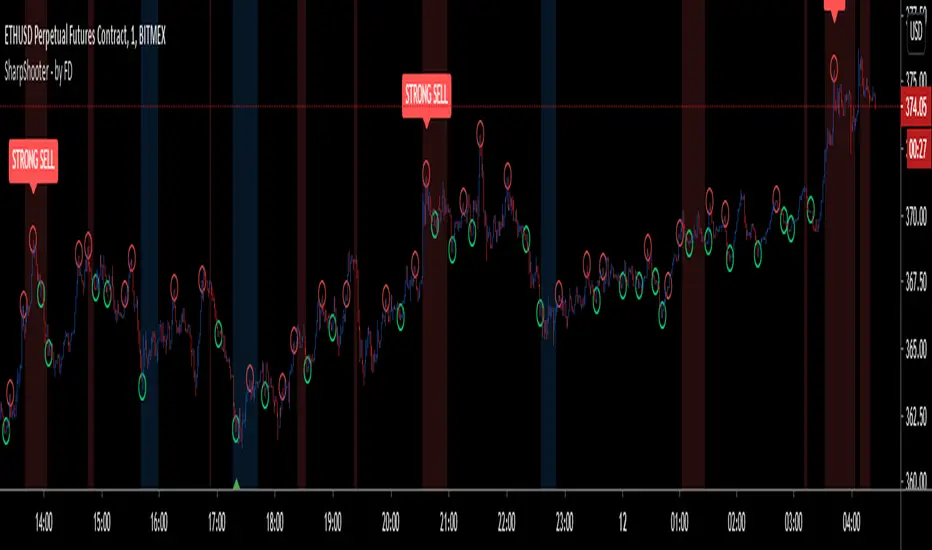
Sharp Shooter - by FiatDropoutThis is an experimental script and is intended to be used only on LTF charts for scalping. It may or may not be useful on other charts and time frame, but that is subject to back testing.
Now, coming back to this script. It has multiple features yet i tried to keep it as clean in representation as possible.
As obvious, few things are easily recognizable on chart, such as:
BUY - Go LONG
STRONG BUY - Heavy Uptrend is expected, Go LONG
SELL - Go SHORT
STRONG SHORT - Heavy Downtrend is expected, Go SHORT.
on addition to above signals, there are few other plot-shapes, which are:
Red Circle - Acts as TP for LONG during uptrend and acts as Add-On SHORT during downtrend
Green Circle - Acts as TP for SHORT during downtrend and acts as Add-on LONG during uptrend.
Red Background - Bearish Peak, potential start of downtrend
Blue Background - Bullish Peak, potential start of uptrend
------------------------------------------------------------------------------------------------------------------------------------------------------------------------------------
Now that plots are over, lets go to how to use them. As name of this script suggests, it intends to find most optimal entry and exit for long and short while taking profit on the way and adding to the position until trend changes.
Be aware that trend here is very much based on current time-frame and does not represent other time-frame's bias. Also, trend here is intended to be used as a scalp trend and not a swing trend.
Now once, you get a signal for BUY(example), then wait for "Bullish Peak"(blue background) to appear with either "STRONG BUY" or just "BUY" and take an entry at respective price, next look for "red circle" which acts as TP for long(refer sec, above) and either move stop to entry, or take partial profits or close position entirely.
Now every subsequent "green circle" will act as add-on for long and every "red circle" will act as TP for long, until "Bearish Peak" appears, which will reverse the order of how circles are used and direction of the trade. Now during "Bearish Peak" and until "Bullish Peak" appears, "red circle" will act as add-on for short and "green circle" will act as TP for short.
It might take some time to adjust to the plots, but i have decided to keep it that way in order to keep chart clean of too many signals.
------------------------------------------------------------------------------------------------------------------------------------------------------------------------------------
NOTE : Please use stops and be sure to place orders quickly as prices move faster on minute charts and you should be able to place orders and stop right away, so if you are new to trading and are currently in early stage of the business, scalping is strongly not advised, let alone this indicator. Also, past performance are not guarantee of future results and most importantly, this indicator does not repaint. By using this indicator, you accept that i am not responsible for any losses or gains made by user by trading with help of this bot.
Also, in next update, i will fix some bug, add some SS and also add alerts. Alerts are not being added currently because of high volatile nature of the bot signals which if tried on automation can give varied results. Once everything is set, i shall add alerts.
for any other queries, feel free to get back here on chat or DM.
Risk Metrics: Crypto VersionRisk Metrics for Crypto.
Market can be set to BTCUSD, BTCEUR, BTCCHF, BTCGBP, BTC1!, BTC2!, SPX, and DTB3
Beta
Correlation
Standard Deviation
Variance
R-squared

GODXBTTRADING SCRIPT "GODXBT"
ALL IN ONE !!!
This script helps you to understand the market situation
Script includes
. Support & resistance tool
. 3 EMA's ( exponential moving average ) ( you can change ema values )
. Smooth Guppy : helps to understand support and resistance also helps to understand trend direction ( Red is bearish trend & Blue is bullish trend )
. And Buy & Sell signals to take entry and exit
how to trade :
Buy/Long when " BUY " signal appears
Sell/Short when " SELL " signal appears
take profits near support and resistance lines / close position on the break of it
* Customized Switches to on/off Guppy , S/R levels
* When guppy is blue longs are profitable and when red shorts are profitable
*DM for access

PpSignal KC + CFB V2This strategy works with Keltner Channel (KC) and CFB (composite fractal behavior).
CFB will show us the trend and KC the volatility.
When CFB is green (the trend is bullish) and the price (price breakout KC) breaks the upper band, it will give us a buy.
When CFB is red (Bearish Trend) and the price (price breakout KC) breaks the lower band, it will sell us.
You should look for the best combination between the KC values and the cfb (optimization) values according to the asset to be traded.

Strategy Crazy RSI Futures BitcoinThis is a still evolving strategy working on Bitcoin Futures.
New updates coming soon

BITCOIN Miners Revenue VS Price Correlation OscillatorUse 3D(3-day candle) as timeframe for best reading.
------
original template for Correlation indicator was created by obaranova. credit goes to her.

Jarvis for BTCUSD by Armi GoldmanThis strategy is called JARVIS after the famous AI from the MARVEL movie Iron Man.
It is an improvement of the Copernicus Strategy to get better results. More exactly I was aiming to obtain over 50% of the number of trades profitable, for every pair provided (see the title).
The strategy tester does not include leverage trading, please keep that in mind and feel free to change the parameters of the volume for the position in the strategy settings to see the closer to reality results.
The setup for this strategy is more complicated because it includes 3 averages, all of them calculated with prices obtain by various formulas for each one of them and I call this: Sophisticated Moving Average (Copyright). Each of the 3 averages are applied to different timeframes and have different values. All of these parameters are configured separately for every trading pair and this is why I am publishing them separately.
There are not a lot of trades in this strategy, the average is around 1/month.
You can use the Tradingview alert services to configure this to execute (webhook) on your exchange/broker, because strategies have now the possibility to send alerts.
For other questions please send me a message.

[2020 Updated]Bitcoin Logarithmic Growth CurvesCredit goes to the original writer of the script, Quantadelic, who generously allowed anyone to copy/edit. I adjusted the value of the bottom/top intercept and slope to better fit the March 2020 coronavirus dip.
Use Bitstamp BTCUSD for better reading.

VIDYA by Mehmet YildizliVIDYA by Mehmet Yildizli - Variable Index Dynamic Average
Our behaviours toward financial markets change every time of any date. On the other hand, we usually tend to analyze averages via constant period-of time. That is, our analyzing way is not consistant with a changing dynamics of financial markets.
Therefore, a new form of Moving Average comes trough into the scene: The Variables Index Dynamic Average-VIDYA.
VIDYA is a moving average that regulates itself according to the volatiliy of prices. When prices go up or fall down rapidly VIDYA approches to prices. When prices move less volatile, VIDYA tracks the prices from a distance.
We start calculating VIDYA with an approch of Exponential Moving Average. However, the difference between VIDYA and EMA(Exponential Moving Average) is the changes of constant coeffient of EMA, according to volatility. When new price comes, each time, the VIDYA calculates a new coefficient used to calculate the average. Then, each time a new price comes, a new period of time is calculated according to volatiliy.
In this moving average indicator, you can set two moving average period at the same time. Additionally, you can set two different step height for two moving averages. These step height coefficients is used to round the moving averages. Therefore, when prices cross up and down continously you can change these step heights in order to prevent unnecessary trades.

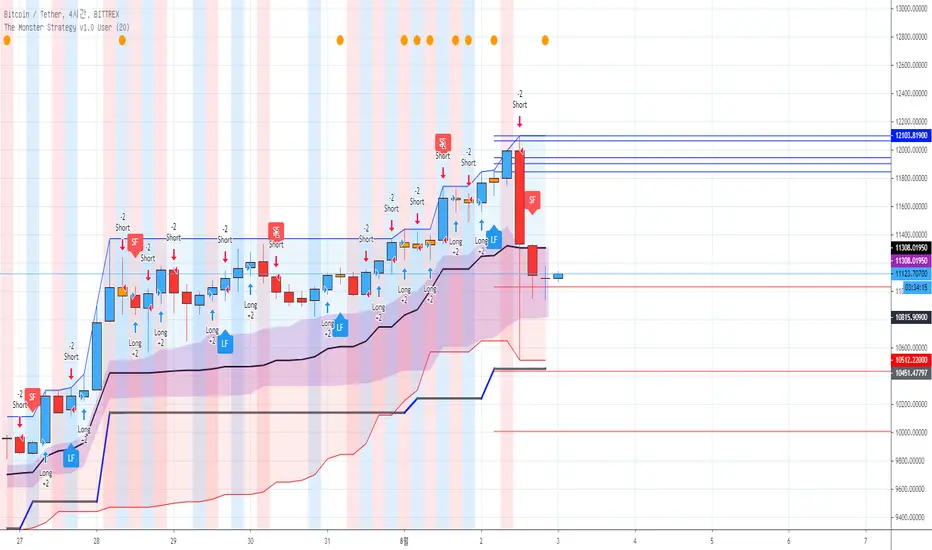
[AngelHouse] The Monster StudyHello, I'm Angelhouse, a crypto analyst and indicator developer. :)
I would like to introduce you to the newly developed "The Monster" index.
The metric is an upgraded version of the existing "All Eating" indicator.
The index was created to refer to the plot line of the "The Monster" strategic indicator.
- The "Monster" indicator is a strategic indicator created for crypto market transactions.
- This indicator is based on a four-hour time zone and is a strategic indicator using the intersection of the threshold.
- If a plot is crossed, a call is in progress or crossed, a sales signal is generated.
For a detailed description of the indicators, see The Monster Strategy.
※ If you want to obtain access to this indicator with a script dedicated for the first time, please contact the link shown in the signature.

[AngelHouse] The Monster StrategyHello, I'm Angelhouse, a crypto analyst and indicator developer. :)
I would like to introduce you to the newly developed "The Monster" strategic indicators.
The indicator is an upgraded version of the existing "All Eating" strategy indicator.
- The "Monster" indicator is a strategic indicator created for crypto market transactions.
- This indicator is based on a four-hour time zone and is a strategic indicator using the intersection of the threshold.
- If a plot is crossed, a call is in progress or crossed, a sales signal is generated.
※ Explanation of the "The Monster" Strategy Indicator v1.0
1. Long & Short: You can configure your swing strategy based on the signal.
The All Eating Strategy indicator is based on a four-hour frame. Due to the logic nature, the signal does not match at a time higher than 4 hours. Therefore, we recommend that you use the indicator only in a time zone of 4 hours or less.
Also, the signal does not have 100% accuracy, so even if you configure a strategy based on the signal, it is recommended that you set the break/break line and respond.
2. Long Feel & Short Feel: The signal is also quite reliable. The strength of the signal is very reliable when a strong rise and a strong fall occur.
However, the downside is that there may be some offbeat in the transverse section. However, even if the index is offbeat, the loss is small, and if the stock price rises or falls, high expected returns can be expected.
You can use the signal alone, but if you use the Long & Short indicator, you can get better results. If the Long Feel & Short Feel signal is also generated where the Long & Short signal is generated, the probability will be higher, right?
3. Candle color: White cans are formed when cans such as dojorpoenor hammer are generated. The cans have a meaning of reversal when they occur after a strong rise or fall, and can continue the trend when they occur during an ongoing trend.
4. Single item band: The single item band consists of the strong area (blue area) and the weak area (red area) based on the reference line. Stock prices can indicate additional gains when they are in the bullish zone, and additional declines when they are in the weak zone.
Also, you can recognize the top of the strong zone as the resistance line and the bottom of the weak zone as the support line.
The cloud stand in the single band should be located in front of the band for 26 days, but it is also recognized as a role of support and resistance.
5. 1D Baseline: The line of one bar is recalled to 4 hours. blue when the reference line is positive, red when negative, and gray when horizontal, and red when the reference line is positive,
Or, in the opposite case, it's time to suspect a trend inflection.
6. Target line : When a specific period is set (default 20 days setting), the target point is provided in each of the 5 lines, from the highest point in the period to the low point of the current bar, and from the lowest point to the high point of the current bar.
※ If you want to obtain access to this indicator with a script dedicated for the first time, please contact the link shown in the signature.
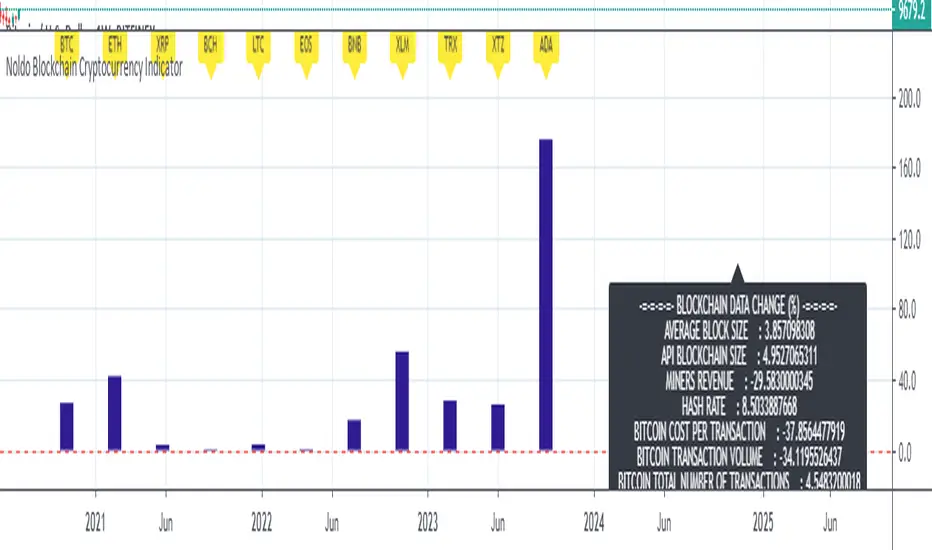
Noldo Blockchain Cryptocurrency Indicator
Hello, this script has the same logic as Noldo CFTC COT Forex Indicator :
And Noldo CFTC COT Commodities Indicator :
*
Script briefly calculates the period length between two signals of Pivot Reversal Strategy when new signal arrives and allows us to see relative Blockchain data and price changes of Major Cryptocurrencies over that automatic length.
This saves us from the hassle and time wasting of searching for a reference point.
Usage
This script works only on all Bitcoin / U.S Dollar pairs and futures.
It only works on 1W graphics.
ICOT data are pulled via Quandl
NOTE :
Since blockchain data is very votalile, 7-day ema values are adjusted to take into account.
Regards.
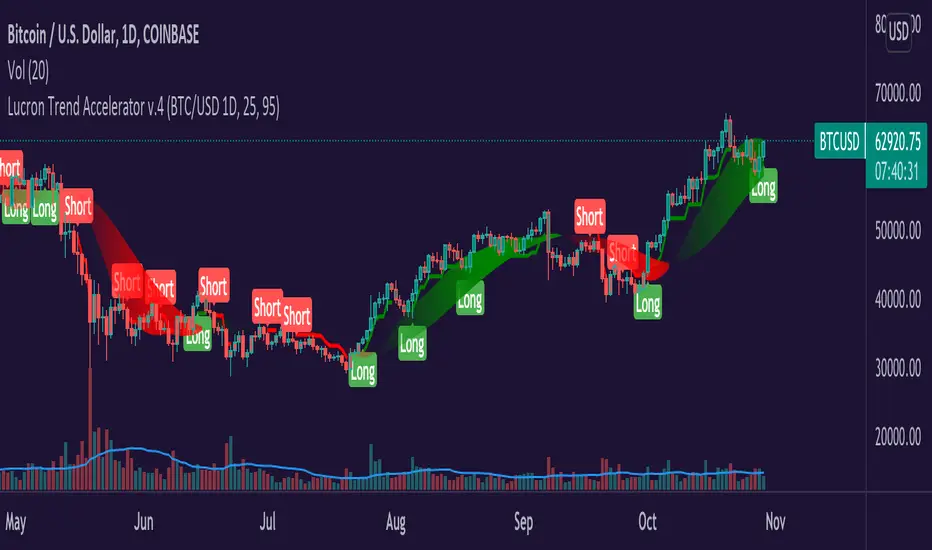
Lucron Trend Accelerator v.4Hey Everyone,
The Lucron Trend Accelerator v.4 is finally available. This indicator is market-specific, which means that it's proprietary code has been tested with best results in the following markets:
BTCUSD - DAILY TIMEFRAME
EURUSD - 1 HOUR TIMEFRAME
This can be applied to any market and any timeframe, but for best results, it's recommended to be used in the above markets. In the future, we are planning to add additional markets.
How it works:
Entry:
The indicator's code identifies emerging bullish and bearish trends. It then displays a "Long" OR "Short" signal on the chart - This marks an entry opportunity.
Position Management:
As the trend continues and your profit increases you will see a ribbon that affirms the direction of the trend. Green for long, and red for short.
Take Profit/ Exit:
Once you have completed the steps above just keep an eye out for a new signal. This signal will inform you of a shifting trend. It will display in the following ways:
A new "Long" Or "Short" signal displayed on your chart
A change in the color of the trend ribbon (from green to red)
If you have implemented a trailing stop, you'll be covered and should capture your profits or limit your risk before the next signal.
If you see any of these signals make sure to take action in order to protect your profits.
You can:
1. Exit the current trade & enter a new trade
2. Take profit on half the position & roll your stop to break even
Takeaways:
As you can now see, our proprietary Lucron Trend Accelerator Trading Tool allows for emotion free trading. It gently guides you by the hand, and shows you how to trade with a proven, calculated, and consistent strategy.
*Disclamer
Any information communicated by Lucron is solely for educational purposes. This is indicator is meant to be used with appropriate risk management and market analysis.
It is not intended to be and should not be interpreted as investment advice or a general recommendation on investment.
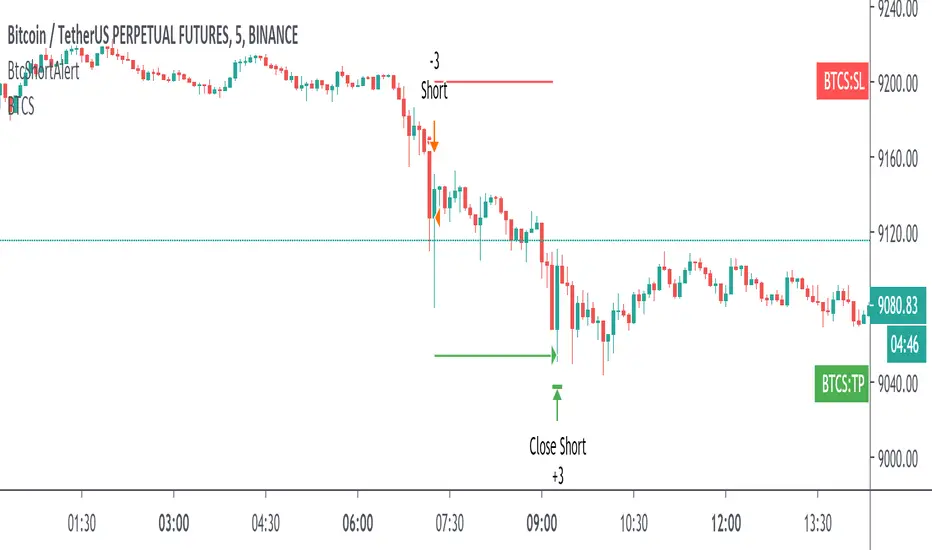
Btc Short StrategyBINANCE:BTCUSDTPERP
Developed for the btc perpetual future contract on Binance Futures .
How to Use:
It's based on a complex strategy for short positions that involves volume analysis, trend analysis, moving averages, supports and resistances and more.
Concretely this indicator opens a short position when there is a bearish trend and a breakout of a support zone and uses fear and volatility to take an edge on the market.
It runs on the 5 min chart for the entry , and it analyses higher timeframes.
It opens and close sell positions and automatically draws SL and TP. The R/R is 1:1.
It's possible to enable alerts of the strategy in order to be notified whenever the indicator opens or closes a position . You can use it in addiction of your strategy or for educational purposes .
(This indicator will be updated when/if there will be a change in the bias of the market)
Access must be given by me to test this. Once access given you can test.
PM me or use the links below to obtain access to this indicator.
Backtesting Results:
Initial Capital= 10000
Order Size= 3 contracts (max loss 2.15% of the capital)
Commission= 0.075% (same of VIP0 of binance)
Slippage=10 ticks
Reviews and Feedback are welcome.
Refer the Release notes for any updates and my posts below and in my idea page for more details.
Report any issues or ideas to me, I'll fix them !
Thank you !
DISCLAIMER:
All trading involves high risk: past performance is not necessarily indicative of future results. Hypothetical or simulated performance results have certain inherent limitations. Unlike an actual performance record, simulated results do not represent actual trading. Also, since the trades have not actually been executed, the results may have under- or over-compensated for the impact , if any, of certain market factors, such as lack of liquidity. Simulated trading programs in general are also subject to the fact that they are designed with the benefit of hindsight. No representation is being made that any account will or is likely to achieve profits or losses similar to those shown.
IntradaySignal #Trading #Candlestick #SignalThis is a simple version of taking bull and bear positions.
Time Frame: Although the time frame decided while making the script was for 1 minute chart, but after checking, even Daily charts work good.
Asset class: The underlying here, is XAUUSD (GOLD) but confirmatory strong positional trades on stocks for intraday purposes.
Condition: The signals are meaningful and are of significant importance when its in trending pattern and not in sideways pattern.
The signals are presented by the background color. when the color is red, start taking short positions, and when the signal is green, go with long position.
StopLoss: Complete reliance on the script might not be rewarding, Prepare your own stoploss and targets. I advise you to take profit and book losses as per "resistance & support" zones.

HFT Fibonacci Bands BacktesterDefault Settings are meant to be used in XBT/USD chart on 15 min time frame. If you want to use for another asset on another time frame YOU MUST CHANGE THE SETTINGS
This is a Fibonacci bands based trading strategy developed by HFT Research. It is a highly customizable strategy and provides endless opportunities to find profitable trades in the market.
Use Fib BB
This is the main decision maker of the strategy. Tuning the settings of this portion of the strategy will change the outcome the most. We have provided default settings. However, they are only good for 15min chart on Bitcoin . Please adjust accordingly.
Fib BB Length: This setting adjusts the middle line of your Fibonacci Bands. It is the moving average that you take it as base for your Fibonacci bands. Default value is currently 20.
Fib Level to Use for Entry: Here, you adjust which one of the Fibonacci Ratio levels you would like to use for your entry. You can only choose one of the following options.
Fibonacci Ratio 1
This is your Fib ratio level 1 and you can put any number here you would like
Fibonacci Ratio 2
This is your Fib ratio level 2 and you can put any number here you would like
Fibonacci Ratio 3
This is your Fib ratio level 3 and you can put any number here you would like
Please keep in mind that Ratio 1 should be higher than Ratio 2 and Ratio 2 should be higher than Ratio 3.
Use RSI
You can also turn on and off the RSI as well. Alternatively, there is an option to use RSI on a different time frame than you are currently on. For example, if you are looking at the 5min chart to use Bollinger bands but you would like to look at the RSI value on the 15min chart. You can do so by selecting the custom RSI timeframe as well as adjusting the Oversold and Overbought value.
Use CCI
Commodity Channel Index is an indicator developed by Donald Lambert. It is a momentum-based oscillator used to help determine when an investment vehicle is reaching conditions of being overbought or oversold. It also used to asses price trend direction and strength. Default settings are usually the safest and the best fit.
Use VWAP
VWAP stands for volume weighted average price . It is an extremely useful indicator when trading intra-day. It does reset every trading session which is at 00:00 UTC . Instead of looking at x number of candles and providing an average price, it will take into consideration volume that’s traded at a certain price and weigh it accordingly.
Use ADX
ADX stands for average directional index . It is an indicator that measures volatility in the market. Unfortunately, the worst market condition for this strategy is sideways market. ADX becomes a useful tool since it can detect trend. If the volatility is low and there is no real price movement, ADX will pick that up and will not let you get in trades during a sideways market. It will allow you to enter trades only when the market is trending.
Use MA Filters
Lookback: It is an option to look back x number of candles to validate the price crossing. If the market is choppy and the price keeps crossing up and down the moving average you have chosen, it will generate a lot of “noisy” signals. This option allows you to confirm the cross by selecting how many candles the price needs to stay above or below the moving average. Setting it 0 will turn it off.
MA Filter Type: There is a selection of moving averages that is available on TradingView currently. You can choose from 14 different moving average types to detect the trend as accurate as possible.
Filter Length: You can select the length of your moving average. Most commonly used length being 50,100 and 200.
Filter Type: This is our propriety smoothing method in order to make the moving averages lag less and influence the way they are calculated slightly. Type 1 being the normal calculation and type 2 being the secret sauce
Reverse MA Filter: This option allows you to use the moving average in reverse. For example, the strategy will go long when the price is above the moving average. However, if you use the reserve MA Filter, you will go short when the price is above the moving average. This method works best in sideways market where price usually retraces back to the moving average. So, in an anticipation of price reverting back to the moving average, it is a useful piece of option to use during sideway markets.
The backtester assumes the following;
- 1000$ capital
- 0.06% commission based on binance
- 1% risk meaning 100% equity on cross leverage
- Backtest results are starting from 2020
If you want to get access to this indicator please DM me or visit our website.

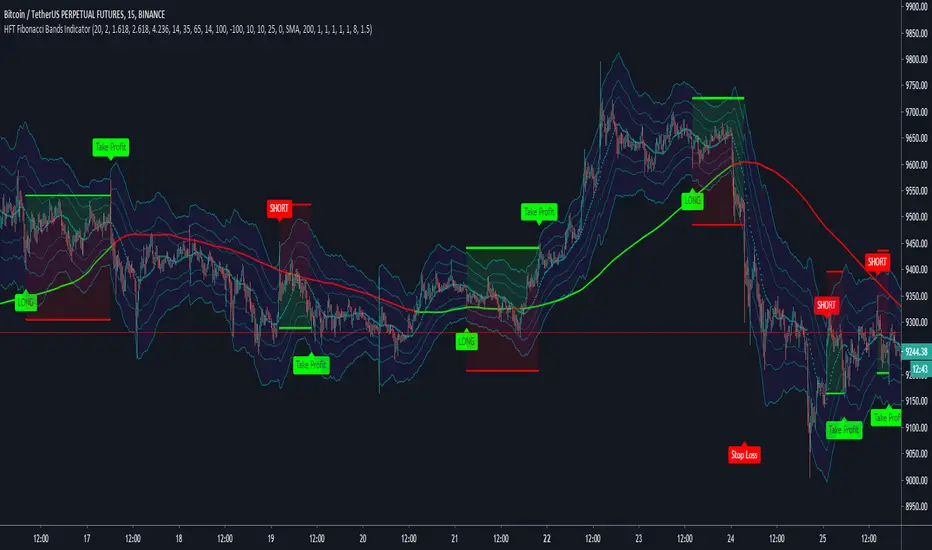
HFT Fibonacci Bands Indicator
Default Settings are meant to be used in XBT/USD chart on 15 min time frame. If you want to use for another asset on another time frame YOU MUST CHANGE THE SETTINGS
This is a Fibonacci bands based trading indicator developed by HFT Research. It is a highly customizable indicator and provided endless opportunities to find profitable trades in the market.
Use Fib BB
This is the main decision maker of the strategy. Tuning the settings of this portion of the strategy will change the outcome the most. We have provided default settings. However, they are only good for 15min chart on Bitcoin. Please adjust accordingly.
Fib BB Length: This setting adjusts the middle line of your Fibonacci Bands. It is the moving average that you take it as base for your Fibonacci bands. Default value is currently 20.
Fib Level to Use for Entry: Here, you adjust which one of the Fibonacci Ratio levels you would like to use for your entry. You can only choose one of the following options.
Fibonacci Ratio 1
This is your Fib ratio level 1 and you can put any number here you would like
Fibonacci Ratio 2
This is your Fib ratio level 2 and you can put any number here you would like
Fibonacci Ratio 3
This is your Fib ratio level 3 and you can put any number here you would like
Please keep in mind that Ratio 1 should be higher than Ratio 2 and Ratio 2 should be higher than Ratio 3.
Use RSI
You can also turn on and off the RSI as well. Alternatively, there is an option to use RSI on a different time frame than you are currently on. For example, if you are looking at the 5min chart to use Bollinger bands but you would like to look at the RSI value on the 15min chart. You can do so by selecting the custom RSI timeframe as well as adjusting the Oversold and Overbought value.
Use CCI
Commodity Channel Index is an indicator developed by Donald Lambert. It is a momentum-based oscillator used to help determine when an investment vehicle is reaching conditions of being overbought or oversold. It also used to asses price trend direction and strength. Default settings are usually the safest and the best fit.
Use VWAP
VWAP stands for volume weighted average price. It is an extremely useful indicator when trading intra-day. It does reset every trading session which is at 00:00 UTC. Instead of looking at x number of candles and providing an average price, it will take into consideration volume that’s traded at a certain price and weigh it accordingly.
Use ADX
ADX stands for average directional index. It is an indicator that measures volatility in the market. Unfortunately, the worst market condition for this strategy is sideways market. ADX becomes a useful tool since it can detect trend. If the volatility is low and there is no real price movement, ADX will pick that up and will not let you get in trades during a sideways market. It will allow you to enter trades only when the market is trending.
Use MA Filters
Lookback: It is an option to look back x number of candles to validate the price crossing. If the market is choppy and the price keeps crossing up and down the moving average you have chosen, it will generate a lot of “noisy” signals. This option allows you to confirm the cross by selecting how many candles the price needs to stay above or below the moving average. Setting it 0 will turn it off.
MA Filter Type: There is a selection of moving averages that is available on TradingView currently. You can choose from 14 different moving average types to detect the trend as accurate as possible.
Filter Length: You can select the length of your moving average. Most commonly used length being 50,100 and 200.
Filter Type: This is our propriety smoothing method in order to make the moving averages lag less and influence the way they are calculated slightly. Type 1 being the normal calculation and type 2 being the secret sauce.
Reverse MA Filter: This option allows you to use the moving average in reverse. For example, the strategy will go long when the price is above the moving average. However, if you use the reserve MA Filter, you will go short when the price is above the moving average. This method works best in sideways market where price usually retraces back to the moving average. So, in an anticipation of price reverting back to the moving average, it is a useful piece of option to use during sideway markets.
If you want to get access to this indicator please DM me or visit our website.
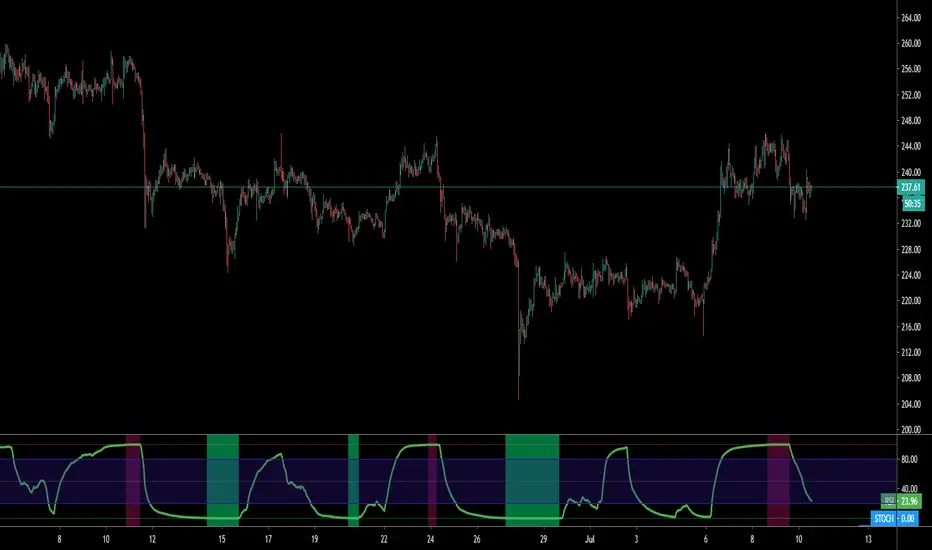
Horus Spreadmaster
Hello Traders,
Horus Spreadmaster is an oscillator based on the spread of two tickers and may indicate oversold / overbought conditions compared to one or the other . You can also setup an other time frame.
How it works?
- Setup the tickers
- Check the invert box if you have the correct ticker order
- Setup any time frame you want
- Display Stochastic
- Display StochRSI
If its indicated overbought, this does not mean it can't go higher. Same the other way around.
Use other indicators and PA for more confluence.
Wuuzzaa