EAG Trend FinderHi all,
this strategy is made for trend following and the volatility of cryptocurrencies.
Mainly for the 4H BTC chart even though it does work for alt coins but I haven't tested it on those yet.
This is a hands-on strategy, it doesn't give buy and sell signals without you doing some charting of yourself, try to define trends and use this strategy to find confirmation.
ignore the backtesting data since I made this for the past year and specific scenarios but couldn't figure out how to limit backtesting data so I ignored panel for this strategy.
Hands-on strategy!
Go long ( green boxes ) during up trends and short during down trends(blue boxes), sideways movement is the Achilles heel of this strategy and for that reason, it is important to try and filter the sideways movements as much as you can.
As always,
Happy Hunting!
Still a work in progress!
1-BTCUSD

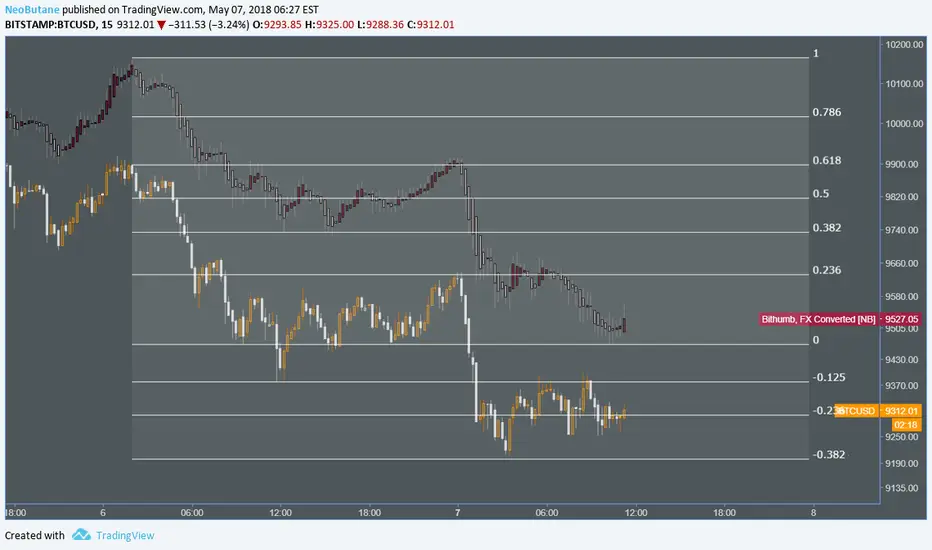
Bithumb BTCKRW, FX Converted [NeoButane]Uses live FX index. Index can be changed to your preferred currency.
WhenMewn 5.0Green Overlay = Trending up
Red Overlay = Trending down
Green Highlighted candle = Up Trend Confirmation.
Red Highlighted candle = Down Trend Confirmation.
Tested on 1hr timeframes.

Price Converter from BTCJPY to USDThis script shows USD equivalent price which converted from BTCJPY and BTCKRW by fetching latest rate of those local currencies.
By using this script, you can easy to compare the difference of BTC price in USD, JPY and KRW.
Fetching price from BitFlyer for BTCJPY, Bithumb for BTCKRW. Enjoy!


BTCUSD (Volume Based Average Price)This script shows volume based price of BTCUSD (Bitfinex %44, Binance %31, Bitstamp %13, Coinbase %8, Hitbtc %4)
Trading Alerts by @nomad5amScript with Backtesting & Alerts for Gunbot / Autoview / ProfitTrailer v2
Not for sale. For friends only :)

Cryptopeep RSI, Stochastic RSI, Stochastic and Williams %R, 4in14 Charts all in one chart, RSI, Stochastic RSI, Stochastic and Williams %R
Hope you like, please let me know your thoughts.
If you would like to be kept up to date please FOLLOW us and try our indicators and strategies here: uk.tradingview.com
If you like it please click the LIKE button.

CryptoPeep Candle Rule studyHere is the Study version of the CryptoPeep Candle Rule Strategy with Long and Short alerts but does not have the stop loss feature.
Please let me know your thoughts.
If you would like to be kept up to date please FOLLOW us and try our indicators and strategies here: uk.tradingview.com
This strategy is invite only. Please request an invite in comments below and if you like it please click the LIKE button.

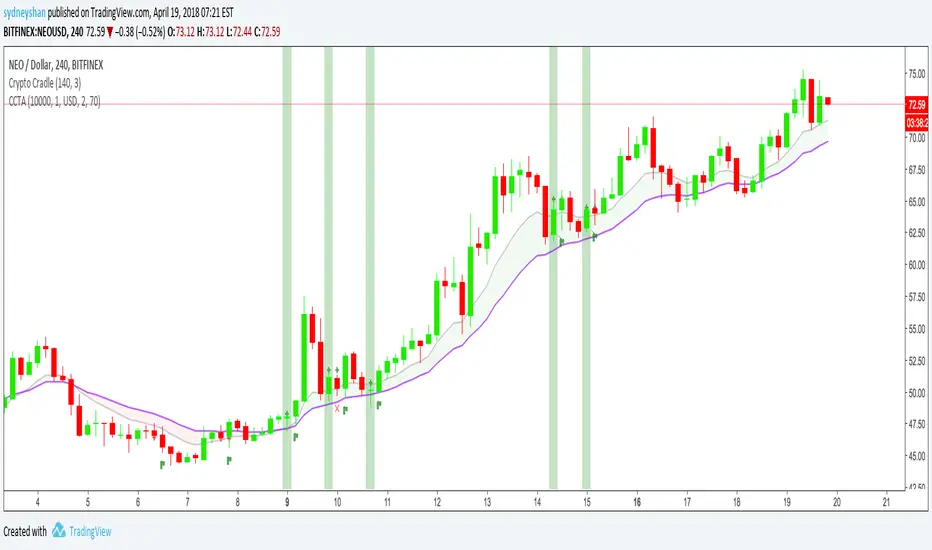
Crypto Cradle Trade AssistantThis indicator compliments the Crypto Cradle indicator by providing your entry, stop, 1:1 scale-out price, trade amount, and potential profit based on your target and scale-out strategy.
1. Ensure you have added the Crypto Cradle and Crypto Cradle Trade Assistant indicators to your chart
2. Click the cog icon to configure this indicator
3. Enter in your account balance and the % you are willing to risk on this trade (default: 1%).
3. Set your target price
4. Tweak the Trade Pair and Precision (Decimals) if required (USD/USDT only BTC & ETH coming soon)
5. Click on the 'Data Window' icon on the right-hand side of the screen and scroll down to CCTA
6. Hover over a highlighted crypto cradle candle (green for long, red for short) and a series of values will appear
Entry price
Stop price
1:1 scale out price
Amount to buy/sell (ie NEO)
Amount in traded currency (ie USD)
Target price (that you set)
Profit based on selling 50% of your bought amount when your reward equals your risk (1:1 scale-out)
Profit based on risking 1% of your portfolio
For more about the Crypto Cradle strategy, visit www.tradercobb.com
CryptoPeep Candle Rule StrategyWow such a simple but powerful script, I had this idea about a year ago but did not really believe it would work as so simple and ever since i have over complicating scripts without back testing my first idea.
Please let me know your thoughts.
If you would like to be kept up to date please FOLLOW us and try our indicators and strategies here: uk.tradingview.com
This strategy is invite only. Please request an invite in comments below and if you like it please click the LIKE button.

EMA_strategyUsing EMA on Daily chart as a signal, the result is pretty good with a simple strategy.
As a good example, the bull from 7K to 18K for bitcoin being triggerd.
CryptoShadows V1The first Diagonal Support and Resistance indicator. Best for bitcoin and cryptocurrencies

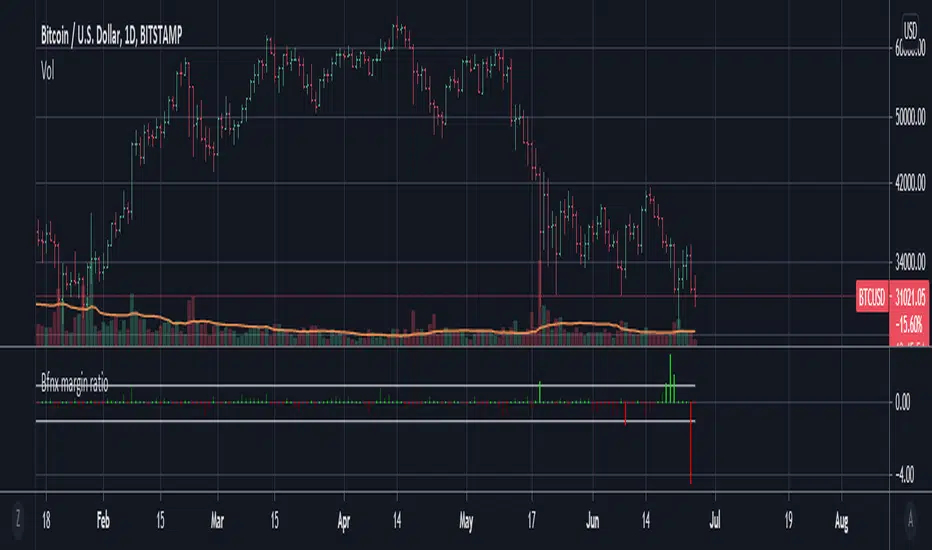
Bitfinex margin change / total volumeThis script tracks the net Bitfinex margin sizes from candle to candle (longs - shorts), and divide it by the total volume from the previous candle. This should give you a ratio of net margin trading volume over total volume on Bitfinex.
Note that assuming the delay is not severe, this ratio should never exceed 1 or -1 (since margin traded volume should strictly be lower than total traded volume during any time interval). As you can see clearly however, the ratio exceeds 1 and -1 quite frequently. Thanks to @CryptoTrendy on Twitter for bringing this issue to attention. Our trading group has noticed this issue ever since they introduced the tickers, and we suspect there are severe inaccuracies in either one, or both of the margin and total volume tickers.
iPyra◬_theMegalodonTHEMEGALODON
theMegalodon looks for the institutional finger prints, the whales or the big boys.
theMegalodon is really simple to use.
theMegalodon combines the 8 different unique indicators, that each have almost perfect success rate.
theMegalodon works with any kind of market state, any kind of trading, and any kind of asset.
theMegalodon has more features than any other indicator in the market: Out of 9 working indicators, we have 3 momentum, 3 price and 3 volume indicators showing you the best signals.
--------------------------------------
theMegalodon is designed for us, the small fishes in the ocean, the millennials, the college students. This will basically makes us the new Megalodons(whale hunters).
All you have to do is:
1- Look for green or red arrows.
2- Look for orange or red candles.
3- Repeat
--------------------------------------
TECHNICAL DETAILS
Some boring info that you don't necessarily need to know.
1- Draws fibonacci retracement (s)' levels depending on your preferred look back period (Default: 365 and 120)
i) Can draw 2 fibs on the same chart. Can reverse the fib levels. Even, add an additional fib level to look for.
ii) Automatic fill function for a Reload Zone inside of a Reload Zone. *61.8% levels to 100% levels or 0% levels
2- Changes the color of the candle when strong buy(orange) or strong sell(red). Draws arrows on the chart for long and short positions.
i) Analyses and Combines
a) Price
b) Momentum
c) Volume
3- Prints out the indicators that are either giving Short or Long signs on the right corner.
4- The closer the unclebo indicator(click enable UncleBo) gets to the All time high, the better buy it is.
i) Same with the other way around. The closer it gets to the 0, the better sell it is.
5- Draws Bollinger Bands on the chart and shows where to buy or sell
6-The indicator is designed to be used in Daily time frame for the best calls to short or long.
--------------------------------------------------
iPyra◬
Enlighten others
Bitfinex BTCUSD long vs short sizesThis displays the long and short margin sizes of BTCUSD on Bitfinex. When longs are higher volume, difference is filled with green color; when shorts are higher, the fill is red. Also at the bottom the total volume change vs the SMA20 is displayed. Green bars means net change is favoring longs, red the opposite. Let me know if you would like to see other additions/changes.

LSX: Mystery BTC strategy with 100% hit rateI said in the main crypto chat, that it was easy to create a BS strategy with a 100% profit rate, so here's the proof.
Looks awesome right? I can promise you, if you trade with this, it will sooner or later blow your account.
Keeping the inner workings of it a secret, just like the scammers do.
Why am I publishing this? To show why investing in these 'mystery strategies' is a terrible idea. That's also why I've hidden the code, so it looks more attractive than it really is.
Say safe, don't get scammed. Don't get rekt.

Explosive PotentialThis script looks at times where MACD is within a specified range (very close to 0 values) and price action is very constrained (under 2%). Historically price has made a strong move after these conditions.
I typically run this on an 8H timeframe.
Review on BTCUSD and other cryptos.

VJ_Volume_Longs_Shorts_IndicatorThe indicator is based on the real-time volume in the market, Macd and Bollinger Band.
Green Bars in the histogram indicate high buy volume and prospective long position
Gray Bars indicate low volume and no trade zone
Red Bars indicate high sell volume and prospective short position
Best used with Bitcoin.
Could use this indicator along with your favorite indicator to get to know the direction of the market with respect to volume and since this is a script, you can set alerts too.
Happy Trading

Bitcoin Kill Zones v2 |7Day| [oscarvs] [xeno]This edit adds weekends to Bitcoin Kill Zones v2 by oscarvs and other contributors. Bit of an experiment. Enjoy.
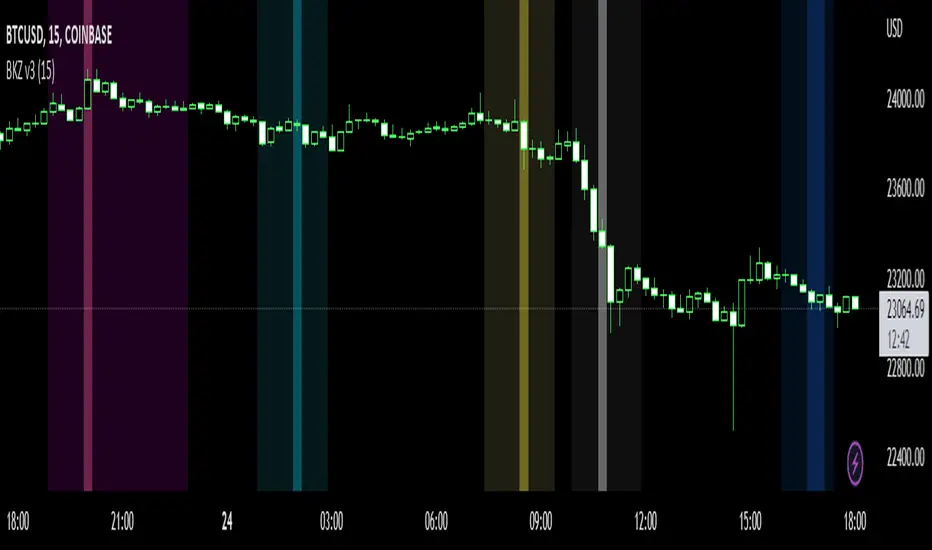
Bitmex Funding BarsFor XBTUSD bitmex perpetual contract. Times adjusted for 1hour chart. Shows the hour before funding in a subtle grey highlight.
-Xeno

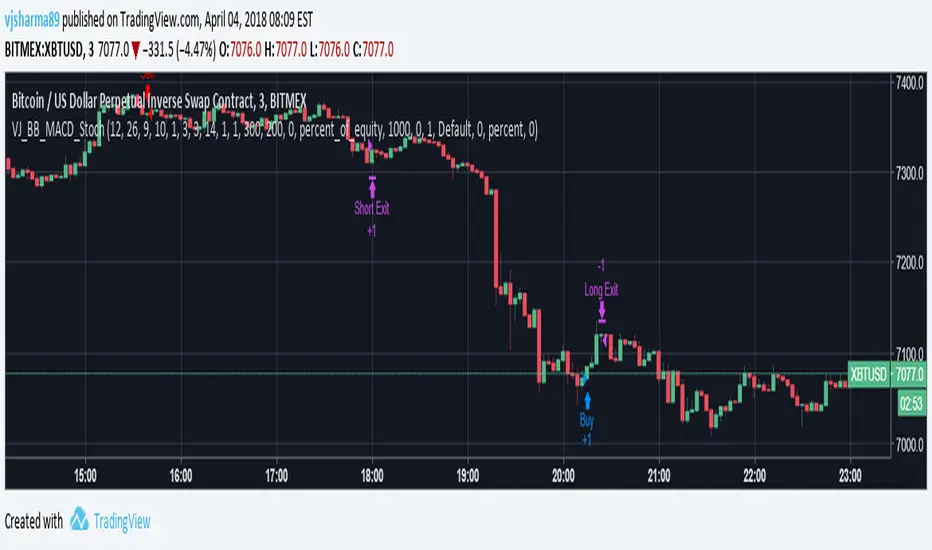
VJSHARMA_BB_MACD_Stoch_Short_Trade_StrategyThis strategy was developed keeping in mind the accuracy of signals. Due to which the time-frame had to be small as in longer timeframe, the probability of a particular movement decreases. The best application of this strategy is with Margin Trading as the signals achieved have really high accuracy.
To get the best out of this strategy, keep in mind the following
1. Choose 3 min time frame
2. Changing the stoploss and trailing stop settings could/would interfere with the accuracy of the trades.
3. Pyramiding affects the profitability of trades.