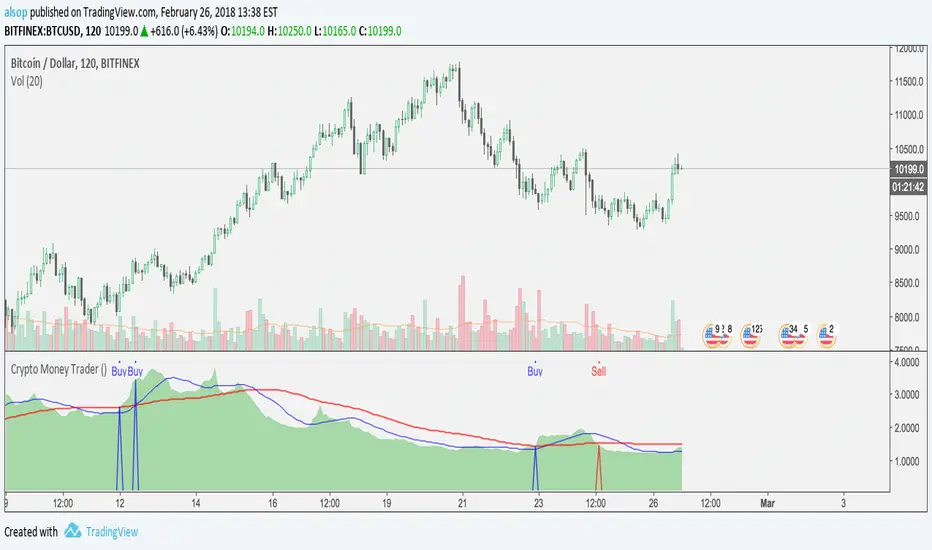
Crypto Money Trader - Indicator for Buy and Sell SignalsThis is it... the one that many have been waiting for.
We have taken everything we have learned from the Crypto Money Index and Crypto Money Bot and combined it into the best indicator possible for trading crypto currencies. This version also includes logic for shorts (sell) and another criteria for longs (buys).
The code is cleaner as well so there is less signal noise and more precise entries.
Before we released this script, we did backtesting on all the current supported USD pairs for optimal results.
Here is one set of results for BTC on 2 hour chats using $5,000 starting balance, 1 trade at once maximum, and 1 contract size:
www.cryptosignalsbot.com
Net Profit: $25,582, 511.64%
Total Trades: 17
Percent Profitable: 70.59%
Profit Factor: 4.304
Maximum Downdraw: $6,629
AvgTrade: $1,504.82, 30.1%
These results get even crazier when you get into settings where you can have 4 trades at once - beyond 700% return... crazy...
The indicator also includes alerts that you can setup so you are aware when a Buy or Sell signal is triggered. Just set an indicator alert for the Trigger Buy or Trigger Sell greater then a value of 0 and you will always know when it is time to look at the charts.
--== STRATEGY ==--
You can combine this indicator with other indicators in your strategy. Many of our most successful users of our previous scripts do just that as it helps them tune a perfect time for an entry.
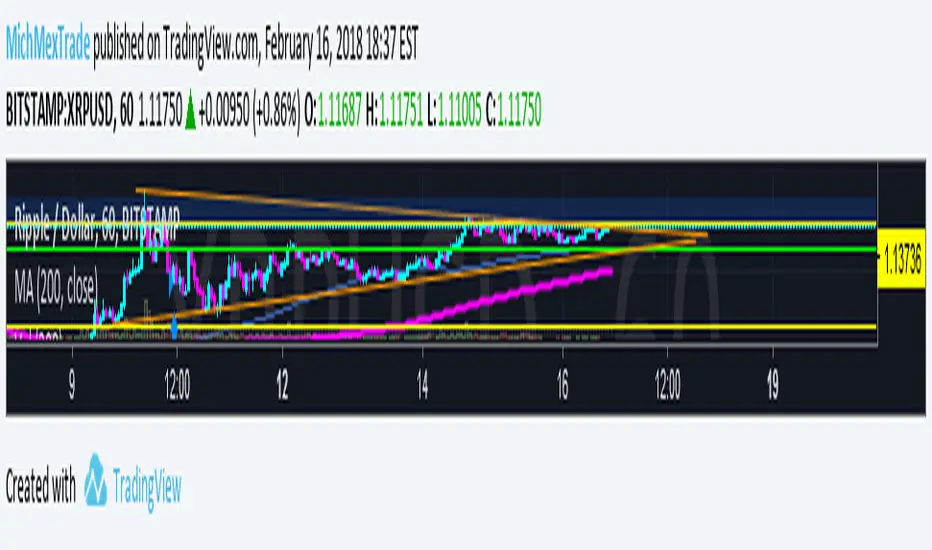
Personally, we use the indicator and simple trendline entries. When a Buy or Sell triggers, draw a trendline and support / resistance lines and enter on a breakout. That's it.
Please note: this is not a "buy it or sell it now" kind of indicator. Sometimes it will signal a few hours early before a move.
--== SUPPORTED PAIRS ==--
We are always adding pairs, but as of February, 2018 this is our supported USD based pairs: BTC, ETH, LTC, XRP, NEO, BCH, IOT, EOS, BTG, ETC, ETP, OMG, EDO, ZEC, XMR, TRX, SAN, DSH, SNG
--== TELEGRAM CHANNEL ==--
All subscribers to this indicator will get access to our Exclusive Telegram Group where all the signals are analyzed and posted for you to see how we are playing the calls. You can either use this to learn how we use the indicator, or to trade from (at your own risk of course).
The alerts are all posted in this channel automatically and only the timeframes with the highest returns from extensive backtests are posted here automatically. However, we will sometimes post analysis on other timeframes as well.
--== BONUS ==--
As a subscriber, not only do you get this amazing indicator, but as a subscriber you will get access to our Crypto Money Index and the Crypto Money Bot
--== ACCESS ==--
Access is simple, go to our new website and register: Crypto Signals Bot
We will work to get you access to everything as quickly as possible. If you have any issues or questions, use the contact form on the website.
1-BTCUSD
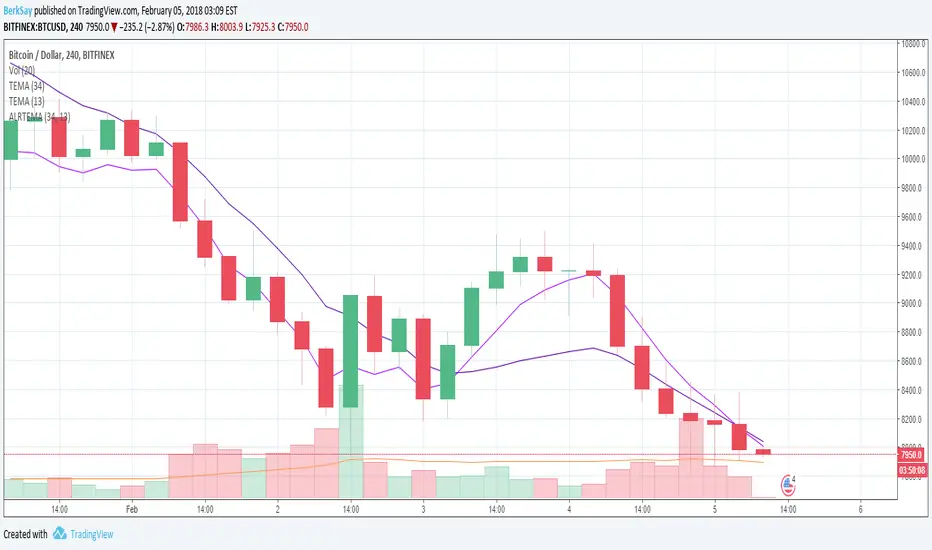
Multiple Moving AverageSuper simple script integrating three moving averages within only one script. It's going to help you to keep your chart cleaner while saving two spots for other indicators you may like. Try it out and let me know what you think.
A possible trading strategy:
Buy/Sell crossover of the MAs. Buy/Sell when fast MA crosses medium MA, double down when medium MA crosses slow MA.
Combining trading strategy is always a good idea.
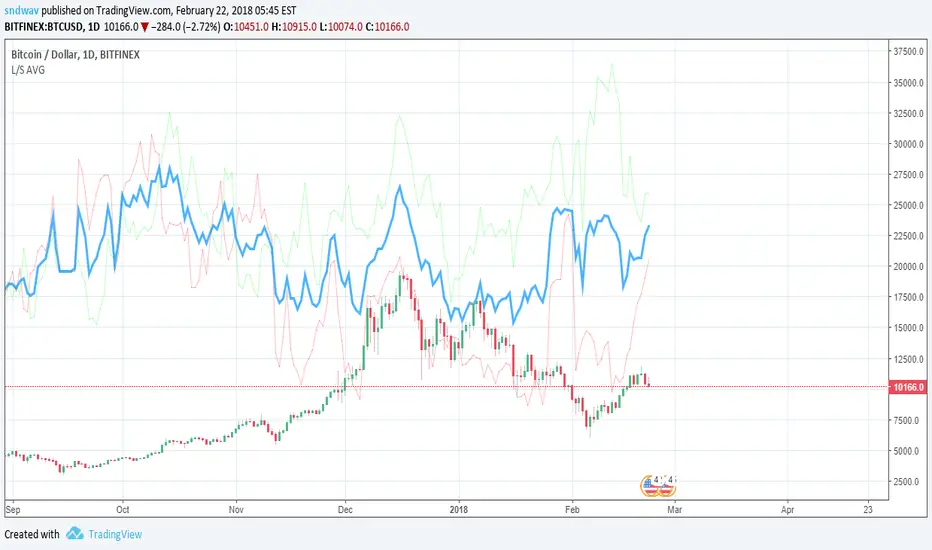
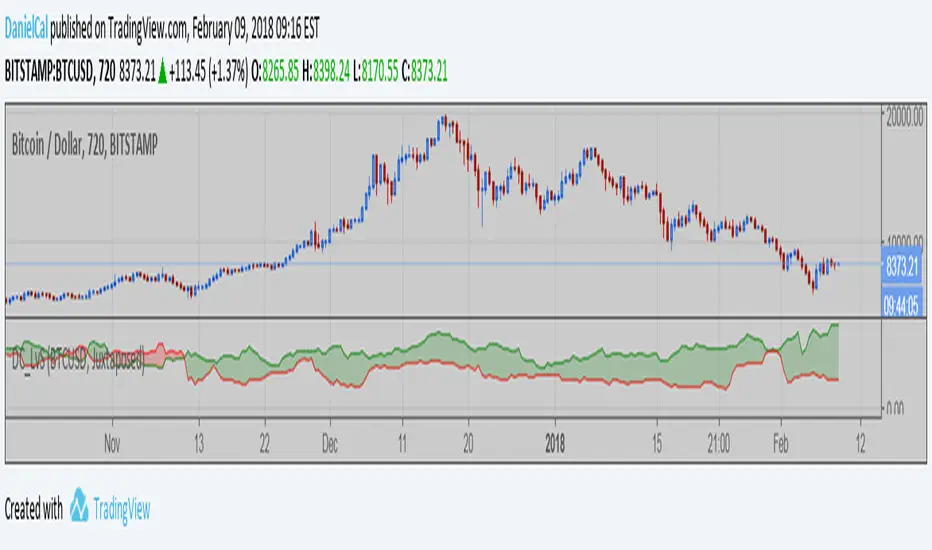
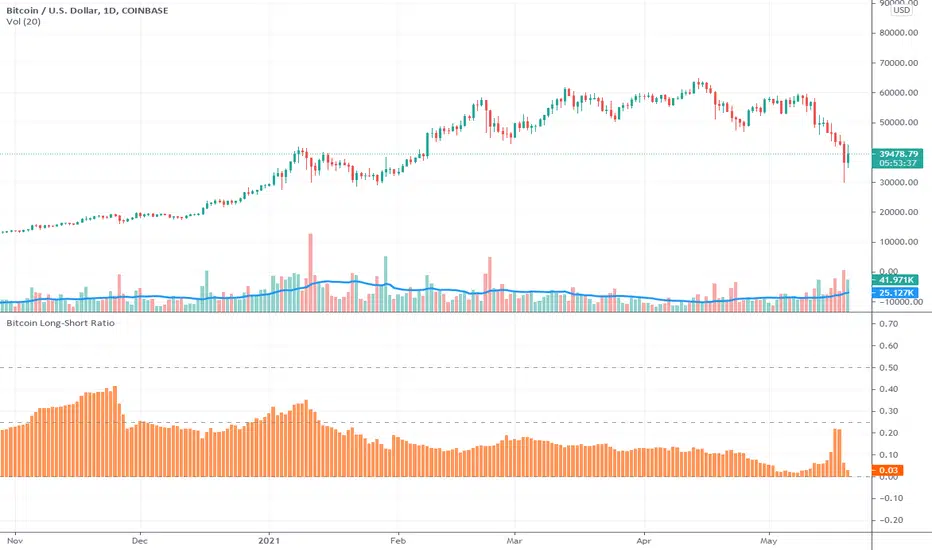
BTCUSD Long/Short Average (By Shimozen)This indicator takes Bitfinex's SHORTS and LONGS charts, and overlays the Average of the 2 on top of the current chart.
This script was created in order to check possible correlations between the Shorts/Longs average and the current BTCUSD price.
MA Cross CriptoEXLSimple Buy and Sell indicator for Cryuptos
Works way better:
XRPUSD - H1
BTCUSD - H4
ETHUSD - H4
With enough patience this indicator can make you good money!
VolumeBars in FiatSimple volume bars indicator for cryptocurrencies that shows their respective volume in fiat.

Margin Longs vs Shorts for BTC ETH & all Bitfinex pairs
Two modes of use...
a) The script detect chart symbol and show corresponding Bitfinex Longs & Shorts (if data exist).
b) You select BTCUSD or ETHUSD Bitfinex Longs & Shorts to show on any chart.
Two comparison views...
a) Juxtaposed: longs and shorts in same direction, side by side. (My preferred view)
b) Counterposed: longs and shorts in opposite polarity, separated by zero line. Another line is plotted representing the difference.
Vortex/SMA IndicatorVortex and SMA indicator, looks at the Metal/Dollar pair as a crypto case study. Wave length and trading correlations for trading pairs or bots.

Top/Bottom Strategy with advanced settingsRecommended for BTCUSD 4H.
-red arrow - sell (strong downtrend)
-purple arrow - week downtrend
-green arrow - buy (strong uptrend)
-blue arrow - week uptrend
-yellow - buy

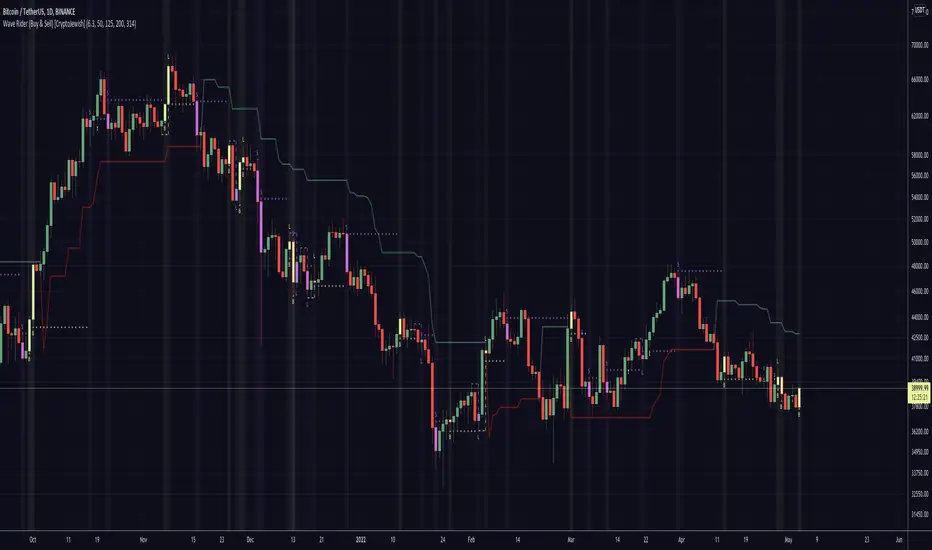
Buy + Sell [CryptoJewish]Beta
This indicator helps identify areas of buying and selling.
There are 4 levels of signals.
1. Weak
2. Medium
3. Strong
4. Extremely strong
Also there is a lagging indicator, which gives a signal of the 2nd level.
Levels greater than 1 are highlighted with a background and the color of the last bar is mixed with the color of the signal.
Almost everything can be turned on / off.
---
Additionally included:
- Ichimoku Cloud with settings for crypto (pure cloud, no extra lines)
- Bollinger Bands
- 4x SMA with a cross between them
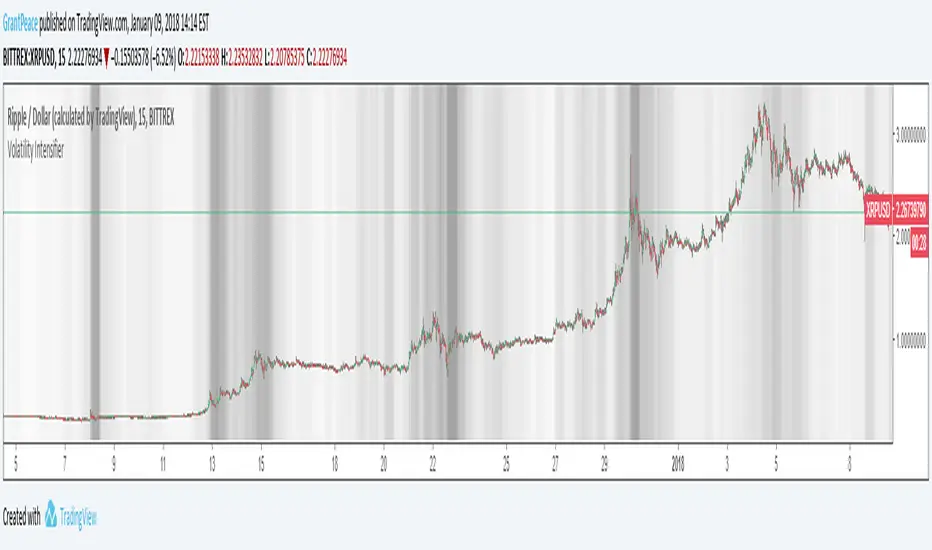
Volatility IntensifierThe background becomes increasingly dark during periods of high volatility.
...and yes, it can get completely black!
This makes it easier to identify areas that are "hot" with price action and appealing to trade.
Follow and comment to be added to the access to this indicator granted every Monday.
Like for more indicators! Thanks to all of my followers, you are the real MVP <3
To clarify; No, this indicator is based off of volatility, NOT volume :)

Crypto Money Bot - Trading Bot for Bitcoin (BTCUSD)This takes my previous script, adds even more logic conditions, and sets up long and short entries in a strategy that can trade.
Default settings with a $5,000 starting balance have shown this bot to get the following results:
Net Profit: $ 10302.70 / 206.05 %
EXAMPLES
LOGIC
This indicator looks for accumulation of buying and selling along with trend flows for oversold and overbought opportunities to align the trade entries. It does not trade all the time, but when it does pull a trade the success rates are higher.
You could choose to pair this with another indicator to do a manual entry, or to manage your stop losses and money management strategy.
PROOF
Check out the reviews on the original indicator that this is built upon (and more logic) is here:
NOTES
You can try this strategy on other charts if you want, it is only tested and supported on BTCUSD. To try it on ETHUSD, change the settings from BTC to ETH. If you get a "resolve_error" it means that specific coin is not supported.
ACCESS
If you'd like to use my custom indicator - send 0.05 BTC to 32Hagdtq7PCR4inF4ZPkCReEjyecm2eNaP then email me at samurai_crypto@protonmail.com with your TradingView username and your transaction ID and I will add you.
Costs are lifetime with full support via email on how to use it.

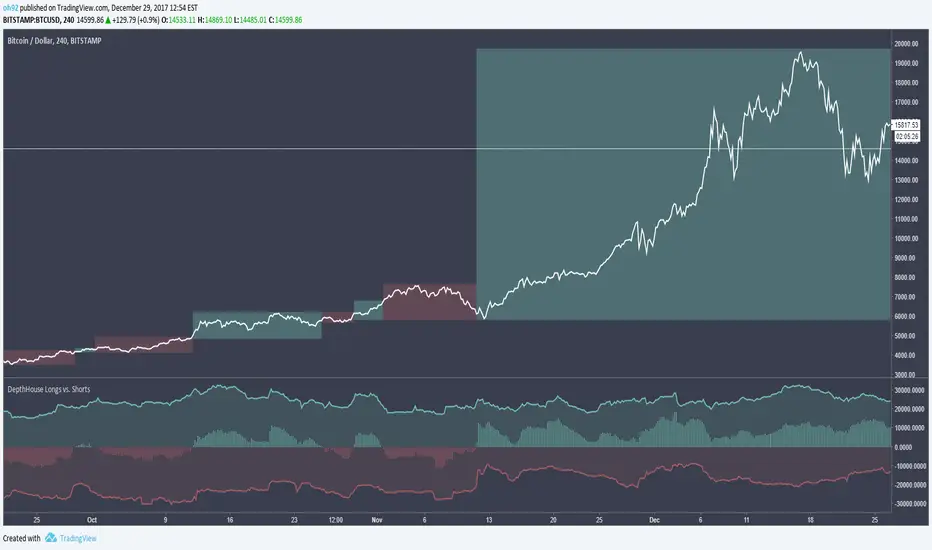
DepthHouse - BTC Longs vs. ShortsDepthHouse - Longs vs. Shorts is a FREE INDICATOR
A very simple indicator that measures the number of Bitcoin Longs and Shorts active in the market.
To help keep these FREE indicators coming:
Please like and comment!
Check out my channel on YouTube! youtu.be
Bitcoin and Ethereum Donations are always appreciated :)
BTC: 1MLnVPqebcFTqYEVAKm9dSCRWhyNDmAb5W
ETH: 0xEEcD7Ce6E22AfA6083074c4CCd326Be0b1C932d9
What it is used for:
This is a great tool to help determine market sentiment.
As you can see, so far it has proven to be very accurate.
However, I do advise caution because this cannot take into count cash trades.
Hope you enjoy!
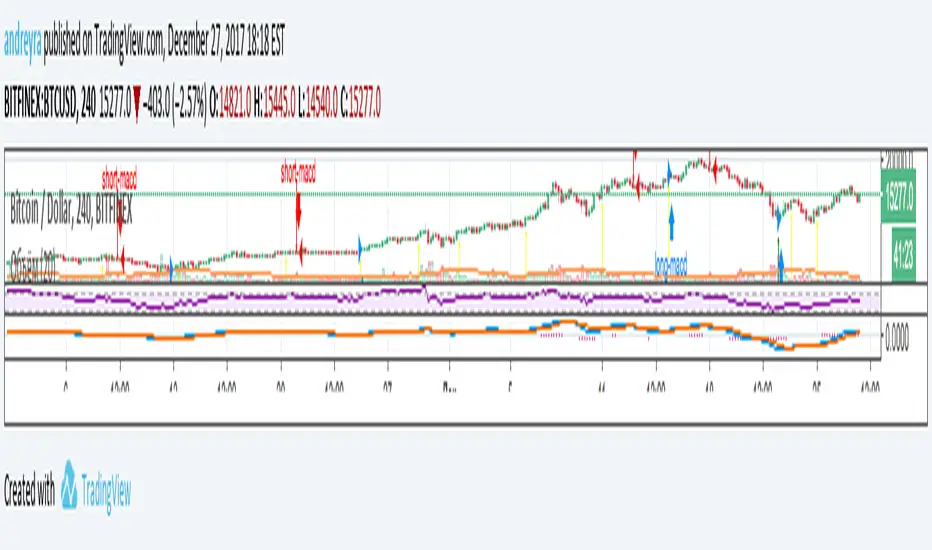
Andrey's Top/Bottom StrategyRecommended for BTCUSD -2.88% 4H.
-red arrow - sell (strong downtrend)
-purple arrow - week downtrend
-green arrow - buy (strong uptrend)
-blue arrow - week uptrend
-yellow - buy
HL MovingAvg2Line Cross Dhananjay
Sharing the simple trend following trading strategy, traders can add their own rules in this, to minimise the losses and maximise the profits. Like below.
1. Go long only if price is above 189 days EMA/SAM
2. Exit position when high or low of previous candle is breached in the opposite direction of the trend.
3. Go long only if price is in up trend on higher time frame charts and go short when price is down trend of higher time frame charts.
Stop loss, target and other things can also be decided by the trader.
Idea is to capture the short term trend to trade in FnO or 2/3 days position in underlying instrument.
Traders can optimise the length of the Moving average so that your traded is set for maximum profit giving settings for this strategy. Different instruments responds to different moving averages because of different volatility.
Idea is to go long when price closes above 9 days EMA of Highs and exit and go short whenever price closes below 9 days EMA of lows, exit short when first condition meets after short trade.
I ma not that good with scripts, have many such ideas, interested script writers can get in touch with me so that we can create trading systems which have grater success rate .

Crypto Money Index - buy Signals for Bitcoin and MoreAn updated version of my previous script, this one includes buy alerts.
It has been tested with Bitcoin (BTC), Monero (XMR), Ethereum (ETH), Dash (DSH), Bitcoin Cash (BCH), LiteCoin (LTC), and IOTA (IOT).
To use for Futures on BitMex (as shown in examples), you need to use the Override feature and set the prefix. For example, Bitcoin futures on BitMex is XBTZ17 - so you would set the override to true and pair to BTC. For Ethereum futures on BitMex, you would turn the override to true and set the pair to ETH.
For USD based pairs (BTCUSD, ETHUSD) it will update automatically.
Ok, on to examples...
Here is how we can see the Bitcoin Cash pump that happened this week BEFORE it happened by seeing price action in the indicator:
Here is a similar example with DASH:
Here is another (again) example with Monero (XMR):
Lastly, IOTA (IOT) with lots of buying signals and double bottoms to play with... regardless if you got in early and rode a small loss for a bit, it popped as well.
ALERTS
To have an alert, create one on the chart and set it based on Trigger being greater than 0.
ACCESS
If you'd like to use my custom indicator - send 0.01 BTC to 32Hagdtq7PCR4inF4ZPkCReEjyecm2eNaP then email me at samurai_crypto@protonmail.com with your TradingView username and your transaction ID and I will add you.
Costs are lifetime with full support via email on how to use it.


Mayer Multiple v2.0 - Klahr ThresholdThis is a simple update to the Mayer Multiple script by Unbound , which charts an indicator created by Trace Mayer and popularized by Preston Pysh.
The original post identified any price below 2.4x the 100-day MA as the BTC buy threshold. While the logic there is historically sound, it does not account for the fact that the BTC trend is parabolic in nature. With that in mind, I've attempted to update the 2.4x multiple to react based on the moving average of the Mayer Multiple itself. To do so, I simply found the number that, when added to the MM moving average, historically hit the 2.4x multiple during periods of low volatility. This turns out to be 1.17.
The green line represents the Klahr Threshold (is it obnoxious if I call it that? I've always wanted an indicator named after me). As you can see from the above chart, it hovers around 2.4x in late 2012 to early 2013, rises above it until mid 2014, and then stays below until 2016. It then stays almost exactly at 2.4x until April 2017, when it rises significantly above it for the first time since July 2014. The convergence in late 2012 and 2016-2017 is what leads me to believe that this should be the basis for the updated threshold.
It's entirely possible that there's a more robust method of calculating a reactive threshold (or a different number that should be added to the multiple's MA), but I think this is a good first step in refining the multiple to withstand the test of time.

BCH / BTC Domination Correlation - FINEXBlue Line shows the BCH dominance of a particular BTC price move.
Blue is fast, orange is slow
This version is the oscillator script of a 2-in-1 overlay + oscillator depending on which plots are enabled.
Use with "Actualized BCH+BTC Price Persistence BITFINEX" - the overlay version of this script.
SNOW_CITY

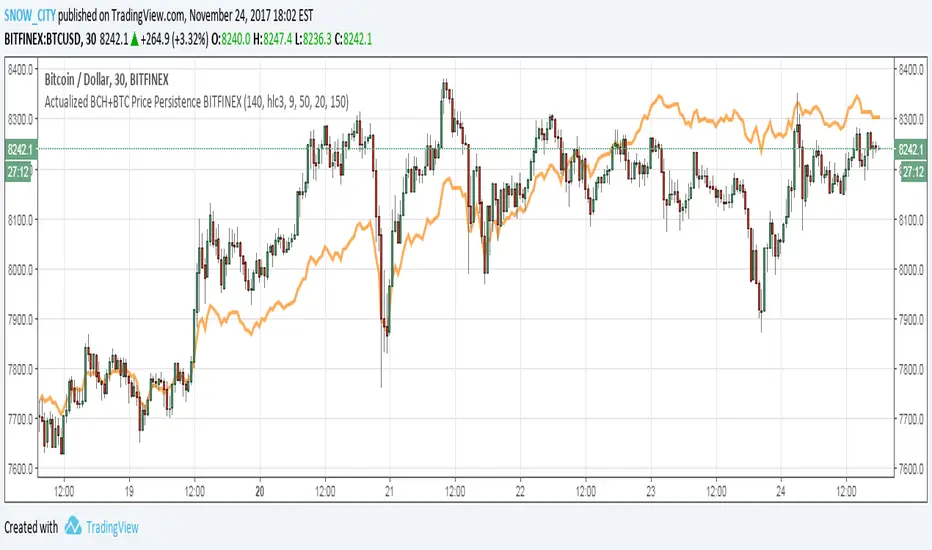
Actualized BCH+BTC Price Persistence BITFINEX
Price Line overlay shows combined BCH+BTC price normalized to the price of BTC, which is the realtime combined price (BCH+BTC) averaged over the SMA of BTC - SMA of BCH.
This indicator is a 2-in-1 overlay + oscillator depending on which plots are enabled.
This version is the overlay script, this is why there are maths that are not used by the plot.
NEED to adjust the SMA Persistence normalization depending on chart resolution.
Use with BCH "Domination Correlation" - the oscillator version of this script.
SNOW_CITY