PpSignal ALMA ADXAlma ADX is a ADX and dmi oscillator in histogram format with alma and linreg internal calculation, yo have 3 line, green not trade, withe transition zone and lime trade zone.
1-BTCUSD
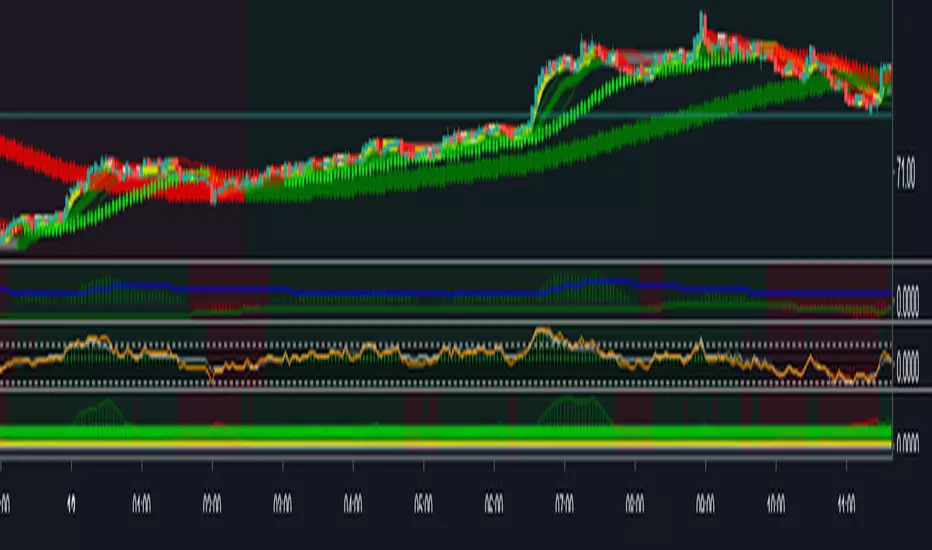
BTC Precognition - Mtrl_Scientist (study version)Hey everyone!
This is the study version of the improved 'BTC - Precognition' algorithm, meaning you'll only see the indicator and not have 'longs/shorts' painted on your chart.
- Works better with normal candles now, as internal calculations are forced to be done on Heikin Ashi, regardless of chosen candle format
- Turned into a study, rather than strategy, as not to interfere with strategies that are already in place
- Added Overbought/Oversold conditions (orange) with adjustable threshold, based on normalized price action helper indicator
Reminder: Only for use with BTCUSD, as it draws data from specific exchanges!
I will also add these changes to the strategy version.
Please let me know what you would like to see improved!

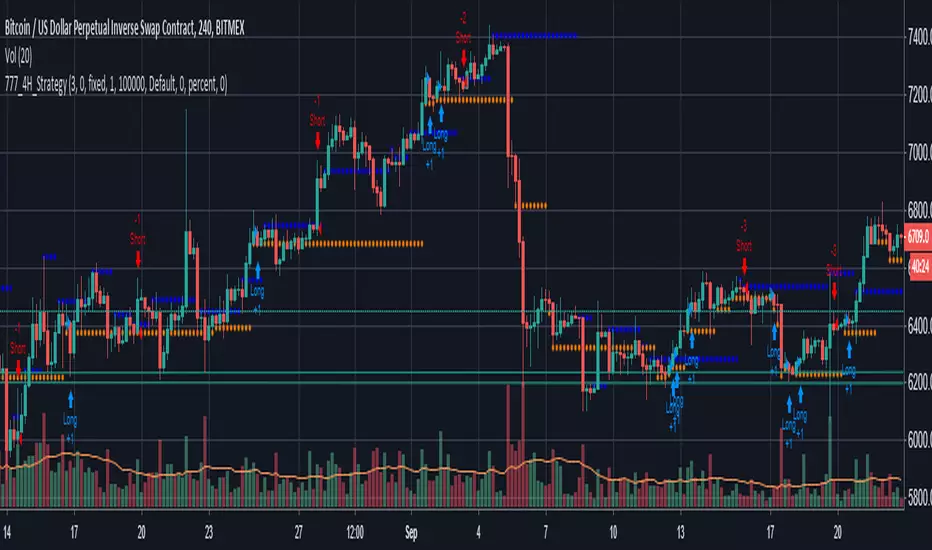
BTC Precognition - Mtrl_ScientistHello Everyone,
I have been interested in algorithmic trading for a while now, and have picked up coding in Python/C++ 2 years ago, which made it possible for me to understand Pine Script (Trading View's proprietary language) fairly easily. I got interested in Bitcoin in 2013, but have only started actually investing in mid 2017. Making money during a bull run is easy but it's really the bear market that teaches you a lesson. So I went about and tried to avoid losses in future bear markets by digging into the analysis of financial time series. I looked around and found useful books, examples of pine script code, technical analyses from fellow chartists and sought out to combine it all into algorithms that can help prevent losses during the next bear market.
I came up with several profitable scripts, but let this be the first one I'm actually sharing with you guys. It draws data from all major Bitcoin exchanges (Hence this script will ONLY work for BTCUSD ) and is based on CVI, Fractal Adaptive Moving Avergage ( FRAMA ), and some calculus operations to make sense of their relationship.
I tried to tidy the final version up as much as possible, so that it becomes straightforward to use. All you need to look at is when the bar becomes green/red, the bar height is just the integrated area since it's crossed the 0-line and can serve as a threshold on lower time frames to avoid noise.
I've got a degree in Chemistry, so don't take this as financial advice, but please do let me know what you think!
Note:
- This is a re-upload because the first version got pulled due to linking to Twitter
- Script works best with Hekin Ashi candles
Planned features:
- Reduce amount of signals on lower time frames
- Make it work better with normal candles
Suggestions?

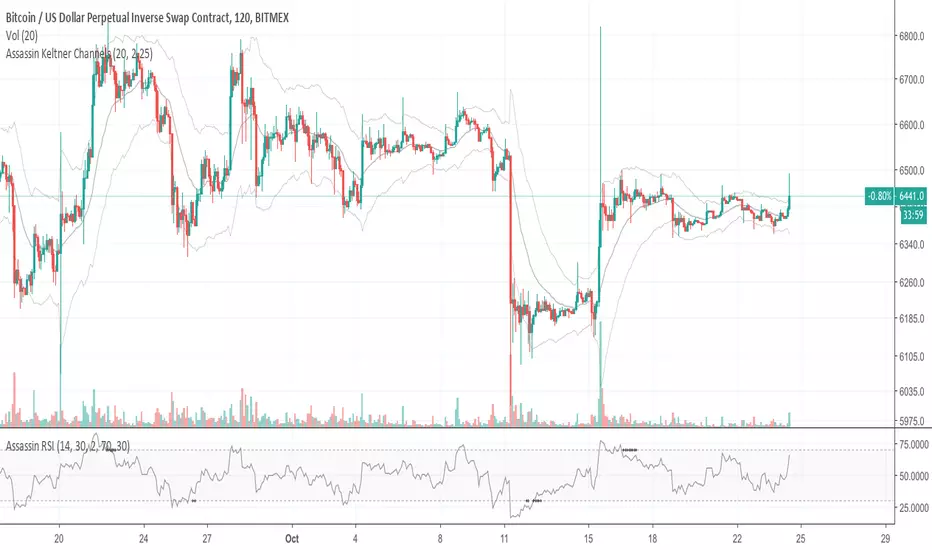
Assassin Stochastic RSIchange from standard Stochastic RSI.
Your can modify the rsi length and the stoch length from input version now.
Calculate divergence from Stochastic RSI move and price move, The divergence mark show at 70/30 line as a little black cross.
add fill color for %k and %d.

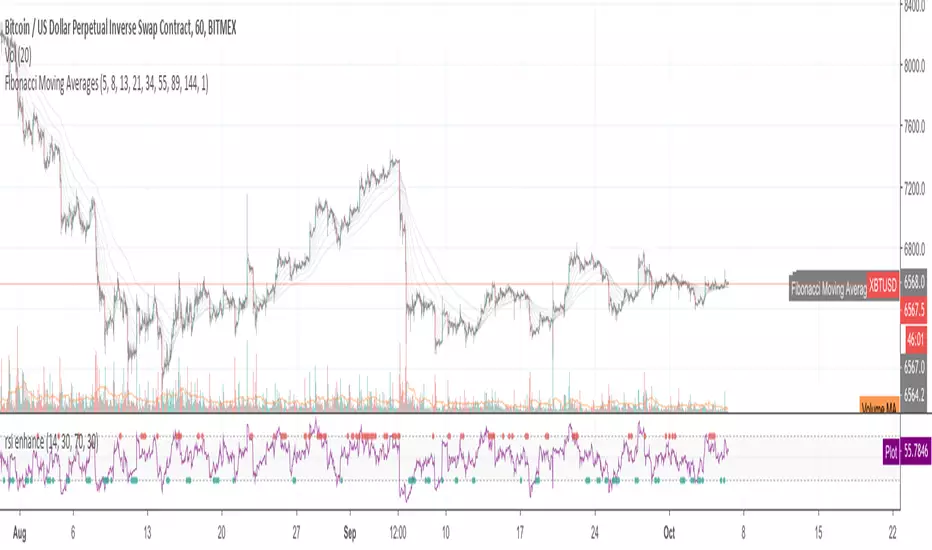
Fibonacci Moving AveragesFibonacci Moving Averages.
use 5、8、13、21、34、55、89、144.
support sma, ema, zeroloag ema.


Satoshi RSI
Custom RSI for Satoshi's friends 😎
Over Bought = 80+
High Line = 60+
Low Line = -40
Over Sold = -20
CHOP ZONE = 40-60
added horizontal points for common valley points
EMA and SMA crossover technique
EMA 5
SMA 21
variables can be changed but this is the standard
RSI crossover EMA5 is a signal and the crossover of the SMA21 is the confirmation vice versa.
although waiting for confirmation may draw from wins.
background is shaded white for bull trend and red for bear.
Colors can be changed
future variants will be released. 🚀

Thoth Utils - Oscillators
"In art he, Thoth, was often depicted as a man with the head of an ibis bird"
999ug
-----
README
Inside:
- No Repaint
- No Lookahead
- Normalized Oscillators -
Hints:
-- Scripts are not for sale or export outside TV.
-- NO Youtube, NO Twitter, NO Telegram!

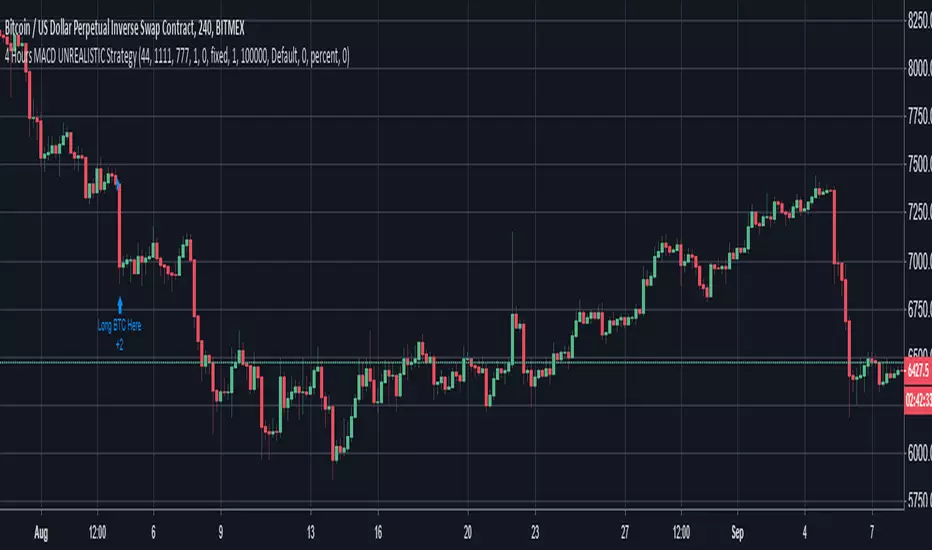
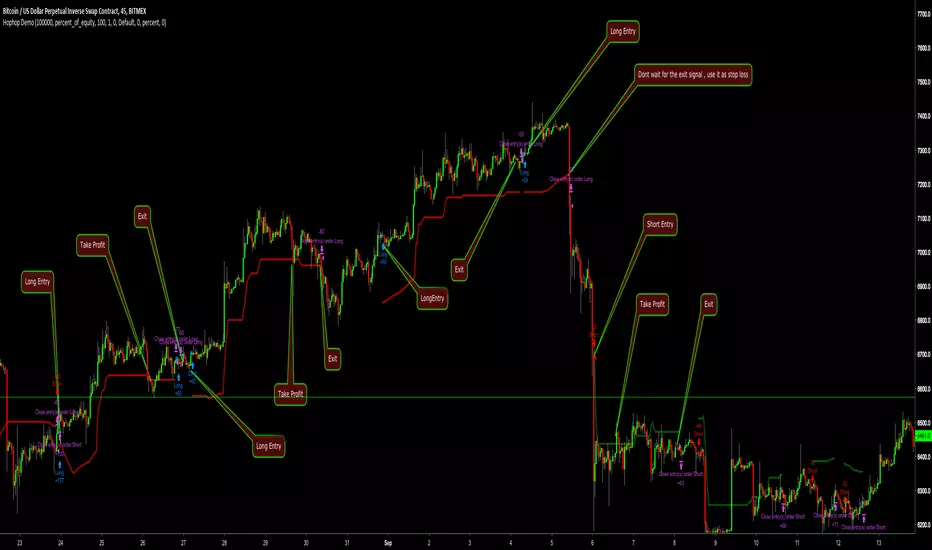
Hophop Strategy DemoThis is the demo of hophop strategy that can only be executed for the pairs and timeframes listed below
"BTCUSD"
"XBTUSD"
"ETHUSD"
"ETHBTC"
"ETHXBT"
"XRPUSD"
"XRPBTC"
"XRPXBT"
"10"
"30"
"45"
"60"
"120"
"240"
I have added dynamic trailing stop loss that can be used as a stop loss when trade is not in profit alternatively you can use it as a take profit points if you don't want to close the trade aggressively
For those who hasnt worked with strategy before
Blue arrow : Long
Red arrow: Short
Purple arrow: Close active trade
if strategy is on a long trade and active trade is in profit, you can use the red line as stop loss or take profit
if strategy is on a long trade and active trade is in loss, you can use the red line as stop loss if active trade hasn't closed already
if strategy is on a short trade and active trade is in profit, you can use the green line as stop loss or take profit
if strategy is on a short trade and active trade is in loss, you can use the green line as stop loss if active trade hasn't closed already
In full version active stop loss/take profit is embedded to strategy and they are configurable according to your risk appetite
Strategy results are for the dates between 01.01.2018 - 01.10.2018 . ( which includes volatile bear market and choppy sideways market )
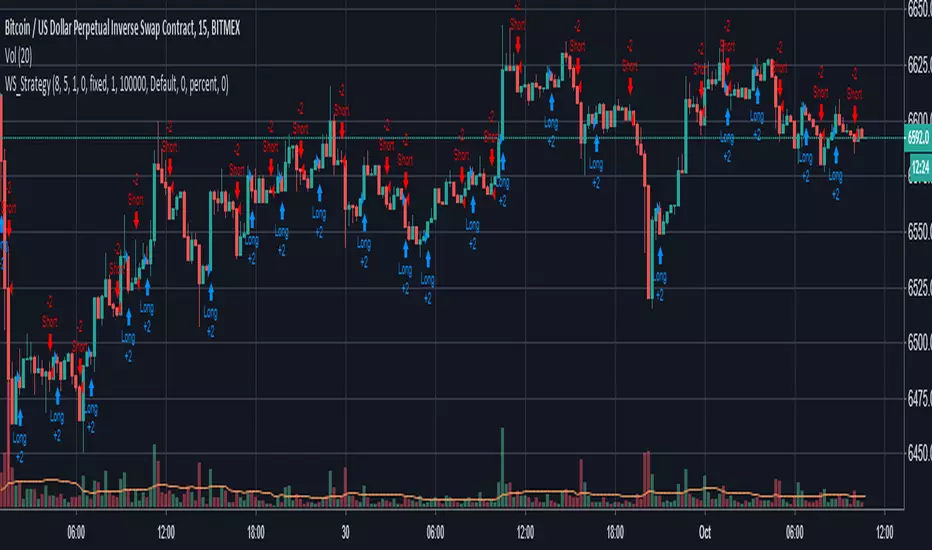
The Wild Storm Trading Strategy - Average of 6 Bars in TradesThis is my Wild Storm trading strategy. A wild storm set of positions taking place with a focus on small quick trades. The ideal strategy for a bot. The strategy is now set to work with the 15min timeframe.
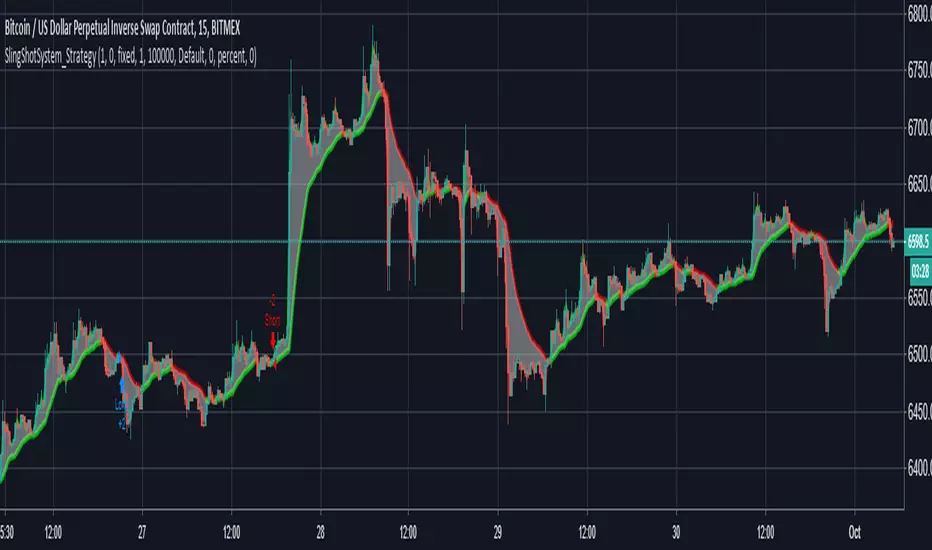
The 15 Minutes SlingShot System StrategyUse this strategy on the 15 Minutes timeframe for maximum profit. Even if the profitability is less than 60%, the profit factor is still above 5 for minimum losses which make it very profitable. The strategy is based on the SlingShot System Study.
The Ultimate TripleX Trading StrategyThe strategy is now set to wor with the 15 Minutes timeframe, but you can adjust it to work with any timeframe.