Trade Like A Sniper - Episode 26 - CNYUSD - (8th June 2024)This video is part of a video series where I backtest a specific asset using the TradingView Replay function, and perform a top-down analysis using ICT's Concepts in order to frame ONE high-probability setup. I choose a random point of time to replay, and begin to work my way down the timeframes. Trading like a sniper is not about entries with no drawdown. It is about careful planning, discipline, and taking your shot at the right time in the best of conditions.
A couple of things to note:
- I cannot see news events.
- I cannot change timeframes without affecting my bias due to higher-timeframe candles revealing its entire range.
- I cannot go to a very low timeframe due to the limit in amount of replayed candlesticks
In this session I will be analyzing CNYUSD, starting from the 4-Month chart.
If you want to learn more, check out my other videos on TradingView or on YT.
If you are interested in private coaching, feel free to get in touch via one of my socials.
Analysis

Trade Like A Sniper - Episode 26 - QQQ - (8th June 2024)This video is part of a video series where I backtest a specific asset using the TradingView Replay function, and perform a top-down analysis using ICT's Concepts in order to frame ONE high-probability setup. I choose a random point of time to replay, and begin to work my way down the timeframes. Trading like a sniper is not about entries with no drawdown. It is about careful planning, discipline, and taking your shot at the right time in the best of conditions.
A couple of things to note:
- I cannot see news events.
- I cannot change timeframes without affecting my bias due to higher-timeframe candles revealing its entire range.
- I cannot go to a very low timeframe due to the limit in amount of replayed candlesticks
In this session I will be analyzing Investco QQQ Trust (QQQ), starting from the 4-Month chart.
If you want to learn more, check out my other videos on TradingView or on YT.
If you are interested in private coaching, feel free to get in touch via one of my socials.

Trade Like A Sniper - Episode 25 - BABA - (8th June 2024)This video is part of a video series where I backtest a specific asset using the TradingView Replay function, and perform a top-down analysis using ICT's Concepts in order to frame ONE high-probability setup. I choose a random point of time to replay, and begin to work my way down the timeframes. Trading like a sniper is not about entries with no drawdown. It is about careful planning, discipline, and taking your shot at the right time in the best of conditions.
A couple of things to note:
- I cannot see news events.
- I cannot change timeframes without affecting my bias due to higher-timeframe candles revealing its entire range.
- I cannot go to a very low timeframe due to the limit in amount of replayed candlesticks
In this session I will be analyzing Alibaba (BABA), starting from the 6-Month chart.
If you want to learn more, check out my other videos on TradingView or on YT.
If you are interested in private coaching, feel free to get in touch via one of my socials.

Trade Like A Sniper - Episode 21 - INTC - (7th June 2024)This video is part of a video series where I backtest a specific asset using the TradingView Replay function, and perform a top-down analysis using ICT's Concepts in order to frame ONE high-probability setup. I choose a random point of time to replay, and begin to work my way down the timeframes. Trading like a sniper is not about entries with no drawdown. It is about careful planning, discipline, and taking your shot at the right time in the best of conditions.
A couple of things to note:
- I cannot see news events.
- I cannot change timeframes without affecting my bias due to higher-timeframe candles revealing its entire range.
- I cannot go to a very low timeframe due to the limit in amount of replayed candlesticks
In this session I will be analyzing Intel (INTC), starting from the 6-Month chart.

A Practical Guide For Candlestick Patterns!Intraday trading is a method of investing in cryptocurrencies where the trader buys and sells cryptocurrencies on the same day without any open positions left by the end of the day. Intraday traders aim to either purchase a cryptocurrency at a low price and sell it at a higher price or short-sell a cryptocurrency at a high price and buy it at a lower price within the same day. This requires a good understanding of the market and relevant information to help them make the right decisions. In the cryptocurrency market, the price of a cryptocurrency is determined by its demand and supply, among other factors.
Tools such as candlestick chart patterns are very helpful to traders. We will discuss these candlestick charts and offer steps to help you read them.

Trade Like A Sniper - Episode 14 - US10Y - (3rd June 2024)This video is part of a video series where I backtest a specific asset using the TradingView Replay function, and perform a top-down analysis using ICT's Concepts in order to frame ONE high-probability setup. I choose a random point of time to replay, and begin to work my way down the timeframes. Trading like a sniper is not about entries with no drawdown. It is about careful planning, discipline, and taking your shot at the right time in the best of conditions.
A couple of things to note:
- I cannot see news events.
- I cannot change timeframes without affecting my bias due to higher-timeframe candles revealing its entire range.
- I cannot go to a very low timeframe due to the limit in amount of replayed candlesticks
In this session I will be analyzing US10Y, starting from the 3-Month chart.
- R2F

Trade Like A Sniper - Episode 13 - AUDNZD - (3rd June 2024)This video is part of a video series where I backtest a specific asset using the TradingView Replay function, and perform a top-down analysis using ICT's Concepts in order to frame ONE high-probability setup. I choose a random point of time to replay, and begin to work my way down the timeframes. Trading like a sniper is not about entries with no drawdown. It is about careful planning, discipline, and taking your shot at the right time in the best of conditions.
A couple of things to note:
- I cannot see news events.
- I cannot change timeframes without affecting my bias due to higher-timeframe candles revealing its entire range.
- I cannot go to a very low timeframe due to the limit in amount of replayed candlesticks
In this session I will be analyzing AUDNZD, starting from the 12-Month chart.
- R2F

Trade Like A Sniper - Episode 12 - GBPAUD - (1st June 2024)This video is part of a video series where I backtest a specific asset using the TradingView Replay function, and perform a top-down analysis in order to frame ONE high-probability setup. I choose a random point of time to replay, and begin to work my way down the timeframes. Trading like a sniper is not about entries with no drawdown. It is about careful planning, discipline, and taking your shot at the right time in the best of conditions.
A couple of things to note:
- I cannot see news events.
- I cannot change timeframes without affecting my bias due to higher-timeframe candles revealing its entire range.
- I cannot go to a very low timeframe due to the limit in amount of replayed candlesticks
In this session I will be analyzing GBPAUD, starting from the 12-Month chart.
- R2F

Trade Like A Sniper - Episode 10 - EURJPY - (31st May 2024)This video is part of a video series where I backtest a specific asset using the TradingView Replay function, and perform a top-down analysis in order to frame ONE high-probability setup. I choose a random point of time to replay, and begin to work my way down the timeframes. Trading like a sniper is not about entries with no drawdown. It is about careful planning, discipline, and taking your shot at the right time in the best of conditions.
A couple of things to note:
- I cannot see news events.
- I cannot change timeframes without affecting my bias due to higher-timeframe candles revealing its entire range.
- I cannot go to a very low timeframe due to the limit in amount of replayed candlesticks
In this session I will be analyzing EURJPY, starting from the 6-Month chart.
- R2F

Trade Like A Sniper - Episode 9 - NQ1- (31st May 2024)This video is part of a video series where I backtest a specific asset using the TradingView Replay function, and perform a top-down analysis in order to frame ONE high-probability setup. I choose a random point of time to replay, and begin to work my way down the timeframes. Trading like a sniper is not about entries with no drawdown. It is about careful planning, discipline, and taking your shot at the right time in the best of conditions.
A couple of things to note:
- I cannot see news events.
- I cannot change timeframes without affecting my bias due to higher-timeframe candles revealing its entire range.
- I cannot go to a very low timeframe due to the limit in amount of replayed candlesticks
In this session I will be analyzing E-mini NASDAQ, starting from the Weekly chart.
- R2F

[EDU-Bite Sized Mini Series] When to trade for best bang for $$?Hello fellow traders , my regular and new friends!
Welcome and thanks for dropping by my post.
Okay, let's get started on today's topic. Knowing when to trade and when NOT to trade is very important. This is the "timing" element which is also a crucial part of trading. And, this is especially important if you are looking to trade on a lower timeframe!
Understanding the different trading sessions in the forex market and identifying the best times and days to trade can significantly improve trading success. Here's a breakdown of the major forex trading sessions and their characteristics:
Asian Session (Tokyo/Singapore/Hong Kong):
The Asian session begins with the opening of the Tokyo market, though the AUD and NZD starts trading earlier than it. It's known for lower volatility compared to other sessions, with currency pairs like USD/JPY and AUD/USD often experiencing increased activity.At times, if there's a important news release such as FED interest rate release or Non- farm payroll on a Friday. The preceding Asian Session could have "spill over" activity and increased in volatility in the FX market.
European Session (London):
The European session, centered around London, is considered the most active session (besides the US). It often sees high liquidity and volatility, making it ideal for day traders. Major currency pairs like EUR/USD, GBP/USD, and EUR/GBP typically exhibit significant movements during this session.
3. North American Session (New York):
The North American session overlaps with the end of the European session, creating a period of increased activity. Day traders loved the volatility during this period of time, more over key news releases could be catalyst for further volatility. It's characterized by liquidity from both European and American traders. Currency pairs involving the USD, such as EUR/USD, USD/JPY, and GBP/USD, are particularly active.
4. Best Times to Trade:
To be specific, the best times to trade forex are typically during the overlap of multiple trading sessions when liquidity and volatility are highest. This occurs during the overlap of the European and North American sessions, known as the "London-New York" overlap, which occurs from 8:00 AM to 12:00 PM EST. Another optimal period is during the overlap of the Asian and European sessions.
Best Days to Trade
While forex markets are open 24 hours a day, five days a week, certain days tend to offer more trading opportunities. Tuesday, Wednesday, and Thursday are generally considered the best days to trade, as they typically see higher volatility and more significant price movements compared to Mondays and Fridays.
By understanding the characteristics of each trading session and identifying the optimal times and days to trade, you can enhance your trading strategies and capitalize on the most favorable market conditions.
Do check out my recorded video (in trading ideas) for the week to have more explanation in place.
Do Like and Boost if you have learnt something and enjoyed the content, thank you!
-- Get the right tools and an experienced Guide, you WILL navigate your way out of this "Dangerous Jungle"! --
*********************************************************************
Disclaimers:
The analysis shared through this channel are purely for educational and entertainment purposes only. They are by no means professional advice for individual/s to enter trades for investment or trading purposes.
*********************************************************************

Implementing SEASONAL TENDENCIESHi guys,
In this video I go through what are "seasonal tendencies", and how you can implement it into your analysis and strategy(ies).
Seasonal tendencies in the context of financial markets are basically what the particular market or asset has historically done throughout the years in terms of bullish or bearish movement. For example, in April-May the US Dollar is usually bearish, and from May-June it is usually bullish. This is useful information because it can add confluence to your bias/analysis. However, you do not want to solely use this information as a reason to get into a trade. The data is based on the past, and is not indicative to the present/future and also does not represent how much a market or asset can move because the data is only measured relative to what it has previously done. The best approach is to use this as an additional thumbs up if it coincides with your analysis, and if it does, then it allows you to be a bit more cautious or risk averse.
A simple analogy is the weather. If you were planning a holiday to Thailand for a sunny getaway, the best times would be from March to July. Most likely you are not going to book a holiday in November during the monsoon season, unless you actually wanted it to rain every day. However, some years have had very little to no rain during the monsoon season. That being said, you would most likely choose to go during a time that seasonally has hot and sunny weather. This is how you can use seasonal tendencies to add an additional layer to your analysis.
I hope that was insightful and gave you some ideas to test if you've never heard of seasonal tendencies. You can implement this both as a technical or fundamental analyst (or both).
Til next time, happy trading.
- R2F

DOUBLE BOTTOMThe double bottom pattern is a technical analysis chart pattern that appears during a downtrend and indicates a possible trend reversal. It is formed by two consecutive lows that are approximately equal and separated by a peak in between
LIKE SHARE FOLLOW US

TYPES OF MARKET ANALYSIS1) Fundamental analysis.
fundamental analysis focus mainly on micro and macro event that will control market situations in the present and in the future. it includes various events in economic calendar like PPI CPI NonFarm Payroll, Interest rate decisions, and geopolitical senarios like election war climate issues etc
2) Technical analysis.
Technical analysis mainly focus on indicators chart analysis volume analysis, various analysis like following candle stick pattern, trading strategies based on indicators
3) Market sentiments
Market sentiments focus mainly on how the crowd anticipate wheich direction will market go, like when xauusd reached at its all time top everyone believed it will have a retracement from that zone
like share and follow us for more such informative contents

How Many Monitors Do YOU Need? - R2F's Professional OpinionHi everyone,
I get this question occasionally, so I figured I would share my opinion on the matter.
There are many misconceptions about trading or being a professional trader. One of them is, the more monitors you have, the more successful or advanced you are as a trader. That is complete nonsense. In this video I explain what I think the best number of monitors is to have, and hopefully give you some insight into what works for you.
At the end of the day, trading is a personal endeavor and not a one-size-fits-all. Always start with the least, and scale from there, which is the same way you should approach the growth of your trading wealth.
- R2F

The 3-Step Method For High-Quality AnalysisIn this video I give you the 3-step method I use to do my analysis.
By incorporating these steps, it is also how I do my top-down analysis. You can think of it as a checklist as well.
First, I have my Bias, which determines where I believe price is drawn to. For example in the case of SMC/ICT Concepts, we observe where the liquidity is in the market and use that to frame where price is likely going to go to sooner or later.
Secondly, I have my Narrative, which is on a lower timeframe, and paints the picture of HOW price is going to form in order to initiate the move to that price target. This usually includes more engineered liquidity on lower timeframes, and manipulation to happen.
Thirdly, I have my Confirmation, which is where I want to enter a trade. This is the lowest of the three timeframes, and is the final point in which I will frame a trade setup. Usually I will look for the exact same things I look for in my Bias and Narrative, but on this timeframe. I also tend to include the factor of time, such as Killzones, Seasonality, and News Drivers.
Note that the timeframes can be anything you want them to be, and you are not restricted from moving from timeframe to timeframe. But, the important thing is to be consistent with WHERE you believe price is going, HOW you think it may get there (this can change as price forms), and again WHERE you are going to enter a trade.
- R2F

Trade Like a Sniper - Episode 4 - XAGUSD - (10th May 2024)This video is part of a video series where I backtest a specific asset using the TradingView Replay function, and perform a top-down analysis in order to frame ONE high-probability setup. I choose a random point of time to replay, and begin to work my way down the timeframes. Trading like a sniper is not about entries with no drawdown. It is about careful planning, discipline, and taking your shot at the right time in the best of conditions.
A couple of things to note:
- I cannot see news events.
- I cannot change timeframes without affecting my bias due to higher-timeframe candles revealing its entire range.
- I cannot go to a very low timeframe due to the limit in amount of replayed candlesticks
In this session I will be analyzing XAGUSD, starting from the Monthly chart.
- R2F

"The Bodies Tell The Story.. The Wicks Do The Damage" - ICTIn this video I'm going to go through one of ICT's most famous sayings, which is "The bodies tell the story, and the wicks do the damage". If haven't taken the time to understand what he means, then you are seriously putting yourself at a disadvantage if you are using his concepts. This is one of the most crucial and useful pieces of the ICT puzzle. You often hear him say that the wicks are painting outside of the lines, which he sees as permissable when he is trading his PD Arrays. So without further ado, I'll try my best to provide some insight.
For illustrative purposes I'll use his Market Maker Sell Model. Just to note that this is not a video teaching about his market maker models, so the focus will not be on that or his other concepts. If you don't understand a certain term or concept, please check out ICT's YouTube Channel or the countless other resources online. This video will be predominantly shedding some light on candle bodies and wicks.
I urge you to go into your own charts and do your own study. This will truly be something eye opening if it is the first time you've actually decided to take notice.
- R2F

Trading is execution - USD/JPY Live trading exampleThis is a short mentoring/educational session.
The USD/JPY is the pair we are trading this evening, I analyse this based on the mtf wave structure.
I explained the importance of the secondary trend, as a determinant tool or information for what may happen in the future.
I also shared one of my waves of success strategy using the DMI and the VMP for trade execution.
Finally, after taking the trade, I explained late Mark Douglas probabilistic principles which acts as a solid foundation of our behaviour and interaction with the market.

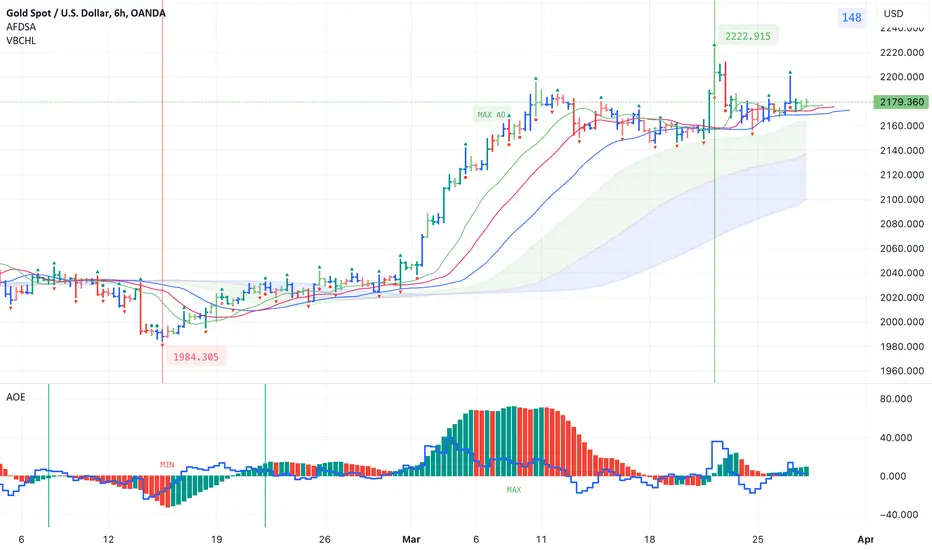
Indicators for trading using Bill Williams' Profitunity strategyI published 3 indicators for trading using Bill Williams' Profitunity strategy. For each indicator, I have added a visual and detailed description in English and Russian. In this post I will briefly describe these indicators and how I use them together.
AFDSA indicator (Alligator + Fractals + Divergent & Squat Bars + Signal Alerts)
Includes Williams Alligator, Williams Fractals, Divergent Bars, Market Facilitation Index, Highest and Lowest Bars, maximum or minimum peak of the Awesome Oscillator, and signal alerts based on Bill Williams' Profitunity strategy:
Bullish and Bearish Divergent Bar Signal + Squat Bar + Green Bar + Fake Bar + Awesome Oscillator Color Change + AO Divergence.
Crossing the green line (Lips) of an open Alligator.
Formation of a fractal.
Signal about the breakdown of the last upper or lower fractal.
Signal about the appearance of a new maximum or minimum peak of AO in the interval of 140 bars from the last bar.
I also added an Alligator display for the higher timeframe, for example, if the chart timeframe is 1 hour, then the higher timeframe will automatically be 4 hours, if the chart timeframe is 4 hours, then the higher timeframe will be 1 day, etc.
AOE Oscillator (Awesome Oscillator + Bars count lines + EMA Line)
Includes the Awesome Oscillator with two vertical lines at a distance of 100 and 140 bars from the last bar to determine the third Elliott wave by the maximum peak of AO in the interval from 100 to 140 bars according to Bill Williams' Profitunity strategy. Additionally, a faster EMA line is displayed.
I also added display of the AO line for the lower timeframe instead of the EMA line if the Moving Average Line values (method, length and source) are equal to the Awesome Oscillator values in the indicator settings. For example, if the chart timeframe is 1 day, then the lower timeframe will automatically be 4 hours, if the chart timeframe is 4 hours, then the lower timeframe will be 1 hour, etc.
VBCHL indicator (Visible bars count on chart + highest/lowest bars, max/min AO)
The indicator displays the number of visible bars on the screen, including the prices of the highest and lowest bars, the maximum or minimum value of the Awesome Oscillator. The values change dynamically when scrolling or changing the scale of the chart, but with a delay of several seconds, so this feature is included in a separate indicator so as not to slow down the work of other indicators.
Indicator settings
In the AFDSA indicator I use the following settings:
By default, the Squat Bar is colored blue, and all other bars are colored to match the Awesome Oscillator color, except for the Fake bars, which are colored with a lighter AO color. But I also enable the display of "Green" Divergent bars in the "Green Bars > Show" field.
I enable the display of Alligator for higher timeframes in the "Alligator for higher timeframe > Enable" field.
In the indicator style settings, I disable the display of the highest and lowest bars, maximum and minimum AO peak labels, because these labels are also displayed by the VBCHL indicator depending on the number of visible bars in the chart window.
Only after opening a position, I enable all additional alerts in the “Enable all additional alerts” field (after changing this field, you need to re-create the alert for the current chart): crossing the green line of an open Alligator, formation of a fractal, appearance of a new maximum or minimum AO peak.
In the settings of the AOE oscillator, I enable the display of the AO line for the lower timeframe instead of the EMA line, setting the same values in the fields for the Moving Average Line (method, length and source) and Awesome Oscillator.
In the VBCHL indicator settings, I only enable the simple display text style for labels in the "Simple display text style for labels" field.
As a result, when analyzing the current chart, I immediately see all the signals on the chart, the location of the bars relative to the Alligator on the higher timeframe and changes in the Awesome Oscillator on the lower timeframe. And thanks to the VBCHL indicator, I quickly select the desired timeframe for analyzing the 5-wave Elliott impulse, focusing on the interval of 140 bars, and immediately see whether there is divergence between the maximum AO peak and the following lower AO peak in this interval.
Understanding the Differences Between Stock Market and Crypto P2Thank you very much for your support, as I told when we will get 20+ likes on Part 1, than I will make Part 2. Here you get the summary of each, with the other points:
10. Market Infrastructure: The infrastructure supporting traditional stock markets, including trading platforms, clearing systems, and market data providers, is well-established and interconnected, whereas the infrastructure for the crypto market is still evolving and fragmented, with multiple competing platforms and protocols.
11. Market History: Traditional stock markets have a long history dating back centuries, with well-documented market cycles and economic trends, whereas the crypto market has a relatively short history, with significant price movements driven by technological developments and market speculation.
12. Regulation of Investment Products: Traditional stock markets offer a wide range of investment products, including stocks, bonds, mutual funds, and exchange-traded funds (ETFs), all subject to regulatory oversight, whereas the crypto market primarily offers cryptocurrencies and tokenized assets with varying degrees of regulatory clarity.
13. Market Correlation: Stocks and traditional financial assets often exhibit correlations with broader economic indicators such as GDP growth and interest rates, whereas the crypto market may demonstrate correlations with factors such as Bitcoin dominance, market sentiment, and technological developments.
14. Market Participants: Traditional stock markets attract a diverse range of participants, including retail investors, institutional investors, hedge funds, and pension funds, whereas the crypto market has a more diverse participant base, including retail traders, technology enthusiasts, speculators, and early adopters of blockchain technology.
15. Market Fragmentation: The stock market operates as a unified marketplace with standardized trading rules and regulations, whereas the crypto market is fragmented across multiple exchanges, each with its own trading protocols, liquidity pools, and pricing mechanisms.
16. Market Impact of News Events: News events such as corporate earnings releases, economic data reports, and geopolitical developments have a significant impact on stock market movements, whereas the crypto market may react more strongly to news related to regulatory developments, technological advancements, and adoption trends.
17. Market Efficiency: The efficiency of traditional stock markets is supported by established trading mechanisms, liquidity providers, and market makers, leading to relatively stable price discovery and reduced arbitrage opportunities, whereas the crypto market may experience inefficiencies due to lower liquidity, market manipulation, and regulatory uncertainties.
Stock Market:
Pros:
Stability: Stock markets have a long history and are generally stable investment options.
Regulation: They are heavily regulated, providing a level of security for investors.
Diversification: Investors can choose from a wide range of stocks across various sectors and industries.
Dividends: Many stocks offer dividends, providing a source of passive income.
Access to Information: There is a wealth of financial information available for analysis and research.
Cons:
Limited Trading Hours: Stock markets operate during specific hours on weekdays, limiting trading opportunities.
High Entry Barriers: Some stocks may require a significant investment, making it inaccessible for small investors.
Market Volatility: While generally stable, stock markets can still experience significant volatility during economic downturns or market crises.
Slow Settlement: Settlement times for stock transactions can take several days, delaying access to funds.
Limited Accessibility: Access to certain stocks may be restricted based on geographical location or regulatory requirements.
Crypto Market:
Pros:
24/7 Trading: Cryptocurrency markets operate 24/7, allowing for round-the-clock trading.
Accessibility: Anyone with internet access can participate in the crypto market, promoting inclusivity.
Potential for High Returns: The crypto market has seen explosive growth, offering the potential for high returns on investment.
Decentralization: Cryptocurrencies operate on decentralized networks, reducing dependency on centralized authorities.
Technological Innovation: The crypto market is at the forefront of technological innovation, with developments in blockchain and decentralized finance (DeFi).
Cons:
Volatility: Cryptocurrencies are highly volatile and can experience rapid price fluctuations.
Lack of Regulation: Regulatory uncertainty in the crypto market can lead to investment risks and market manipulation.
Security Risks: Cryptocurrency exchanges and wallets are susceptible to hacking and cyberattacks.
Limited Adoption: Despite growth, cryptocurrencies still face challenges in widespread adoption as a mainstream form of payment.
Complexity: Understanding cryptocurrencies and blockchain technology can be challenging for newcomers, leading to potential investment mistakes.
Summary:
Both the stock market and the crypto market offer unique opportunities and challenges for investors. The stock market provides stability, regulation, and a wide range of investment options, while the crypto market offers accessibility, potential for high returns, and technological innovation. Deciding which market is better depends on individual preferences, risk tolerance, and investment goals. Diversification across both markets may provide a balanced approach to building an investment portfolio.

📈Mastering Stock Selection:A Journey to Long-Term Wealth💰Part1Interested in selecting high-quality stocks and growing your wealth through long-term investing? Today, I'll guide you through effective stock selection methods, including the top-bottom and bottom-top approaches. Remember, as Warren Buffett famously said, "The stock market is designed to transfer money from the active to the patient." 💼📈
Let's start with the top-bottom approach. First, you choose an economy, such as Indian, US, or UK. Next, select a sector within that economy, like Financial Services, IT, or Pharma. From there, narrow down to an industry within the sector, such as AI, Clean-technology, or Hardware. Finally, choose a company within the industry. Don't worry if it seems complex – I'll provide examples and guidance throughout. 💡🔍
Conversely, the bottom-top approach flips this order. We start by selecting a company, then move up to its industry, sector, and finally, the economy. 💼🔄
Let's put theory into practice with the top-bottom approach: (a random example)
1. Choose India as the economy.
2.Select the IT sector for its promising future.
3. Opt for AI as the industry due to its potential.
4. Select Infosys as a company.
Now, it's your turn! Share examples of top-bottom or bottom-top approaches in the comments for practice. 💬💡
In the upcoming discussions, we'll delve into the fundamentals of sector, industry, and company analysis. Don't worry—I'll explain everything from market cap and cash flow to return on equity (ROE). 📊✨
Target of likes (boosts): 25+ (if we achieve our target than I will make Part 2) 🎯🚀
Follow for more such ideas & learning content! 🔍

[EDU-Bite Sized Mini Series] Various FX involved,Mostly..Hello Traders, here we go again!
Let me cover a little bit more on the next topic in this mini series, the various currencies that are involved and a little descriptions about them! Let's begin!
In the vast realm of forex trading, understanding the intricacies of currency pairs is fundamental to success. As a Full-time forex trader with years of live experience, I'm here to shed light on the major and minor currency pairs that dominate the market.
Major Currency Pairs: The Powerhouses of Forex. Normally most retailers trade these pairs as they offer higher liquidity and therefore tighter spreads.
Major currency pairs are the cornerstone of forex trading, encompassing currencies from the world's largest economies. These pairs typically involve the most traded currencies globally and offer high liquidity and stability.
Among the major pairs, the most prominent include:
1. EUR/USD (Euro/US Dollar): Known as the "fiber," this pair represents two of the world's largest economies, the Eurozone and the United States. It's renowned for its liquidity and tight spreads.
2. USD/JPY (US Dollar/Japanese Yen): Dubbed the "ninja," , the JPY or the YEN, this pair reflects the economic relationship between the US and Japan, two economic powerhouses with distinct monetary policies.
3. GBP/USD (British Pound/US Dollar): Often referred to as "cable," this pair reflects the relationship between the UK and the US, and it's influenced by economic data, geopolitical events, e.g. Brexit developments.
4. USD/CHF (US Dollar/Swiss Franc): Known as the "swissie," this pair is influenced by safe-haven flows, Swiss banking policies, and US economic data.
5. AUD/USD (Australian Dollar/US Dollar): Termed the "aussie," this pair is closely tied to commodity prices, particularly gold and other precious metals, as Australia is a major exporter of raw materials.
6. USD/CAD (US Dollar/Canadian Dollar): Called the "loonie," this pair is heavily influenced by oil prices, given Canada's status as a major oil exporter.
Minor Currency Pairs: Navigating the Market Beyond Majors
While major pairs dominate forex trading, minor currency pairs offer unique opportunities that should not be overlooked as well. These pairs involve currencies from smaller or emerging economies and could be less liquid than their major counterparts.
Notable minor pairs include:
1. EUR/GBP (Euro/British Pound): This pair reflects the relationship between the Eurozone and the UK, and it's influenced by economic data from both regions. In my opinion, this pair quite frequently range and sometimes it is termed as "mean reverting pair".
2. EUR/JPY (Euro/Japanese Yen): Combining two major currencies, this pair offers opportunities for traders seeking exposure to both the Eurozone and Japan.
9. GBP/JPY (British Pound/Japanese Yen): Known for its volatility, this pair attracts traders looking to capitalize on the economic dynamics between the UK and Japan. It is also one of the top favorite for scalpers.
10. AUD/JPY (Australian Dollar/Japanese Yen): Influenced by commodity prices and risk sentiment, this pair is popular among traders seeking exposure to the Australian and Japanese economies.
3. NZD/USD (New Zealand Dollar/US Dollar): Known as the "kiwi," this pair reflects economic developments in New Zealand and global risk sentiment.
4. CAD/JPY (Canadian Dollar/Japanese Yen): This pair offers insights into the commodity markets and the economic relationship between Canada and Japan.
In conclusion, mastering major and minor currency pairs is essential for navigating the forex market effectively. Major pairs offer stability and liquidity, while minor pairs provide opportunities for some diversification. By understanding the dynamics of each currency pair and staying informed about global economic developments, traders can unlock the full potential of forex trading and achieve profitable outcomes in this dynamic and ever-evolving market. And of course don't forget about your technical analysis!
Thank you for your time and hope you have enjoyed the content and if you do so please leave a thumbs up or a comment if you have any suggestions to make this better!
Do check out the other links if you missed out on the other parts of this Forex Mini Series i put up for all (FREE)!
Signing out!
STBB
