CURRENCY CORRELATION HEAT MAPCurrency correlation is important to understand in forex trading because it could impact your trading results often without you even knowing it.
In this post, I will share some information about correlations in forex trading and how you are able to use it to your advantage to avoid unnecessary losses. Throughout my journey as a beginner trader, I have bought or sold 2 different currency pairs many times without knowing they are negatively correlated just to let the gains be offset by
the other pair.
My aim in this short post is to bring awareness about the positive and negative correlations between the currencies, specifically the most traded major pairs in the forex market.
What is correlation in forex trading?
A foreign exchange correlation is the connection between 2 different currency pairs. There is a positive correlation when 2 pairs move in the same direction, a negative correlation when they move in opposite direction, and no correlation if the pairs move with no relationship. In order to understand the relationship between 2 currencies, you must know the correlation coefficient and how it relates.
What is correlation coefficient?
A correlation coefficient represents how strong or weak a correlation is between 2 forex pairs. They are expressed in values and range from -100 to 100 or -1 to 1, with the decimal representing the coefficient. The higher the value of the correlation coefficient will largely reflect the movement of the other pair.
See Figure 1. Correlation Heat Map
For example, If the reading is -70 and above 70, it is considered to have strong correlation between the two. Readings anywhere between -70 to 70 means that the pairs are less correlated. With coefficients near the 0 mark, means little or no relationship with one or another. As traders, implementing risk management in our trading plan also reflects to correlations as you may think its a good ides to buy 2 highly correlated pairs thinking you will double your profits when in reality you may lose double the money as both trades could end up in a loss as you're doubling your risk.
Figure 2 . Positive Correlation: EURUSD / AUDUSD
As we can see on this line chart between EURUSD / AUDUSD, both pairs have a strong correlation coefficient as they are moving in almost the same direction. The correlation coefficient is valued at 75 as noted on the heat map. For example, if you place a buy order EURUSD and place a sell order on AUDUSD, expect a win and a loss in most cases.
Figure 3. Negative Correlation: EURGBP / GBPUSD
On this line chart, we can see that both of these parts are moving in opposite directions which are showing a negative correction between the two which in fact is also known as an inverted correction. The correlation coefficient is valued at -90 on the heat map which means if you place a buy order on EURGBP and a place a sell order on GBPUSD you may double your profits, but again you're doubling your risk.
Figure 4. No Correlation: GBPJPY / USDJPY
This line chart shows that both of these pairs move in the same direction with a correlation coefficient of -9 which has almost no correlation. If you place a buy order on GBPJPY and place a sell order on USDJPY, one of these trades will most likely end up in a loss. The pairs that have no correlation usually have different and separate economic conditions therefore coefficient values tend to be lower.
In summary, understanding which pairs are correlated with one another will be able to help build your strategy and improve your trading results. Every trading strategy NEEDS to have Risk Management implemented in it as it is the key to sustainability for the long run.
Trading is a marathon NOT a sprint.
To learn more about forex correlations and their relationships, please see the following links.
References:
www.tradingview.com
ca.investing.com
If you felt this information was helpful, and hit the LIKE button and FOLLOW me for more educational
posts and analysis.
Feel free to leave a comment if you have any questions!
I appreciate all the feedback.
Thanks
Trade Safe
Analysis

Mastering the Art of Technical Analysis (Part 6)Advantages of Technical Analysis
- Easy to Use: Technical analysis is easy to use and understand, making it accessible to traders of all levels of experience.
- Objective: Technical analysis is objective, as it relies on data and mathematical calculations rather than subjective opinions.
- Helps Identify Trends: Technical analysis helps traders identify trends, which can be used to make informed trading decisions.
- Provides Entry and Exit Points: Technical analysis can help traders determine entry and exit points for trades, allowing them to make profitable trades.
- Can be Used with Any Asset Class: Technical analysis can be used with any asset class, including stocks, commodities, and forex.
Disadvantages of Technical Analysis
- Past Performance Doesn't Guarantee Future Results: While technical analysis is based on historical data, it does not guarantee future results.
- Can be Subjective: Technical analysis can be subjective, as traders may interpret the same data differently.
- Not Suitable for All Market Conditions: Technical analysis may not be suitable for all market conditions, as some markets may be too volatile or have limited historical data.
- Overreliance on Indicators: Some traders may over rely on technical indicators, which can lead to false signals and poor trading decisions.
- Requires Constant Monitoring: Technical analysis requires constant monitoring of market data and indicators, which can be time-consuming.
Mastering the Art of Technical Analysis (Part 5)How to Use Technical Analysis for Trading
Technical analysis is a popular tool used by traders to analyze market trends and make informed trading decisions. It involves analyzing past market data, such as price and volume, to identify patterns and trends that can be used to predict future price movements. Here are some key ways to use technical analysis for trading:
Identifying trading opportunities using technical analysis
Technical analysis can be used to identify potential trading opportunities by analyzing market trends and patterns. Traders can use charts and technical indicators to identify trends and patterns, such as support and resistance levels, trendlines, and chart patterns. By identifying these patterns, traders can make informed trading decisions and take advantage of potential opportunities.
Setting up trading strategies using technical indicators
Technical indicators are tools that traders use to analyze market data and identify potential trading opportunities. These indicators can be used to generate signals for entry and exit points, as well as to identify trends and patterns. Common technical indicators include moving averages, oscillators, and trend indicators. Traders can use these indicators to set up trading strategies and make informed decisions about when to enter or exit a trade.
Understanding risk management and position sizing using technical analysis
Risk management is an important aspect of trading and involves managing potential losses and minimizing risk. Technical analysis can be used to help traders manage risk by identifying potential support and resistance levels, as well as by providing signals for stop-loss orders. Position sizing is another important aspect of risk management, which involves determining the appropriate size of a trade based on a trader's account size and risk tolerance. Technical analysis can be used to help traders determine appropriate position sizes based on market trends and patterns.
Combining technical analysis with other trading techniques
While technical analysis can be a powerful tool for trading, it is important to combine it with other trading techniques, such as fundamental analysis and market news. Fundamental analysis involves analyzing economic and financial data to determine the intrinsic value of an asset, while market news involves analyzing current events and news that may affect the market. By combining these techniques, traders can gain a more comprehensive understanding of the market and make informed trading decisions.
However, it is important to remember that technical analysis is not foolproof and should be used in conjunction with other forms of analysis and market news.
Additionally, traders should always practice proper risk management techniques to minimize potential losses.

Mastering the Art of Technical Analysis (Part 4)Candlestick Patterns
Candlestick charts are a popular type of chart used by traders to analyze price movements. They display the opening and closing prices, as well as the highs and lows, of an asset over a specific time period. Candlestick patterns are formed by the arrangement of multiple candlesticks and can provide insights into market trends and potential price movements.
Doji
A Doji is a candlestick pattern that has the same opening and closing price, or a very small difference between the two. This pattern often indicates indecision in the market and can be a signal for a potential trend reversal.
Hammer
A Hammer is a bullish reversal pattern that forms after a downward trend. It is characterized by a long lower shadow and a small body, and it indicates that buyers have gained control and are pushing the price up.
Shooting Star
A Shooting Star is a bearish reversal pattern that forms after an upward trend. It is characterized by a long upper shadow and a small body, and it indicates that sellers have gained control and are pushing the price down.
Engulfing
An Engulfing pattern is a reversal pattern that is formed by two candlesticks. The first candlestick is smaller and the second candlestick completely engulfs the first one. A bullish Engulfing pattern forms at the end of a downtrend and indicates a potential trend reversal. A bearish Engulfing pattern forms at the end of an uptrend and indicates a potential trend reversal.
Harami
A Harami pattern is a reversal pattern that is formed by two candlesticks. The first candlestick is larger and the second candlestick is smaller and is completely engulfed by the first candlestick. A bullish Harami pattern forms at the end of a downtrend and indicates a potential trend reversal. A bearish Harami pattern forms at the end of an uptrend and indicates a potential trend reversal.
Candlestick patterns are an important tool for technical analysis and can provide insights into market trends and potential price movements. By understanding the key principles of each candlestick pattern, traders can gain insights into market trends and make informed trading decisions. However, it is important to note that candlestick patterns are not foolproof and should be used in conjunction with other forms of analysis, such as fundamental analysis and market news.

Mastering the Art of Technical Analysis (Part 3)Technical indicators are mathematical calculations that are applied to price and volume data to identify potential trading opportunities. They are based on the belief that certain patterns or trends in price and volume data can provide insights into market trends and potential price movements. Technical indicators can be used to confirm trends, identify potential entry and exit points for trades, and to provide signals for when to buy or sell.
Moving Averages
Moving averages are one of the most common technical indicators used by traders. They are used to smooth out the price data and provide a clearer picture of the overall trend. Moving averages can be calculated using different time periods, such as 50-day moving average or a 200-day moving average. A crossover between a shorter-term moving average and a longer-term moving average is often used as a signal for when to buy or sell.
Relative Strength Index (RSI)
The Relative Strength Index (RSI) is a momentum oscillator that measures the speed and change of price movements. The RSI ranges from 0 to 100, with readings above 70 considered overbought and readings below 30 considered oversold. Traders often use the RSI to identify potential trend reversals or to confirm trends.
Bollinger Bands
Bollinger Bands are a technical indicator that is used to measure volatility. They consist of three lines - a simple moving average (SMA) in the middle, and two outer bands that are two standard deviations away from the SMA. The outer bands represent the upper and lower price ranges, and the width of the bands changes based on the volatility of the asset. Traders often use Bollinger Bands to identify potential entry and exit points for trades.
Moving Average Convergence Divergence (MACD)
The Moving Average Convergence Divergence (MACD) is a trend-following momentum indicator that uses two moving averages of different lengths to identify potential entry and exit points for trades. The MACD line is calculated by subtracting the 26-day exponential moving average (EMA) from the 12-day EMA. A signal line, which is a 9-day EMA, is then plotted on top of the MACD line. Traders often use the MACD to identify potential trend reversals or to confirm trends.
Fibonacci Retracement
The Fibonacci retracement is a technical indicator that is used to identify potential support and resistance levels based on the Fibonacci sequence. The Fibonacci sequence is a mathematical sequence of numbers, in which each number is the sum of the two preceding numbers. The retracement levels are calculated based on the high and low points of a particular price movement, and they are used to identify potential entry and exit points for trades.

Mastering the Art of Technical Analysis (Part 2)Understanding the Basics of Technical Analysis
Technical analysis is a method of analyzing financial markets that relies on studying past market data to identify patterns and make predictions about future price movements. The aim is to identify opportunities to buy low and sell high or vice versa.
What is technical analysis and why is it important for traders?
Technical analysis is the study of market data, primarily price and volume data, to identify patterns that can be used to make informed trading decisions. It is important for traders because it provides a way to interpret market trends and identify potential entry and exit points for trades.
Unlike fundamental analysis, which focuses on the underlying economic factors that influence a security's value, technical analysis relies solely on the price and volume data of a security. This means that technical analysis can be used on any asset class that has a price chart available, including stocks, bonds, currencies, and commodities.
Technical analysis can be used for short-term trading or long-term investing. For short-term traders, technical analysis can help identify potential entry and exit points for trades based on the movement of price and volume data. For long-term investors, technical analysis can help identify the overall trend of a market or a specific asset class.
The key principles of technical analysis: price action, trends, and support and resistance levels.
The key principles of technical analysis are price action, trends, and support and resistance levels.
Price action refers to the movement of an asset's price over time, and it is the primary focus of technical analysis. Price action can be analyzed using different types of charts, including line, bar, and candlestick charts.
Trends refer to the direction of price movement, and they can be classified as uptrends, downtrends, or sideways trends. Identifying the trend of a market or a specific asset is an essential part of technical analysis, as it helps traders understand the overall direction of price movement.
Support and resistance levels are points on a chart where the price has historically tended to stop moving or reverse direction. Support levels are areas where buyers tend to enter the market, as they believe the price is low enough to represent good value. Resistance levels are areas where sellers tend to enter the market, as they believe the price is high enough to represent good value.
Different types of charts: line, bar, and candlestick charts.
Different types of charts are used in technical analysis, including line, bar, and candlestick charts.
A line chart connects the closing prices of an asset over a period of time with a line, providing a simple view of the overall trend. Line charts are useful for identifying the direction of the trend but do not provide much detail about the price movement within a specific period.
A bar chart shows the opening and closing prices of an asset, as well as the high and low prices during a particular period. Each bar represents a specific time period, such as a day or an hour. Bar charts provide more detailed information about price movements than line charts, as they show the price range for each period.
Candlestick charts display the same information as bar charts, but they use a visual representation of candles to convey price movements. Each candle represents a specific time period, and the color of the candle represents whether the price closed higher or lower than it opened. Candlestick charts provide a more detailed view of price movements than bar charts and are widely used by traders.

Mastering the Art of Technical Analysis (Part 1)Technical analysis is an essential tool for traders to analyze market movements and make informed trading decisions. Whether you are a beginner or an experienced trader, mastering technical analysis can greatly improve your trading performance.
We will explore the basics of technical analysis, the different types of charts and indicators, and how to use them effectively.
Understanding the Basics of Technical Analysis
- What is technical analysis and why is it important for traders?
- The key principles of technical analysis: price action, trends, and support and resistance levels.
- Different types of charts: line, bar, and candlestick charts.
Types of Technical Indicators
- Moving averages: Simple Moving Average (SMA) and Exponential Moving Average (EMA).
- Oscillators: Relative Strength Index (RSI), Stochastic Oscillator, and Moving Average Convergence Divergence (MACD).
- Volume Indicators: On-Balance Volume (OBV) and Chaikin Money Flow (CMF).
- Fibonacci Retracement and Extension Levels.
How to Use Technical Analysis for Trading
- Identifying trading opportunities using technical analysis.
- Setting up trading strategies using technical indicators.
- Understanding risk management and position sizing using technical analysis.
- Combining technical analysis with other trading techniques.
Technical analysis is a valuable tool that traders can use to make informed trading decisions. By understanding the basics of technical analysis and using it effectively, traders can increase their chances of success in the markets.

Cash flow statement or Three great riversToday we're going to start taking apart the third and final report that the company publishes each quarter and year - it's Cash flow statement.
Remember, when we studied the balance sheet , we learned that one of the company's assets is cash in accounts. This is a very important asset because if the company doesn't have money in the account, it can't buy raw materials, pay employees' salaries, etc.
What, in general, is a "company" in the eyes of an accountant? These are assets that have been purchased on credit or with equity, for the purpose of earning a net income for its shareholders or investing that income in further growth.
That is, the source of cash in a company's account may be profits . But why do I say "may be"? The point is that it's possible to have a situation where profits are positive on the income statement, but there is no money physically in the account. To make sense of this, let's remember the workshop I use in all the examples. Suppose our master sold all of his boots on credit. That is, he was promised payment, but later. He ended up with a receivable in assets and, most interestingly, generated revenue. The accountant will calculate the revenue for these sales, despite the fact that the shop hasn't actually received the money yet. Then the accountant will deduct the expenses from the revenue, and the result will be a profit. But there is zero money in the account. So what should our master do? The orders are coming in, but there is nothing to pay for the raw materials. In such circumstances, while the master is waiting for the repayment of debts from customers, he himself borrows from the bank to top up his current account with money.
Now let us make his situation more complicated. Let us assume that the money borrowed he still does not have enough, and the bank does not give more. The only thing left is to sell some of his property, that is, some of his assets. Remember, when we took apart the assets of the workshop , the master had shares in an oil company. This is something he could sell without hurting the production process. Then there is enough money in the checking account to produce boots uninterrupted.
Of course, this is a wildly exaggerated example, since more often than not, profits are money, after all, and not the virtual records of an accountant. Nevertheless, I gave this example to make it clear that cash in the account and profit are related, but still different concepts.
So what does the cash flow statement show? Let's engage our imagination again. Imagine a lake with three rivers flowing into it on the left and three rivers flowing out on the right. That is, on one side the lake feeds on water, and on the other side it gives it away. So the asset called "cash" on the balance sheet is the lake. And the amount of cash is the amount of water in that lake. Let's now name the three rivers that feed our lake.
Let's call the first river the operating cash flow . When we receive the money from product sales, the lake is filled with water from the first river.
The second river on the left is called the financial cash flow . This is when we receive financing from outside, or, to put it simply, we borrow. Since this is money received into the company's account, it also fills our lake.
The third river let's call investment cash flow . This is the flow of money we get from the sale of the company's non-current assets. In the example with the master, these were assets in the form of oil company stock. Their sale led to the replenishment of our notional money lake.
So we have a lake of money, which is filled thanks to three flows: operational, financial, and investment. That sounds great, but our lake is not only getting bigger, but it's also getting smaller through the three outgoing flows. I'll tell you about that in my next post. See you soon!

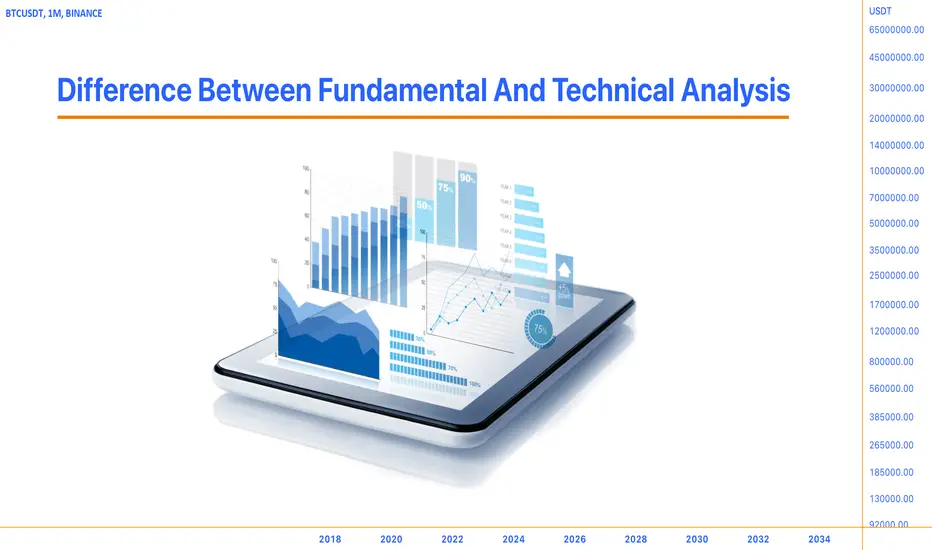
Difference Between Fundamental And Technical AnalysisFundamental and technical analyses are two approaches to analyzing financial markets, such as stocks, currencies, and commodities. Here are the key differences between the two:
Definition:
Fundamental analysis involves analyzing the economic and financial factors that affect the value of an asset, such as company earnings, industry trends, and macroeconomic indicators, to determine its intrinsic value. On the other hand, technical analysis involves studying charts and other technical indicators to identify patterns and trends in market data, with the assumption that historical price and volume patterns will repeat themselves in the future.
Focus:
Fundamental analysis focuses on the underlying factors that affect the long-term value of an asset, such as the company's financial health, management team, and growth potential. Technical analysis, on the other hand, focuses on short-term price movements and trends, using charts and technical indicators to identify buy and sell signals.
Tools:
Fundamental analysis uses financial statements, economic data, and industry reports to evaluate an asset's intrinsic value. Technical analysis uses charts, graphs, and technical indicators such as moving averages, trend lines, and support and resistance levels to identify patterns and trends in market data.
Time horizon:
Fundamental analysis is more suitable for long-term investors who are interested in the underlying value of an asset and its growth potential over time. Technical analysis is more suitable for short-term traders who are interested in identifying short-term trends and trading opportunities.
Accuracy:
Fundamental analysis is generally considered more accurate in predicting the long-term value of an asset, as it is based on a thorough analysis of the underlying factors that drive the asset's value. Technical analysis is considered more subjective, as it relies on chart patterns and technical indicators, which may be interpreted differently by different traders.
In summary, fundamental analysis and technical analysis are two different approaches to analyzing financial markets, with different focuses, tools, and time horizons. Fundamental analysis is more suitable for long-term investors who are interested in the underlying value of an asset, while technical analysis is more suitable for short-term traders who are interested in identifying short-term trends and trading opportunities.
Thank you for your time.
MonoCoin Signal
How to Use the Exponential Moving Average (EMA)The Exponential Moving Average (EMA) is a popular technical indicator used by traders to identify trends and make informed trading decisions. In this TradingView idea, we will discuss how to use the EMA in your technical analysis.
Step 1: Understanding the EMA
The EMA is a type of moving average that gives greater weight to more recent prices, making it more responsive to changes in the market. The EMA is calculated by taking the average of a set number of price data points over a specified time period, with more weight given to recent data points.
Example:
Let's say you are using 20-day and 50-day EMAs to identify trends and potential buy/sell signals. You notice that the 20-day EMA is above the 50-day EMA, indicating that the stock is in an uptrend. You then wait for the price of the stock to pull back to the 20-day EMA before buying in, as this could provide a good entry point. Conversely, if the price falls below the 20-day EMA, this could be a potential sell signal.
Step 2: Identifying Trends with the EMA
One of the primary uses of the EMA is to identify trends in the market. When the price of an asset is above the EMA, it is considered to be in an uptrend, while when the price is below the EMA, it is considered to be in a downtrend. Traders can use the EMA to identify potential buy and sell signals based on the direction of the trend.
Example:
Let's say you are using the 50-day EMA as a dynamic support or resistance level. You notice that the price of the pair has been consistently bouncing off the 50-day EMA, indicating that it is acting as a support level. You then decide to go long on the pair when the price approaches the 50-day EMA, with a stop loss below the EMA in case the price breaks through.
Step 3: Using Multiple EMAs for Confirmation
Traders can also use multiple EMAs to confirm trends and potential buy and sell signals. For example, using a shorter-term EMA, such as a 20-day EMA, in conjunction with a longer-term EMA, such as a 50-day EMA, can provide a more comprehensive view of the trend and potential trading opportunities.
Example:
Let's say you are using the 10-day, 20-day, and 50-day EMAs to confirm trends and potential buy/sell signals. You notice that the 10-day EMA is above the 20-day EMA, which is also above the 50-day EMA, indicating that the trend is up. You then wait for the price of gold to pull back to the 10-day or 20-day EMA before buying in, as this could provide a good entry point. Conversely, if the price falls below the 50-day EMA, this could be a potential sell signal.
Step 4: Using the EMA as a Dynamic Support or Resistance Level
In addition to identifying trends, the EMA can also be used as a dynamic support or resistance level. When the price of an asset is approaching the EMA, traders can use the EMA as a potential support or resistance level, depending on the direction of the trend.
In conclusion, the EMA is a versatile and powerful technical indicator that can be used for a variety of trading strategies. You don't need a complex setup to be successful in trading, just using simple indicator such as EMA can make trading highly profitable.
Vector -->

Everything you need to know about fundamental analysisEverything you need to know about fundamental analysis
Fundamental analysis is a technique for assessing the true value of assets, such as stocks or bonds. This type of analysis is used by investors and financial analysts to make investment decisions based on the underlying financial and economic factors that drive asset performance. In this post, we will take a closer look at what fundamental analysis is and how it can be used to make better investment decisions.
Fundamental analysis is the process of analyzing a company's financial data and evaluating its business model, industry trends and other economic factors to determine its intrinsic value. This type of analysis is often used in the stock market to help investors make informed buying and selling decisions.
To conduct a fundamental analysis, an investor usually begins by analyzing a company's financial statements, including its balance sheet, income statement and cash flow statement. These documents provide a wealth of information about a company's financial position, including its assets, liabilities, revenues and expenses.
In addition to examining financial statements, a fundamental analysis may also include an analysis of the company's business model, competitive situation, management team and industry trends. For example, an investor may look at a company's market share, growth prospects and competitive advantages to assess its long-term potential.
Another important aspect of fundamental analysis is macroeconomic factors, such as interest rates, inflation and government policies, which can affect the overall economy and the performance of individual industries and companies. For example, an increase in interest rates can affect the cost of borrowing for companies and reduce consumer spending, which can have a negative impact on a company's revenues.
Fundamental analysis is not limited to stocks, as it can also be used to analyze other assets, such as bonds and commodities. In the case of bonds, fundamental analysis can include an assessment of a company's creditworthiness and risk of default. In the case of commodities, fundamental analysis includes an analysis of factors such as supply and demand, geopolitical risks and atmospheric patterns that can affect prices.
One of the key advantages of fundamental analysis is that it takes a long-term view of the market, focusing on the fundamental economic and financial factors that shape asset prices. This approach can help investors identify undervalued or overvalued assets that may represent profitable investment opportunities.
However, it is important to remember that fundamental analysis is not a foolproof method of predicting market movements and is subject to a number of limitations and risks. For example, unexpected events such as natural disasters or political unrest can affect the performance of companies and industries in ways that are difficult to predict. In addition, fundamental analysis can be time-consuming and requires a deep understanding of the underlying financial and economic factors that affect asset prices.
In summary, fundamental analysis is an essential tool for investors and financial analysts who want to make informed investment decisions. By studying a company's financial reports, industry trends and other economic factors, investors can gain a deeper understanding of the intrinsic value of assets and make more informed buying and selling decisions. However, it is important to approach fundamental analysis with a healthy dose of skepticism and recognize its limitations in predicting market movements.
🚀 If you appreciate my work and effort put into this post, I encourage you to leave a like and follow on my profile. 🚀

My precious-s-s-s EPSIn the previous post , we began looking at the Income statement that the company publishes for each quarter and year. The report contains important information about different types of profits : gross profit, operating income, pretax income, and net income. Net income can serve both as a source of further investment in the business and as a source of dividend payments to shareholders (of course, if a majority of shareholders vote to pay dividends).
Now let's break down the types of stock on which dividends can be paid. There are only two: preferred stock and common stock . We know from my earlier post that a stock gives you the right to vote at a general meeting of shareholders, the right to receive dividends if the majority voted for them, and the right to part of the bankrupt company's assets if something is left after paying all debts to creditors.
So, this is all about common stock. But sometimes a company, along with its common stock, also issues so-called preferred stock.
What advantages do they have over common stock?
- They give priority rights to receive dividends. That is, if shareholders have decided to pay dividends, the owners of preferred shares must receive dividends, but the owners of common shares may be deprived because of the same decision of the shareholders.
- The company may provide for a fixed amount of dividend on preferred shares. That is, if the decision was made to pay a dividend, preferred stockholders will receive the fixed dividend that the company established when it issued the shares.
- If the company goes bankrupt, the assets that remain after the debts are paid are distributed to the preferred shareholders first, and then to the common shareholders.
In exchange for these privileges, the owners of such shares do not have the right to vote at the general meeting of shareholders. It should be said that preferred shares are not often issued, but they do exist in some companies. The specific rights of shareholders of preferred shares are prescribed in the founding documents of the company.
Now back to the income statement. Earlier we looked at the concept of net income. Since most investments are made in common stock, it would be useful to know what net income would remain if dividends were paid on preferred stock (I remind you: this depends on the decision of the majority of common stockholders). To do this, the income statement has the following line item:
- Net income available to common stockholders (Net income available to common stockholders = Net income - Dividends on preferred stock)
When it is calculated, the amount of dividends on preferred stock is subtracted from net income. This is the profit that can be used to pay dividends on common stock. However, shareholders may decide not to pay dividends and use the profits to further develop and grow the company. If they do so, they are acting as true investors.
I recall the investing formula from my earlier post : give something now to get more in the future . And so it is here. Instead of deciding to spend profits on dividends now, shareholders may decide to invest profits in the business and get more dividends in the future.
Earnings per share or EPS is used to understand how much net income there is per share. EPS is calculated very simply. As you can guess, all you have to do is divide the net income for the common stock by its number:
- EPS ( Earnings per share = Net income for common stock / Number of common shares issued).
There is an even more accurate measure that I use in my analysis, which is EPS Diluted or Diluted earnings per share :
- EPS Diluted ( Diluted earnings per share = Net income for common stock / (Number of common shares issued + Issuer stock options, etc.)).
What does "diluted" earnings mean, and when does it occur?
For example, to incentivize management to work efficiently, company executives may be offered bonuses not in monetary terms, but in shares that the company will issue in the future. In such a case, the staff would be interested in the stock price increase and would put more effort into achieving profit growth. These additional issues are called Employee stock options (or ESO ). Because the amount of these stock bonuses is known in advance, we can calculate diluted earnings per share. To do so, we divide the profit not by the current number of common shares already issued, but by the current number plus possible additional issues. Thus, this indicator shows a more accurate earnings-per-share figure, taking into account all dilutive factors.
The value of EPS or EPS Diluted is so significant for investors that if it does not meet their expectations or, on the contrary, exceeds them, the market may experience significant fluctuations in the share price. Therefore, it is always important to keep an eye on the EPS value.
In TradingView the EPS indicator as well as its forecasted value can be seen by clicking on the E button next to the timeline.
We will continue to discuss this topic in the next publication. See you soon!

👊 Support And Resistance Levels Explained 👊The fundamental concepts of technical analysis are support and resistance levels. Technical analysis strategies are based on psychological and mathematical patterns from previous periods. One such pattern is resistance and support levels, which determine the most likely price direction change or confirmation of trend continuation.
They can be used by both new and experienced traders.
In this article, we will learn what support and resistance lines are, how to draw them correctly, and how to apply this knowledge to real-world trading.
Fundamental Concepts
You must first understand what support and resistance levels are before you can begin adding them to the chart. They are critical indicators of a collision between upwardly and downwardly oriented players, known as bulls and bears. Traders pushing prices up or down will eventually reach a point where the opposing group is equally opposed.
Support is the price level that "defends," or prevents, the price from falling lower. Resistance is the line that prevents the price from rising and thus resists its rise.
A resistance line can become a support line as a result of price fluctuations, and vice versa.
Support is defined as two or more lows, and resistance is defined as two or more highs.
Once the price reaches a point of extremum on the chart, you can begin outlining the line, and the second extremum allows you to completely draw the support or resistance line. Because extremes are rarely repeated, the line is roughly drawn in the middle of them if the difference between them is insignificant. If the price spread between the marked extrema is large, the price range between these points is marked for the line, and traders are guided by it when drawing lines.
In a sideways trend, determining resistance and support levels is easier. With large price changes, the possibility of defining support and resistance lines incorrectly is very high.
There can be both strong and weak opposition and support. The time frame and number of price touches on the line define the line's strength. The higher the time frame, the more touches there are, as well as the strength of the resistance or support line. The length of the time frame is more important than the number of touches.
In general, the support and resistance lines indicate areas where the probability of a price correction increases.
The Notion Of A Trend
One of the indicators used to calculate support and resistance levels is trend strength. A trend is a price movement up or down over a long time period. The price of an asset can fluctuate, but if its minimums are consistently going up, the trend is upward, if the maximums are going lower, the trend is downward. On the stock market, a visually identifiable trend is used to assess long-term investments and the likelihood of success of short-term speculation.
How to trade using trend? The following algorithm is used for this purpose.
The trend line is determined by the price of the asset.
The Ultimate Beginner’s Guide To Trend Trading
How the trend line behaves when it contacts the support and resistance lines is examined. If the uptrend line breaks out a strong resistance line at the second or third try, then there is a considerable probability of further price growth. Conversely, the price of an asset is more likely to move down if it breaks out a strong support level.
What Factors Affect Support and Resistance Levels
You should consider psychological and fundamental factors when drawing support and resistance lines. In general, the price cannot constantly rise or fall. After breaking out at significant levels of support and resistance, the likelihood of a psychological phenomenon known as "traders' remorse" increases as many players reconsider the future trend of asset price development. This happens as a result of the following factors:
Fundamental: market or security indicators do not provide a basis for further price movement;
Psychological: as prices rise and fall, people begin to doubt the validity of future moves.
Profit fixing: achieving certain price points gives players a reason to fix their profits by monitoring the situation's evolution.
If a large enough number of traders "repent" and close their positions, the price will return to the support or resistance level, and the trend will reverse.
Correct Levels of Support and Resistance
Surprisingly, there is no widely held consensus on how support and resistance lines should be named, nor are there any clear, specific descriptions of the relationship between extremums and lines. Nonetheless, the majority of traders believe that resistance and support levels are horizontal lines drawn at the highest and lowest price levels.
Resistance lines are drawn on the maximums of impulse movements during an uptrend, and supports are formed on the minimums of corrective movements. The next low overlaps the next maximum, converting the resistance level to a support level. On the downside, the previous high coincides with the previous low, and the support level becomes a resistance level.
Some traders believe that oblique support and resistance lines drawn through highs and lows are trend lines.
Support and resistance lines can also be drawn through supply-price pivot points, also known as TD-points, which are upper extrema surrounded by lower extrema. The maximum point is the one above which prices have not moved in a specific time period, and the minimum point is the one below which prices have not moved in a specific time period.
Over time, each trader determines for themselves the best way to draw support and resistance lines for their specific purposes. Some traders are limited to identifying lines that are close to circular values, that is, lines that end in zero.
Based on previously formed reversal levels, it is also used to determine resistance and support levels.It is expected that if the price has previously bounced from a certain level, it will do so again. In this case, the trader must carefully analyze price dynamics and draw the lines by hand.
Each method can correctly determine support and resistance levels or it can lead to errors; it all depends on the trader's skills.
How to Draw Levels of Support and Resistance:
Consider the fundamental principles of drawing support and resistance lines.
Finding at least two minimum (maximum) points for the support (resistance) line These points are frequently close to the significant round number of the traded asset. Such closeness can be explained by the work of trading algorithm authors and traders, who prefer to be guided by visual values.
The drawing of lines from these points into the future They can be horizontal, with a positive or negative slope, or both. There may be several such lines on a single chart.
an examination of the significance of the obtained lines of support and opposition.
The third step is the most important. It considers the received charts from the following positions:
The hourly line is more important than the minutely line, but it has less value when compared to the weekly line.
Length: the longer the resistance and support lines on the chart, the more important they are as a signal of a trend reversal or trend development for the trader.
A few finishing touches As the number of lows and highs on which the support and resistance lines are based grows, so does their credibility.
Trading volume: If asset price areas of contact with support or resistance lines are accompanied by increased trading activity, it indicates that the lines are viewed as indicators by many traders.
Only after analyzing the lines' significance in relation to the aforementioned points can you begin using them in trading strategies.
How to Use Resistance and Support Levels in Live Trading
There are numerous approaches to working with support and resistance lines. Even though there is a wealth of educational material available on the Internet, learning how to use support and resistance lines requires practice.
To begin with, it is trading on a pullback and a breakout. This method assumes that if the price encounters significant support or resistance, it will most likely reverse. If the trend is strong, the price can cross any level and continue to rise. This strategy entails only placing orders in the direction of the current trend.
Trading on support and resistance levels is possible in a horizontal price channel. In this case, trades are opened when the price approaches the upper boundary of the channel, with the expectation of a resistance line crossing or a price rebound and fall. Price support and resistance lines, rather than price points, are taken into account to a greater extent. Which trend will prevail must be determined by auxiliary tools on the chart, such as bar and candlestick behavior.
Not all levels of opposition and support are equally strong. A level's "strength" refers to the accuracy of its signal: a breakout indicates the continuation of a strong trend, whereas a reversal indicates the start of a new movement in the opposite direction. In the market, false breakouts are common. Use the recommendations below to avoid them.
Step 1: Keep an eye on the time frames.
Look for extremes on a daily and weekly basis. They can be considered strong if they at least partially coincide with extrema in lower time frames. Market makers are frequently active in the M5-M15 time frame. The approximate accumulation zone for stop orders can be determined using the depth of the market and the logic of private traders. With large volumes and trigger stops, market makers pull the price to the required zone, obtaining an asset at the best price.
Step 2: Count the number of touches.
The finer the level touches, the better. Note that the line must be drawn on exact touches without "pulling wishful thinking."
Support And Resistance Levels In Forex Trading
In the forex market, strategies based on support and resistance lines may be considered basic. In particular, trading within the price corridor is applied in case of price bounces - buying on a bounce from the upper boundary and buying on the approach to the lower one. In this case, stop orders are set either above or below the boundaries.
Trading along the lines is useful in distinctly determined trends. For instance, if you are in a downtrend, you should monitor the upward correction to the previous support level and the new resistance level. If we talk about uptrend, the correction to the previous resistance and the new support should be monitored.
Still, breakout trading is one of the most popular strategies in the forex market. It requires defining support and resistance levels as precisely as possible. In this strategy pending orders are placed just above or just below resistance levels.
Summary
Support and resistance levels are essential when analyzing any chart, either currency pair or cryptocurrencies. The major problem in doing so is knowing how to identify levels and place lines correctly. This is a practical skill, as there is no unambiguous definition of how to determine the support and resistance lines accurately. The task of defining them can become easier due to the fact that there are numerous auxiliary tools on trading platforms to determine them. Many trading strategies are based on support and resistance lines, and their effectiveness, by the way, also depends on the trader's practical skills.
By understanding the principles of levels application, you can not only improve your trading system but also learn to understand the market better and assess its prospects.

How to Measure Pips On TradingviewNice quick and easy method for everyone to be able to measure pips for their risk reward ratio and risk management.

The income statement: the place where profit livesToday we are going to look at the second of the three main reports that a company publishes during the earnings season, the income statement. Just like the balance sheet, it is published every quarter and year. This is how we can find out how much a company earns and how much it spends. The difference between revenues and expenses is called profit . I would like to highlight this term "profit" again, because there is a very strong correlation between the dynamics of the stock price and the profitability of the company.
Let's take a look at the stock price charts of companies that are profitable and those that are unprofitable.
3 charts of unprofitable companies :
3 charts of profitable companies :
As we can see, stocks of unprofitable companies have a hard enough time growing, while profitable companies, on the contrary, are getting fundamental support to grow their stocks. We know from the previous post that a company's Equity grows due to Retained Earnings. And if Equity grows, so do Assets. Recall: Assets are equal to the sum of a company's Equity and Liabilities. Thus, growing Assets, like a winch attached to a strong tree, pull our machine (= stock price) higher and higher. This is, of course, a simplified example, but it still helps to realize that a company's financial performance directly affects its value.
Now let's look at how earnings are calculated in the income statement. The general principle is this: if we subtract all expenses from revenue, we get profit . Revenue is calculated quite simply - it is the sum of all goods and services sold over a period (a quarter or a year). But expenses are different, so in the income statement we will see one item called "Total revenue" and many items of expenses. These expenses are deducted from revenue gradually (top-down). That is, we don't add up all the expenses and then subtract the total expenses from the revenue - no. We deduct each expense item individually. So at each step of this subtraction, we get different kinds of profit : gross profit, operating income, pretax income, net income. So let's look at the report itself.
- Total revenue
This is, as we've already determined, the sum of all goods and services sold for the period. Or you could put it another way: this is all the money the company received from sales over a period of time. Let me say right off the bat that all of the numbers in this report are counted for a specific period. In the quarterly report, the period, respectively, is 1 quarter, and in the annual report, it is 1 year.
Remember my comparison of the balance sheet with the photo ? When we analyze the balance sheet, we see a photo (data snapshot) on the last day of the reporting period, but not so in the income statement. There we see the accumulated amounts for a specific period (i.e. from the beginning of the reporting quarter to the end of that quarter or from the beginning of the reporting year to the end of that year).
- Cost of goods sold
Since materials and other components are used to make products, accountants calculate the amount of costs directly related to the production of products and place them in this item. For example, the cost of raw materials for making shoes would fall into this item, but the cost of salaries for the accountant who works for that company would not. You could say that these costs are costs that are directly related to the quantity of goods produced.
- Gross profit (Gross profit = Total revenue - Cost of goods sold)
If we subtract the cost of goods sold from the total revenue, we get gross profit.
- Operating expenses (Operating expenses are costs that are not part of the cost of production)
Operating expenses include fixed costs that have little or no relation to the amount of output. These may include rental payments, staff salaries, office support costs, advertising costs, and so on.
- Operating income (Operating income = Gross profit - Operating expenses)
If we subtract operating expenses from gross profit, we get operating income. Or you can calculate it this way: Operating income = Total revenue - Cost of goods sold - Operating expenses.
- Non-operating income (this item includes all income and expenses that are not related to regular business operations)
It is interesting, that despite its name, non-operating income and operating income can have negative values. For this to happen, it is sufficient that the corresponding expenses exceed the income. This is a clear demonstration of how businessmen revere profit and income, but avoid the word "loss" in every possible way. Apparently, a negative operating income sounds better. Below is a look at two popular components of non-operating income.
- Interest expense
This is the interest the company pays on loans.
- Unusual income/expense
This item includes unusual income minus unusual expenses. "Unusual" means not repeated in the course of regular activities. Let's say you put up a statue of the company's founder - that's an unusual expense. And if it was already there, and it was sold, that's unusual income.
- Pretax income (Pretax income = Operating income + Non-operating income)
If we add or subtract (depending on whether it is negative or positive) non-operating income to operating income, we get pretax income.
- Income tax
Income tax reduces our profit by the tax rate.
- Net income (Net income = Pretax income - Income tax)
Here we get to the income from which expenses are no longer deducted. That is why it is called "net". It is the bottom line of any company's performance over a period. Net income can be positive or negative. If it's positive, it's good news for investors, because it can go either to pay dividends or to further develop the company and increase profits.
This concludes part one of my series of posts on the Income statement. In the next parts, we'll break down how net income is distributed to holders of different types of stock: preferred and common. See you soon!

At the beginning was the EquityWith this post, I am concluding the analysis of the company's balance sheet. You can read the previous parts here:
Part 1 - Balance sheet: taking the first steps
Part 2 - Assets I prioritize
Part 3 - A sense of debt
Now we know that every company has assets on one side of the balance sheet and liabilities and equity on the other side. If you add liabilities and equity together you get the sum of assets. And vice versa, if you subtract all of the company's liabilities from the assets, you get what? That's right, you get Equity . Let's discuss this important component of the balance sheet.
When a company is first established, it must have initial equity. This is the money with which any business starts. It is used for the first expenses of the new company. In the case of our workshop , the equity was the master's savings, with which he bought the garage, equipment, raw materials and other assets to start his business. As sales progressed, the workshop received the revenue and reimbursed expenses. Whatever was left over was used to boost the company's profit. So, our master invested his capital in the business to increase it through profits.
Making a profit is the main purpose for which the company's assets work, loans are raised, and equity is invested.
Let's see which balance sheet items are in the Equity group:
- Common stock (The sum of nominal values of common stock issued). Remember, when our master decided to turn his company into a stock company , he issued 1 million shares at a price of $1,000 per share. So $1,000 per share is the par value of the stock. And the sum of the nominal values of the stocks issued would be $1 billion.
- Retained earnings . It is clear from the name of this item that it contains profits that have not been distributed. We will find out where it can be allocated in the next post, when we start analyzing the income statement.
- Accumulated other comprehensive income (Profit or loss on open investments). The profit or loss of a company can be not only from its core business, but also, for example, from the rise or fall in the value of other companies' shares that it bought. In our example, the workshop has oil company shares. The financial result from the revaluation of these shares is recorded in this item.
So, the equity is necessary for the company to invest it in the business and make a profit. Then the retained earnings themselves become equity, which is reinvested to make even more profits. It's a continuous cycle of the company's life that bets on equity growth.
Which balance sheet items are of interest to me in the Equity group? Of course, I am interested in the profit-related items: retained earnings and profit or loss on open investments. The sum of nominal share values is a static indicator, so it can hardly tell us anything.
However, it is better to use information from the income statement rather than the balance sheet to analyze earnings, because only this report allows us to see the entire structure of a company's income and expenses.
So we conclude the general analysis of a company's balance sheet. To fully understand why it is needed, let's engage our imagination once again. Do you remember the example with the hotel ? We imagined that a joint stock company is a hotel with identical rooms, where you, as an investor, can buy a certain number of rooms (one room = one share). Think about what you would want to look at first before buying? Personally, I'd rather see photos of the rooms.
So, the balance sheet can be compared to such photos that we get from the hotel at quarterly and annual intervals. Of course, in such a case, the hotel will try to use special effects as much as possible in order to improve investors' impression of the photos released. However, if we track and compare photos over multiple periods, we can still understand: is our hotel evolving, or have we been watching the same couch in a standard room for 10 years in a row.
We can say that the balance sheet is a "photo" of the company's assets, debts and equity at the balance sheet date. And the balance sheet items I've chosen are what I look at first in this photo.
In the next series of posts, we will break down an equally important report, the income statement, and explore the essence of earnings. See you soon!

A sense of debtIn the previous two posts, we explored how assets are grouped in a company's balance sheet.
Part 1: Balance sheet: taking the first steps
Part 2: Assets I prioritize
Now let's deal with Liabilities and Stockholders' equity. Let me remind you that these are the sources of funds that give a company assets. And indeed, with what funds can a company have assets? Either with its own funds (stockholders' equity), or with funds borrowed (liabilities). For simplicity, we will call them Debts and Equity.
Debts can vary in maturity, so we've divided them into two categories in the balance sheet: Current liabilities and Non-current liabilities .
Current liabilities include:
- Current debts are debts that need to be paid back within a year after they are incurred. Do you remember our master took a loan from the bank to make a large batch of boots? That loan will be recorded in this item (assuming the loan is up to one year in repayment).
- Accounts payable (debts to suppliers of goods and services). You can borrow money not only from the bank, but also from your suppliers, for example. In other words he is giving you raw materials now, but is ready to accept payment later. Such debts are reflected in this item.
- Accrued liabilities (Provisions for future expenses on unpaid bills in the form of wages, rent, taxes). The word "debt" is in many ways synonymous with the word "liability." A company may have many such liabilities: payment of wages, rent and taxes. In essence, these are also debts to be paid during the year. For convenience, cash reserves are set aside for them. They are spent at the moment when the payment is due. Such reserves are recorded in this item.
- Other current liabilities . Debts or liabilities with a maturity of up to one year that are not included in the categories above are shown here.
Non-current liabilities include:
- Long term debt - these are debts that need to be paid back more than one year after they are incurred. If our master had borrowed from the bank for two years, such a loan would fall into this category.
- Deferred taxes liabilities (Provision for taxes to be paid in a future period). Tax rates are subject to change, and new taxes may come into effect in a year or more. But even now, the company can set aside money for future taxes.
- Other long term liabilities . Here are debts or liabilities with a maturity of more than one year that are not included in the categories above.
In short, debts are loans taken by the company, provisions for tax liabilities, and debts to suppliers.
The amount of debt is a very important indicator in the fundamental analysis of a company. On the one hand, the mere presence of debt is not scary, because it demonstrates that banks trust the company and give it loans for development. On the other hand, a substantial amount of debt can cause serious problems and losses in the period of weak sales of goods or services. Banks are unlikely to suspend interest charges on loans if a company is doing poorly. This means the company will incur expenses in the form of interest on loans that are not offset by revenue. Also a reminder that if a company goes bankrupt, the owners of the stock get the assets of that company only after all debts have been settled . If the debts are so large that they exceed the value of all the property, the shareholders get nothing. For these reasons, I select companies with small debt loads.
What liabilities do I focus on?
- Current debt;
- Accounts payable;
- Long term debt.
For me, these are the items that most clearly reflect the company's debt situation.
In the next post, we will conclude our study of the balance sheet and look at the basic source of assets, which is Equity. See you soon!

Assets I prioritizeIn the previous post Balance sheet: taking the first steps , we began parsing the balance sheet of the imaginary workshop and focused on assets. Today, I suggest looking at what types of tangible and intangible property are classified as current assets and what types are classified as non-current assets.
Current assets contain the following items:
- Cash and cash equivalents - in our case we can include a safe with money, which, in general, corresponds to the company's cash in its current bank accounts.
- Net receivables - here we would include the IOU from a friend. That is everything that clients owe the company for goods or services.
- Inventory - this includes a bag with leather, rubber and thread. That is all raw materials, from which goods are made, as well as stocks of finished goods in warehouses.
- Other current assets - this can include other current assets that do not belong to the previous items.
Non-current assets include the following items:
- Net property, plant and equipment - we include a garage, table, chair, sewing machine and tools. Depreciation is deducted from the original cost of the property when reporting it. Depreciation is the cost to repair and renew the property.
- Equity and other investments - in our example, this would include oil company stocks (and in general, any company investment in stocks or bonds of other companies).
- Goodwill - let's say our company wants to buy another company and is willing to pay $11 million for it. The assets of the other company are $10 million, and the debts that our company will have to pay for the other company are $2 million. So the assets net of debt are $8 million. After the purchase, the assets and debts of that company will become the assets and debts of our company. So, the difference between the purchase amount of $11 million and the net assets of $8 million is a goodwill equal to $3 million. For our workshop, this item is not relevant, as it didn't buy any company. Nevertheless, remember that goodwill is the difference between the purchase price of another company and its net assets.
- Intangible assets - this can include the value of the customer base in the master's phone book, as well as any other assets that have no tangible basis (such as purchased trademarks).
- Other long term assets - this item includes other non-current assets that don't belong to the previous items.
Once we understand which asset belongs to which item, its value (or rather, the sum of the values of all assets belonging to this item) is written in the balance sheet. For example, let's say we've determined that the Inventory item includes leather, rubber, and thread. The accountant adds up the value of the leather, rubber, and thread and writes the total amount in monetary terms against the Inventory item. This is how the numbers appear in the balance sheet.
Now let's discuss which balance sheet items we should pay attention to during the fundamental analysis of assets. I have formulated the following rule for myself: pay attention to the assets that are directly related to the sale of the company's goods or services .
If a company does not sell its goods or services well, its bank account balance will shrink, huge inventories of unsold goods and raw materials will accumulate in its warehouses, and accounts receivable (customers debt) will grow. The fact is that when sales are bad, the company is ready to lend out goods as debt.
If sales are going well, then, on the contrary, the money in the account will grow, and accounts receivable and inventory will start to shrink. All other assets can influence sales only indirectly, so I don't consider them.
Thus, I have identified my priority assets :
- Cash and cash equivalents;
- Net receivables;
- Inventory.
As you can see, they are all quick current assets. Non-current assets only indirectly affect sales, so they are not a priority benchmark for me.
In the next post, we'll start looking at the right side of our disclosed book, called the Balance sheet. That's where the company's liabilities and equity belong. See you next time!

Balance sheet: taking the first stepsToday we are going to start learning about fundamental analysis of companies. In my opinion, this is the basic skill you should have when picking stocks to invest in.
Once again, the main principle of the strategy I follow is to pick outstanding companies and buy their stocks at a discounted price.
You may have noticed that first-class products are occasionally discounted in stores, but not for long, because such products are quickly swept off the shelves, and almost the next day the price is again without a discount. Exactly the same strategy is applicable to the stock market. Now, fundamental analysis is a method for picking outstanding companies (that is, companies with strong fundamentals).
How can we tell if a company has a strong foundation or not? There is only one way - by analyzing its financial statements. Every listed company has to disclose this information publicly on its website. In other words, we don't have to extract that information - it is publicly available. You can also find it on TradingView and see the data in dynamics.
What is the content of this information? The company publishes three reports : balance sheet, income statement and cash flow statement.
The balance sheet, like the order book , can be presented as an open book. The left side of the book lists the company's assets and their valuation in monetary terms, and the right side lists the company's liabilities and equity , and their valuation in monetary terms.
What are company assets ? These are everything that belongs to the company: buildings, equipment, trademark, shares of other companies, cash in the cash register. In general, all tangible and intangible property of a company are assets.
What are liabilities and equity of a company? These are the sources of funds that gave rise to the assets. For example, if you bought a computer for $1000 with your savings, then the computer is an asset, and your own savings are equity. If a friend lent you $100, and you put the money in your pocket, the money in your pocket is an asset, and the debt to your friend is a liability. Based on these examples, you can make an imaginary balance sheet:
As you can see, the entry in the balance sheet is the name of the asset, liability or equity and their monetary value. Assets, liabilities and equity are inextricably linked, so the sum of assets is always equal to the sum of liabilities and equity .
If we were to write every asset in this way on the balance sheet of a large company, it would turn into an endless book of hundreds of pages. However, if we look at the balance sheets of huge corporations, they can fit on a single sheet of paper. This is due to the fact that over time invented to group the same type of balance sheet items. Let's look at how the company's balance sheet items are grouped:
Don't be frightened. Now we will try to digest this table with the help of an example we are already familiar with. Let's think back to our master cobbler , specifically to the period when he was just starting out.
Let's assume what exactly he had at that time: a garage, a table, a chair, a sewing machine, tools, a bag with leather and rubber, thread, a safe with money, a phone book with clients' contact information, a IOU from his friend, and oil company stocks.
I have now listed the assets of our master, or should I say, of his workshop. I should note that what is listed here is exactly what is directly related to his business. Even the money in the safe, the debt from his friend, and the oil company shares came about because of the existence of the business. Let's say the master's apartment or the bicycle he rides in the park are not assets, because they don't belong to the workshop. They belong to the master, but not to his business.
Let's categorize the workshop's assets into groups. There are two big groups: Current assets and Non-current assets .
How should you distinguish them? The general rule is this: Current assets are what a company's product is made of, and what can turn into money in the near future, so they can be called quick assets . Non-current assets are where and with what we create the product, and what can turn into money not so soon (so they can be called long-term assets ).
So, here we go:
- A garage, a table, a chair are where we create a product, so a long-term (non-current) asset.
- A sewing machine, tools - this is what we use to create a product - a long-term (non-current) asset.
- A bag with leather and rubber and thread is what a product is made from - a quick (current) asset.
- A safe with money is already real money - a quick (current) asset.
- A phone book with customer numbers - it's hard to sell it to someone quickly, such assets are also called intangible assets and are placed in long-term (non-current) assets.
- IOU from a friend, i.e. a friend bought boots from a master, but can pay only after receiving his salary - a quick (current) asset.
- Shares of an oil company - let's assume that a customer once paid for the boots with them - a long-term (non-current) asset.
So, we've just categorized the master's assets into two groups: current assets (quick assets) and non-current assets (long-term assets). In the next post, we'll break down the components of these two large groups. See you then!

The 4 Most Common Indicatorshello dear traders,
Here are some educational chart patterns that you must know in 2022 and 2023.
I hope you find this information educational and informative.
We are new here so we ask you to support our views with your likes and comments,
Feel free to ask any questions in the comments, and we'll try to answer them all, folks.
Trend traders attempt to isolate and extract profit from trends. The method of trend trading tries to capture gains through the analysis of an asset's momentum in a particular direction; there are multiple ways to do this. Of course, no single technical indicator will punch your ticket to market riches; in addition to analysis, traders also need to be well-versed in risk management and trading psychology. But certain strategies have stood the test of time and remain popular tools for trend traders who are interested in analyzing certain market indicators.
Moving Averages:-
Moving Averages:-
Moving Average is a technical analysis tool that smoothes price data by creating a continuously updated average price. On a price chart, the moving average forms a single, flat line that effectively eliminates any variation due to random price fluctuations.
The average is taken over a specific period of time—25 days, or any time period that the trader chooses. For investors and long-term trend followers, the 200-day, 100-day, and 50-day simple moving averages are popular choices.
There are many ways to use moving averages. The first is to look at the angle of the moving average. If it is moving mostly horizontally for an extended period of time, the price is not trending, it is ranging. A trading range occurs when a security trades between high and low prices consistently for a period of time.
If the moving average line is in an upward direction, then an uptrend is underway. However, moving averages do not make predictions about the future price of a stock; They simply reveal what the price is doing on average over a period of time.
Another way is to use crossover moving averages. By plotting the 200-day and 50-day moving averages on your chart, a buy signal occurs when the 50-day crosses above the 200-day. A sell signal occurs when the 50-day crosses below the 200-day.
When the price moves above the moving average, it can also be used as a buy signal, and when the price moves below the moving average, it can be used as a sell signal.
However, the price is more volatile than the moving averages, so this method is more prone to false signals, as shown in the chart above.
Moving averages can also provide support or resistance to the price.
Moving Average Convergence Divergence (MACD):-
Moving Average Convergence Divergence (MACD):-
The Moving Average Convergence Divergence (MACD) is a type of oscillating indicator. An oscillating indicator is a technical analysis indicator that oscillates over time within a band (above and below the centerline; the MACD oscillates above and below zero). It is both a trend-following and momentum indicator.
A basic MACD strategy is to look at which side of the MACD line is zero in the histogram below the chart. If the MACD lines are above zero for a sustained period of time, there is a possibility of an uptrend for the stock. Conversely, if the MACD lines are below zero for a sustained period of time, the trend is likely to be down. Using this strategy, potential buy signals occur when the MACD moves above zero, and potential sell signals when it moves below zero.
Signal line crossovers can also provide additional buy and sell signals. The MACD consists of two lines – a fast line and a slow line. A buy signal occurs when the fast line crosses through and above the slow line. A sell signal occurs when the fast line crosses through and below the slow line.
Relative Strength Index (RSI):-
Relative Strength Index (RSI):-
The Relative Strength Index (RSI) is another oscillating indicator, but its movement ranges between zero and 100, so it provides different information than the MACD.
One way to interpret the RSI is to view the price as "overbought" - and due to a correction - when the indicator is above 70 in the histogram, and to view the price as oversold - and due to a bounce - when the indicator is below 70. is 30.
In a strong uptrend, the price will often reach 70 and above for sustained periods of time. For a downtrend, the price may remain at or below 30 for a long period of time. While general overbought and oversold levels can sometimes be accurate, they may not provide the most timely signals for trend traders.
One option is to buy near oversold positions when the trend is up and short near overbought positions in downtrends.
For example, suppose the long-term trend of a stock is up. A buy signal occurs when the RSI crosses below 50 and then crosses back above it. Essentially, this means that the price has come down. Hence the trader buys when the pullback appears to be over (according to the RSI) and the trend is resuming. The 50-level is used because the RSI typically does not reach 30 in an uptrend unless a potential reversal is taking place. A short-trade signal occurs when the trend is down and the RSI moves above 50 and then moves back below it.
Trendlines or moving averages can help establish the direction of the trend and in which direction to take trading signals.
On-Balance Volume (OBV):-
On-Balance Volume (OBV):-
Volume is a valuable indicator in its own right, and on-balance volume (OBV) takes important volume information and compiles it into a single-line indicator. The indicator measures cumulative buying and selling pressure by adding volume on "up" days and decreasing volume on "down" days.
Ideally, the volume should confirm the trends. With an increasing price there should be an increasing OBV; With a falling price, the OBV should also fall.
If the OBV is rising and the price is not rising, it is likely that the price will follow the OBV in the future and start rising. If the price is rising and the OBV is flat-lining or declining, the price may be nearing the top. If the price is falling and the OBV is flat-lining or rising, then the price may be nearing the bottom.
The Bottom Line:-
In addition to providing trend trading signals and warnings about reversals, indicators can simplify price information. The indicators can be used on all time frames, and for the most part, they have variables that can be adjusted to suit each trader's specific preferences. Traders can combine indicator strategies - or come up with their own guidelines - so the entry and exit criteria for trades are clearly established.
Learning to trade indicators can be a difficult process. If a particular indicator appeals to you, you may decide to do further research on it. Most importantly, it is a good idea to test it before using it to trade live. And for those who have never actively traded before, it is important to know that opening a brokerage account is an essential first step in gaining access to the crypto market.
Trade with care.
If you like our content, please feel free to support our page with a like, comment
Hit the like button if you like it and share your charts in the comments section.
Thank you

What's the Difference? Fundamental vs TechnicalHello dear traders,
Here are some educational chart patterns that you must know in 2022 and 2023.
I hope you find this information educational and informative.
We are new here so we ask you to support our views with your likes and comments,
Feel free to ask any questions in the comments, and we'll try to answer them all, folks.
Fundamental vs. Technical Analysis:-
Fundamental and technical analysis are two major schools of thought when it comes to approaching the markets, yet are at opposite ends of the spectrum. Investors and traders use both to research and forecast future stock prices. Like any investment strategy or philosophy, both have advocates and adversaries.
Fundamental Analysis:-
Fundamental analysis evaluates stocks by attempting to measure their intrinsic value. Fundamental analysts study everything from the overall economy and industry conditions to the financial strength and management of individual companies. Earnings, expenses, assets, and liabilities all come under scrutiny by fundamental analysts.
Technical Analysis:-
Technical analysis differs from fundamental analysis, in that traders attempt to identify opportunities by looking at statistical trends, such as movements in a stock's price and volume. The core assumption is that all known fundamentals are factored into the price, thus there is no need to pay close attention to them. Technical analysts do not attempt to measure a security's intrinsic value. Instead, they use stock charts to identify patterns and trends that suggest what a stock will do in the future.
Trade with care.
If you like our content, please feel free to support our page with a like, comment
Hit the like button if you like it and share your charts in the comments section.
Thank you

Man on the shoulders of giantsIsaac Newton, who turned people's view of the world upside down, once said: "If I have seen further than others, it is by standing on the shoulders of giants". And indeed, each of us has a chance to discover something new for ourselves and others by drawing on the wisdom of our predecessors. I want to say a big thank you to Benjamin Graham, David Dodd, Warren Buffett and Peter Lynch, who openly shared their ideas with the world and inspired more than one private investor in their first investments.
I'm sure Mohnish Pabrai will join me in saying the same. Born in Mumbai, an engineer by training, he had no interest in the subject of stock investing until he was 30 years old. But by chance, after reading a book by Peter Lynch, he began to study the subject more deeply. Inch by inch he climbed the shoulders of the giants of value investing to see hitherto unknown horizons. He is now known as a successful investor, author of books on investing, and creator of incredibly kind philanthropic initiatives.
Listening to Mohnish Pabrai's lectures, I noted his ideas, which in many ways coincide with my own. I am happy to share them with you:
1. The market is always concerned about what will happen to the company in the future, so it cannot be 100% efficient (*).
(*) Let me remind you that according to "efficient market" theory, a company's current price reflects its "fair value" because any publicly known information instantly affects the price. Thus, an investor is unlikely to make a profit on any information, such as a company's strong financial statements, because the market has already reflected the event. However, this theory does not take into account the future, which we all think about every day and act in the present, including the market, based on those thoughts. For example, someone may think that a company's future is murky because of the news that has come out. This concern will be picked up by the crowd, and the stock will go down. Or on the contrary, the success of the company may be perceived as over-optimistic, and a real stir will start around the stock. No one knows the future, but thinking about it affects the present. For this reason, the current price of the company may not reflect its fair value, contrary to the "efficient market" theory.
2. Continuing with the first thought, the waves of pessimism and optimism will always be present in the market. They distort a company's value so much that they give us private investors a chance to buy and sell a company's stock profitably.
3. The more time you spend analyzing a company, the more you "fall in love" with it. Try to grasp this idea. After all, by spending a lot of time studying something, such as a company's excellent financial statements, we set ourselves up for what it must pay off as a profitable investment. Remember: the market doesn't owe you anything.
4. Often the decision to invest in a company can be made based on just a few surprising figures. For example, if the value of a company is equal to 50% of the amount of cash in its checking account. Mohnish Pabrai said that Warren Buffett used a reference book with the statements of thousands of companies, not to spend months studying each of them, but to find something that would really surprise him.
5. Mohnish Pabrai admitted that he has never once played the short and has no intention of doing so for the rest of his life. His math is really simple. If you play the short by selling a stock at $100, your maximum earnings are capped at $100 (which will happen when the stock drops to zero). Whereas a buyer of a $100 stock has a chance to sell it at both $1,000 and $2,000. There is no upside restriction by its very nature.
6. And the thought I want to conclude this post with is don't look for people to hand you a treasure on a platter. Looking for treasure is much more interesting! It's about not trying to replicate someone else's trades or portfolio positions. Try to make your own decisions. Try to see your horizon.
The unwavering shoulders of giants will help you in all of this.

A pill for missed opportunitiesPrevious parts of the post:
Part 1: My Three Comrades: the Chart, the Screener, and the Watchlist
Part 2: Two captains of the same ship
The market is an element we take for granted. It can't stop when we're busy doing other things, and it can't work if the stock market is off and you personally have work days.
The small investor's impact on the market is close to zero. Some may not like it, but I see it as a big plus. I'm not the only one. Even Peter Lynch wrote about this . It is because of our size that we small investors have the ability to get the best buy and sell prices on stocks. Just imagine an elephant and a mouse trying to drink water from a coffee mug. Who has a better chance?
Like the best sales, attractive stock prices don't last long. This also applies to the period of increased stock prices that are interesting to sell. To make sure you don't miss this time, TradingView has an alert service.
Why do we need an alert system? For our convenience. Once we have selected fundamentally strong companies, our next step is to keep an eye on their stock price so we can buy them at a price we can benefit from.
You remember our strategy, right? Buy rooms in a great hotel, and even during a sale period.
How do you monitor these "sales"? You have two options: to monitor the price chart yourself during the trading period, or set up alerts so that if the stock price reaches a certain level, you will receive an SMS message to your phone or email, or a push-notification in the TradingView app (depending on your settings). Agree, this is very convenient.
So how do you set up the alerts?
1. First of all, you must open the chart of the stock you are going to configure the alerts for.
2. Then click on the "Alert" button at the top toolbar of the chart.
3. Set the alert parameters in the settings menu.
How do I read the settings in this picture?
If the Apple stock price is less than $130 per share, I will receive an alert every minute, all the time the stock is trading below $130.
The alert I will receive will contain the following message:
AAPL Less Than 130.00
If you don't want to get an alert every minute, set the trigger to "Only Once".
4. In the "Notifications" tab, you can configure where the alerts and the sound will go. The system of customized alerts will allow you to use your time effectively. You will not be chained to the monitor and you can calmly wait for the cherished message.
In the picture you can see that alerts can come as:
- push notification to your phone (if you have the TradingView app installed);
- a pop-up window on your monitor;
- a letter to your email address;
- a message to a web address (advanced feature for developers);
- SMS to your phone, but via email (i.e. your email service must have the ability to send copies of emails via SMS).
As for my investment strategy, it's quiet enough to work on it even without alerts. Mr. Market doesn't often come with insanely interesting prices , so it takes time to get to the target values. It's like waiting for an astronaut from the Moon: he can't return to Earth in a day, you have to wait patiently, with the occasional peek at the situation.
So, I'm concluding my series of posts dedicated to the basic functions of TradingView. I advise you to "play" with the platform for a while to get used to it as quickly as possible. In fact, it has a lot of features that you will discover over time. For now, that's it.
In the following posts, we will begin to examine perhaps the most important aspect of an investment strategy, which is fundamental analysis. Get ready, here comes the part that will require the most concentration. But then you will be able to navigate this topic with ease.
See you next time!
