📚How To Trade With Doji Candle (Bullish Signal) Educational📚 📈 This Is DrgonFly Doji Candle >> Make Change In Direction 📈
1- Appears At The Bottom Of a Downtrend
2- Shows The Rejection Of lower Prices
3- Give Bullish Signals (BUY)
Stop lose Under Candle Low
Target 2x Stop
EURUSD-2

📚 Learn How To Trade With Triangle 📚Hello Traders ...
We Have Today Very Important Lesson >> How To Draw And Trade With Triangle Pattern
Please Follow All Tips On Chart ♥
📚 Best Frame : All
📚 Risk : 2.5 - 5 % Per Trade
📚Best Pair : Slow Pairs
📚 Favorite Time : In High Liquidity
Learn How To Trade With Triangle Pattern In 3 Minutes

EURUSD and USDPLN correlationNice correlation between EURUSD and USDPLN
Trading ideas in the related links
Let me know what your thoughts are in the comment section
Like and follow me for more content
Good Luck

EURUSD Regression AnalysisThis is the analysis i did quickly for EURUSD using Linear regression .
Disclaimer: This is not financial or investment advice
Stay healthy, trade safe.
Atilla Yurtseven

Trading Triangles: Part TwoAt Target One of the Daily Triangle 50% of the position is closed.
It would then be logical to assume Price would drop by 50% of the move from Entry.
Price did not drop by 50% and instead began to form a new Triangle pattern.
Dropping to a lower time frame (4H) we can see the process begin to repeat itself.
Targets One and Two for the 4H Triangle are shown below.

Trading Triangles: Part OneTriangles occur during periods of consolidation.
They represent indecision in the market as to whether the overall trend will reverse or continue.
The direction is confirmed by a candle close above or below the boundaries of the triangle.

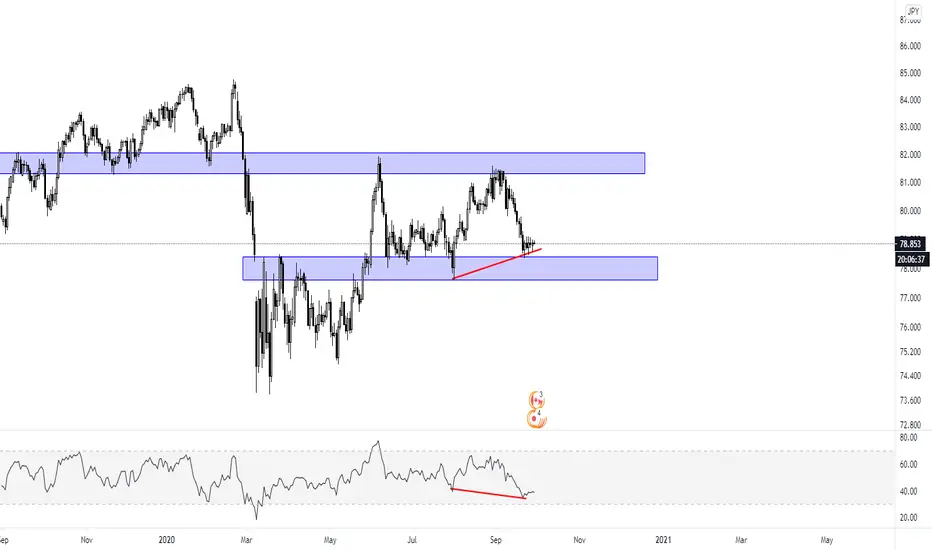
The difference - Double Top & Head and ShouldersHello my friend | Welcome Back.
Please support this idea with LIKE if you find it useful.
***
What Is Double Top and Bottom?
Double top and bottom patterns are chart patterns that occur when the underlying investment moves in a similar pattern to the letter "W" (double bottom) or "M" (double top). Double top and bottom analysis is used in technical analysis to explain movements in a security or other investment, and can be used as part of a trading strategy to exploit recurring patterns.
$$$
What Is a Head And Shoulders Pattern?
A head and shoulders pattern is a chart formation that appears as a baseline with three peaks, the outside two are close in height and the middle is highest. In technical analysis, a head and shoulders pattern describes a specific chart formation that predicts a bullish-to-bearish trend reversal. The head and shoulders pattern is believed to be one of the most reliable trend reversal patterns. It is one of several top patterns that signal, with varying degrees of accuracy, that an upward trend is nearing its end.

Risk management in trading €$¥Hello my friend | Welcome Back.
Please support this idea with LIKE if you find it useful.
***
What is market risk?
Market risk is the capacity for your trades to result in losses due to unfavourable price movements that affect the market as a whole. There are several factors that can cause market risk, but movement in any of the following can exert major pressure:
Stock prices
Interest rates
Foreign exchange rates
Commodity prices
What is liquidity risk?
Liquidity risk is the possibility that you may be forced to trade an asset at a worse price than you anticipated. For example, when trying to sell an illiquid stock you may struggle to find a buyer, meaning that you have to sell your stock for less than its current market value.
In some markets, liquidity risk can even mean that your trade negatively affects the price of the asset you are buying or selling. This is generally more of an issue in emerging or low-volume markets, where there may not be enough people in the market to trade with.
How to manage your risk
Risk management is the process of identifying, analysing and reducing risk in your trading decisions. Usually, it involves developing a trading plan that helps you decide what to trade, when to trade and where to place your stop losses. Here are three tips on how to manage risk:
1. Assess risk vs return
In general, trading strategies focus on weighing up a trade’s potential risk against its potential return. If a trade has greater risk, it should carry the chance of a greater return to make that risk worthwhile.
For example, government bonds are considered a safe, low-risk investment – but when compared to corporate bonds, they offer lower rates of return. This is because the risk of investing in a corporate bond is higher, so to compensate for the added risk investors are offered a higher rate of return.
2. Understand each market’s risks
It’s important to ensure you understand the factors that influence different markets, so you can base your dealing strategies on relevant information. Improve your success rate by learning more about the markets you’re dealing on and exploring new strategies.
Our trading skills section is a great place to learn about all the markets we offer.
3. Keep learning
Learning to trade successfully while managing your risk is a continual process – and one of the best ways of ensuring that you are always improving is by starting a trading diary. By keeping track of which trades and strategies have worked in the past, you can build on your successes and learn from your failures.

Head and shoulders typesHello my friend | Welcome Back.
Please support this idea with LIKE if you find it useful.
***
The head and shoulders chart pattern is a popular and easy to spot pattern in technical analysis that shows a baseline with three peaks, the middle peak being the highest. The head and shoulders chart depicts a bullish-to-bearish trend reversal and signals that an upward trend is nearing its end.
The pattern appears on all time frames and can, therefore, be used by all types of traders and investors. Entry levels, stop levels and price targets make the formation easy to implement, as the chart pattern provides important and easy to see levels.

Classic graphicsHello
Please support this idea with LIKE if you find it useful.
Classic technical analysis is one of the best analyzes for finding a buy or sell opportunity
So I drew some of the most common technical drawings used in the analysis.
*****
1 ) What Is a Head And Shoulders Pattern?
A head and shoulders pattern is a chart formation that appears as a baseline with three peaks, the outside two are close in height and the middle is highest. In technical analysis, a head and shoulders pattern describes a specific chart formation that predicts a bullish-to-bearish trend reversal. The head and shoulders pattern is believed to be one of the most reliable trend reversal patterns. It is one of several top patterns that signal, with varying degrees of accuracy, that an upward trend is nearing its end.
* A head and shoulders pattern is a technical indicator with a chart pattern described by three peaks, the outside two are close in height and the middle is highest.
* A head and shoulders pattern describes a specific chart formation that predicts a bullish-to-bearish trend reversal.
* The head and shoulders pattern is believed to be one of the most reliable trend reversal patterns.
2 ) What is Inverse Head And Shoulders?
An inverse head and shoulders, also called a "head and shoulders bottom", is similar to the standard head and shoulders pattern, but inverted: with the head and shoulders top used to predict reversals in downtrends. This pattern is identified when the price action of a security meets the following characteristics: the price falls to a trough and then rises; the price falls below the former trough and then rises again; finally, the price falls again but not as far as the second trough. Once the final trough is made, the price heads upward, toward the resistance found near the top of the previous troughs.
3-4 ) What is a Sideways Trend?
A sideways trend is the horizontal price movement that occurs when the forces of supply and demand are nearly equal. This typically occurs during a period of consolidation before the price continues a prior trend or reverses into a new trend.
A sideways price trend is also commonly known as a "horizontal trend."
* A sideways trend is the horizontal price movement of a stock between resistance and support levels that occurs when the forces of supply and demand are balanced.
* Traders can profit from sideways trends in several ways, from looking for confirmations of a breakout or breakdown to using stock options to placing stop-loss orders when the price nears resistance levels.
4 ) What is a Descending Triangle?
A descending triangle is a bearish chart pattern used in technical analysis that is created by drawing one trend line that connects a series of lower highs and a second horizontal trend line that connects a series of lows. Oftentimes, traders watch for a move below the lower support trend line because it suggests that the downward momentum is building and a breakdown is imminent. Once the breakdown occurs, traders enter into short positions and aggressively help push the price of the asset even lower.
4-5 ) What is an Ascending Triangle?
An ascending triangle is a chart pattern used in technical analysis. It is created by price moves that allow for a horizontal line to be drawn along the swing highs, and a rising trendline to be drawn along the swing lows. The two lines form a triangle. Traders often watch for breakouts from triangle patterns. The breakout can occur to the upside or downside. Ascending triangles are often called continuation patterns since the price will typically breakout in the same direction as the trend that was in place just prior to the triangle forming.
7 ) What is a Descending Channel?
A descending channel is drawn by connecting the lower highs and lower lows of a security's price with parallel trendlines to show a downward trend. Officially, the space between the trendlines is the descending channel, which falls under the broad category of trend channels.
8 ) What Is Rising (Or) Ascending Channel Chart Pattern?
As you can notice the rising channel pattern moves upwards, it is also called as Bullish Channel pattern. It comprises of two lines parallel to each other with points shaping higher highs and higher lows therefore consequential in bullish channel or upside channel. The price is limited between the two trend lines.
9 ) Support and resistance role reversal
A key concept of technical analysis is that when a resistance or support level is broken, its role is reversed. If the price falls below a support level, that level will become resistance. If the price rises above a resistance level, it will often become support. As the price moves past a level of support or resistance, it is thought that supply and demand has shifted, causing the breached level to reverse its role.

What Are Fibonacci Retracements and Fibonacci Ratios?How Fibonacci Ratios Work
Before we can understand why these ratios were chosen, let's review the Fibonacci number series.
The Fibonacci sequence of numbers is as follows: 0, 1, 1, 2, 3, 5, 8, 13, 21, 34, 55, 89, 144, etc. Each term in this sequence is simply the sum of the two preceding terms, and the sequence continues infinitely. One of the remarkable characteristics of this numerical sequence is that each number is approximately 1.618 times greater than the preceding number. This common relationship between every number in the series is the foundation of the ratios used by technical traders to determine retracement levels.
The key Fibonacci ratio of 61.8% is found by dividing one number in the series by the number that follows it. For example, 21 divided by 34 equals 0.6176, and 55 divided by 89 equals about 0.61798.
The 38.2% ratio is discovered by dividing a number in the series by the number located two spots to the right. For instance, 55 divided by 144 equals approximately 0.38194.
The 23.6% ratio is found by dividing one number in the series by the number that is three places to the right. For example, 8 divided by 34 equals about 0.23529.
Fibonacci Retracement and Predicting Stock Prices
For unknown reasons, these Fibonacci ratios seem to play a role in the stock market, just as they do in nature. Technical traders attempt to use them to determine critical points where an asset's price momentum is likely to reverse.
Fibonacci retracements are the most widely used of all the Fibonacci trading tools. That is partly because of their relative simplicity and partly due to their applicability to almost any trading instrument. They can be used to draw support lines, identify resistance levels, place stop-loss orders, and set target prices. Fibonacci ratios can even act as a primary mechanism in a countertrend trading strategy.
Fibonacci retracement levels are horizontal lines that indicate the possible locations of support and resistance levels. Each level is associated with one of the above ratios or percentages. It shows how much of a prior move the price has retraced. The direction of the previous trend is likely to continue. However, the price of the asset usually retraces to one of the ratios listed above before that happens.
The following chart illustrates how a Fibonacci retracement appears. Most modern trading platforms contain a tool that automatically draws in the horizontal lines. Notice how the price changes direction as it approaches the support and resistance levels.
Fibonacci Retracement Pros and Cons
Despite the popularity of Fibonacci retracements, the tools have some conceptual and technical disadvantages that traders should be aware of when using them.
The use of the Fibonacci retracement is subjective. Traders may use this technical indicator in different ways. Those traders who make profits using Fibonacci retracement verify its effectiveness. At the same time, those who lose money say it is unreliable. Others argue that technical analysis is a case of a self-fulfilling prophecy. If traders are all watching and using the same Fibonacci ratios or other technical indicators, the price action may reflect that fact.
The underlying principle of any Fibonacci tool is a numerical anomaly that is not grounded in any logical proof. The ratios, integers, sequences, and formulas derived from the Fibonacci sequence are only the product of a mathematical process. That does not make Fibonacci trading inherently unreliable. However, it can be uncomfortable for traders who want to understand the rationale behind a strategy.
Furthermore, a Fibonacci retracement strategy can only point to possible corrections, reversals, and countertrend bounces. This system struggles to confirm any other indicators and doesn't provide easily identifiable strong or weak signals.
The Bottom Line
Fibonacci trading tools suffer from the same problems as other universal trading strategies, such as the Elliott Wave theory. That said, many traders find success using Fibonacci ratios and retracements to place transactions within long-term price trends.
Fibonacci retracement can become even more powerful when used in conjunction with other indicators or technical signals. Investopedia Academy's Technical Analysis course covers these indicators as well as how to transform patterns into actionable trading plans.

How to Trade the Head and Shoulders PatternThe head and shoulders chart pattern is a reversal pattern and most often seen in uptrends.
Not only is head and shoulders known for trend reversals, but it’s also known for dandruff reversals as well.
In this lesson, we’ll stick to talking about trend reversals and leave the topic of dandruff for another time.
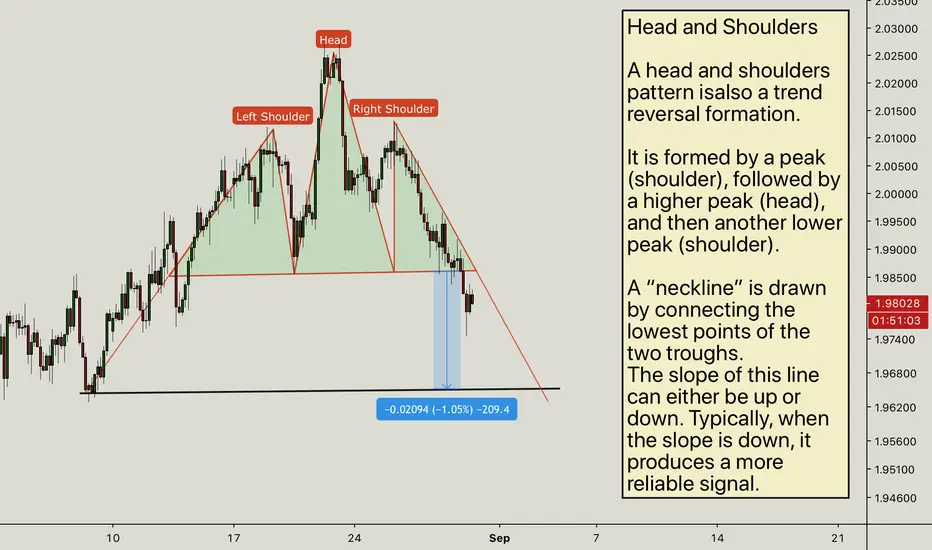
Head and Shoulders
A head and shoulders pattern is also a trend reversal formation.
It is formed by a peak (shoulder), followed by a higher peak (head), and then another lower peak (shoulder).
A “neckline” is drawn by connecting the lowest points of the two troughs.
The slope of this line can either be up or down. Typically, when the slope is down, it produces a more reliable signal.
In this example, we can easily see the head and shoulders pattern.
The head is the second peak and is the highest point in the pattern. The two shoulders also form peaks but do not exceed the height of the head.
With this formation, we put an entry order below the neckline.
We can also calculate a target by measuring the high point of the head to the neckline.
This distance is approximately how far the price will move after it breaks the neckline.
You can see that once the price goes below the neckline it makes a move that is at least the size of the distance between the head and the neckline.
We know you’re thinking to yourself, “the price kept moving even after it reached the target.”
And our response is, “DON’T BE GREEDY!”
Inverse Head and Shoulders
The name speaks for itself. It is basically a head and shoulders formation, except this time it’s upside down.
A valley is formed (shoulder), followed by an even lower valley (head), and then another higher valley (shoulder). These formations occur after extended downward movements.
EURUSD-Daily Educational - Channel's Trade Secret's & Tip's🗒 Just browsing through my analysis means a lot to me.
➡️ Please follow the analysis very carefully and every detail of the chart means a lot. And always entry depends on many reasons carefully studied
Always enter into deals when there are more than 5 reasons
combined
How To Trade Channel's like Pro / Tip's & Secret's
-------------
Step Number 1 -
You Have To Search For Reversal 3 low's / High'
near From each other Connected in same line level
-------------
Step Number 2--
Connect Upper line for more Than 3 Reversal
like what we Did in lower line Of Channel
-----------
Step Number 3 -
Here is the Confirmation to know if our Channel is
healthy and Strong Enough -
Middle line Should play Support and Resistance
in the Past
Example Here -- For Healthy Channel
3 connected High's / Low's
Middle line play Support and Resistance Rule
------------------
Trade Break Out Channel .. Target To next Channel line 1 : 2 Risk To Reward Allway's
For Best Result's Com-pain it with Support and Resistance Zone -- For more Confirmation

EURUSD: Long Term Perspective & Trend Analysis
hey guys,
I know that many of you are expecting a coming bearish movement on a daily on EURUSD.
analyzing a weekly time frame though, I want to warn you that the pair has still much space for a bullish continuation.
on a weekly, the price is clearly trading in a global bearish trend.
spring's covid bullish rally made the market set a higher low and triggered a bullish rally,
and it looks like a long term goal for buyers is 1.21 - 1.25 wide supply cluster.
this zone is based on 2008'th, 2010'th, 2012'th lows and 2018'th high.
in my view, a strong weekly bearish movement will most likely start from that area.
however, what makes me extremely cautious is the recent higher low.
usually, it is the first strong signal of a coming trend change.
if the above-mentioned zone is broken buy buyers, It will signify a long term bearish trend violation and start of a new long term bullish trend.
as always we can only speculate about the probabilities of both events.
but clearly decision point is close.

Why chasing % should be your focus and not pips!Here we look at 3 traders, all claiming to have a winning trade with 100 pips - however, with very different % gains on their accounts.
The main part of trading is profitability, you can not pay your bills with pips.
This explains what you need to focus on and be aware of!
Hope it helps,
Regards
Darren

Clear points of entry for either scenario - VERY clean setup.This pair has been sat in some serious corrective price action. i'm hoping we can see a break next week. Which way do i think its likely to break?
Probably up, but i'm also very aware that if the bears muster the strength to break that 1.180 area, then we also have a double top that could be good to trade to the bottom of that correction.
Targets for the (potential) double top sit near enough directly on that bottom level.
So to summarise, although i think this pair is likely to break above, i will not be trading my opinion. i'll be trading what i see.
A break, close & pullback on the upper level and ill be looking for longs.
A break of that (potential) double top neckline and ill be looking to short to the corrections bottom.
MACD looking as though the double top could easily come into play, but as above, i'll trade whatever it wants to give us.

EURUSD Fore Leading week(Bullish) Scenario 1: Stabilization above 1.19
(Range) Scenario 2: Neutral between 1.1895 and 1.1725
(Bearish) Third scenario: stabilization below the price of 1.1685

EURUSD8.13.20 comparison of a few markets ( DXY, EUDUSD,AND GBPUSD)...and why the GBPUSD might have been my pick for a scalp.

A simple flow indicatorAn alternative way of assessing currency flow is the ratio between the ETFs of each currency. For example, the EZU that gives exposure to a developed market countries using the Euro currency, divided by IVV that gives exposure to large, established U.S. companies.
The direction of this ratio shows us whether companies in one country (or region) are growing faster than the other. The greater the growth of companies, the greater the country growth and productivity, which creates a virtuous cycle and currency appreciation.


The best long-term indicatorOne of the main economic indicators for currency valuation is the real interest rate differential between the two countries / currencies.
The large flows of fixed income always go to where there is the highest real yield, interest rate discounted from inflation. The carry trade.
It is possible to see in the USDCAD example on the graph the great correlation between the interest rate differential and the appreciation / depreciation of each currency.
Currently, this indicator does not seem to make much sense due to extremely low inflation and low interest rates in the worldwide. However, the big draw is to know where the economic recovery will be faster, will create more jobs and income, will lead to an increase in inflation and consequently to an increase in interest rates and currency appreciation.
Make your bets!
I would bet on Australia and Europe, maybe that's why the dollar is so weak.

"Cup & Handle" pattern extreme failureThe markup says it all.
Do YOU believe in forex patterns?
I don't.
