Kairi Relative Index - OscillatorKairi calculates the deviation of the current price from its SMA as a percent of the moving average.
If the percent is high and positive Sell (Overbought )
If the percent is large and negative Buy ( Oversold )
The trading strategy is similar to RSI, but the upper and lower limits will be determined based on previous results and not like RSI at a certain level ( 30 or 70)
Oscillators

[Strategy] KSD Divergance with priceI use ksd and price divergence as a trading strategy
all you need is that find a divergence and wait for sharp green increasing line on ksd. than enter to long position.
KSD = KST - KST_Signal

Helpful tips for using the RSIHere I give you the tips I've found most helpful when using the RSI for both trading and TA.
Let me know what you think!

RSI:MACD advanced indicatorgreetings, hope you're doing well and thanks for your likes and comments .
Today i'm gonna teach you how to mix two indicators there's lots of indicators that you can mix together and use them, at this tutorial i'm gonna try adding MACD and RSI .
1_ Once you have added the RSI indicator, you have to open RSI settings.
2_then you have to process the way below : go to settings > go to inputs (its a tab like button above) > open source, select MACD:MACD .
congrats you have mixed these two indicators, but it haven't finished.
3_ after these steps you have to go to style tab > set the upper band on number 66.66
4_ you have to turn of the check of middle band (there's no need to use it;)
5_ then, set the lower band on number 33.33;
well done !
"Guys there is no any %100 true analysis" .
you should buy if the RSI line goes upper than lower band, you can expect growing up the price
you should sell id the RSI line goes lower than upper band, you can expect getting down the price,
thanks for your likes, and comments <3
If there was any questions, i will be so glad to reply to your messages !

The only divergences guide you needHello, everyone!
There are a lot of traders and many of them use divergence in their own way. Most of these ways lead to the deposit losses in the long run, because generate the late entries. I like to trade with Alexander Elder’s approach to the divergence. It has the clear entry condition and the small stop-losses in case of mistake. Divergences allows to enter the market exactly before the actual trend reverse, thus you always buy the dip and sell the rip, which produces the best risk to reward ratio. Foe divergence defining we will use MACD indicator, but you can choose any oscillator with zero-lne. After reading this guide you will be able to define divergences on every appropriate oscillator.
Let’s consider this approach!
Bearish Divergence
What is bearish divergence? For the true bearish divergence we should see four obligatory signs.
(1) Point C on the price chart should be higher than point A.
(2) Point C on the MACD is below than point A.
(3) The MACD histogram have to cross the zero-line to the downside to form the point B
(4) The MACD histogram have to cross the zero-lne to the upside after the (3).
Now it’s time to find the entry point. Point C is formed when the decreasing column appeared on the MACD. (5) It is the time to execute short position . Stop loss we should take above the point’s C high. As you can see we have the very small stop loss with the huge profit potential.
Next condition enhances the short signal:
(6′) Decreasing MACD lines while the price increases.
Bullish Divergence
Bullish divergence is the opposite to the bearish. We have to see the following conditions.
(1) Point C is below the point A on the price chart.
(2) Point C is above the point A on the MACD histogram.
(3) We have to see first MACD histogram crossover with zero-line to the upside to form the point B.
(4) Than we have to see the opposite crossover to the downside.
Now it’s time to wait the first increasing column on MACD histogram to spot the point C and (5) execute the long positions . Stop loss should be set below the point C low.
We can often see the price decrease continuation to the point D, this point is (6) also forms divergence, which enhances long signal, like the (7) divergence with MACD lines.
In this particular case the stop loss was not hit, but it could be the case. In this case we should re-enter position when the divergence conditions was met again.
DISCLAMER: Information is provided only for educational purposes. Do your own study before taking any actions or decisions at the real market.

AJ Trade Pro Indicator example. BTC Long and ShortJust an example of how the indicator works for anyone using it or looking to use it. It has been smashing it. Had some nice big and small moves recently.
Waiting on a long signal now fingers crossed.

Momentum play on NQ 45-min via volume-weighted RSIOverview
Simple overbought-oversold momentum play using NEXT RSI , which blends volume analysis with momentum. Volume weighing of the algo reduces the lag and improves accuracy over vanilla RSI as volume often precedes price action. This is a contra-trend (momentum exhaustion) scalping strategy - use order management (TP, SL, trailing stops) and do not trade signal to signal (e.g. long-short-long) .
Strategy Rules:
- NQ Futures, 45min chart
- Long Entry when NEXT RSI crosses over 35
- Short Entry when NEXT RSI crosses under 65
Order Management:
- Take profit @ +$50
- Stop Loss @ -$50
Prerequisites and set-up:
- NEXT RSI configured to 21,3,65,50,35
- NEXT Strategy Visualizer configured to Signal Source: NEXT RSI, LE @ 35, SE @ 65

Volume-Weighted Divergence Play on AAPL 10R via NEXT RSINEXT RSI Divergence Play: Key Concepts
- NEXT RSI is a low-lag, volume-weighted momentum oscillator that often precedes price action
- Divergence play resets at each open (do not count prior session's highs and lows)
- Use as you would other divergence strategies: higher price highs, lower NEXT RSI highs = bearish; lower price lows, higher NEXT RSI lows = bullish
-Use a preset TP / SL and/or close if NEXT RSI retraces back to last relevant high or low
Target Market:
- AAPL 10R Chart
- can be used with almost any market; volatility helps
Order Management:
- Enter on forming divergence, 2 or more clearly separated peaks or troughs
- TP / SL at 30 cents (AAPL)
- Exit if price retraces to the last NEXT RSI top or bottom referenced when opening the position
Optional:
- Additional NEXT RSI strategies can be discovered using the free companion NEXT Strategy Visualizer

POW Edge Reversal is HERE 🚀🚀🚀🚀🚀🚀🚀We've been sharing ideas on this strategy for quite some time now as part of our 'forward testing' approach and log.
In this video, I run through the strategy, how it works and how it can help.
Everything we do at POW is based on 'proof it works' - this is no different and you'll see this in the data I run through for you.
Any questions about gaining access please drop me a DM on here.
This just shows how powerful Pine script is - to automate a strategy and confirm you have an edge in the market.
Removing stress, decisions, overwhelm and all of the emotional struggles trading can bring.
Let me know in the comments what you think please - be nice right 😅?
Please scroll through some of my previous ideas to see some trades in action.
Regards
Darren

4 TIPS ON USING TECHNICAL INDICATORS 🤖🖥
Hey traders,
Technical indicators are an essential part of technical analysis.
With multiple different indicators on a chart, the trader aims to spot oversold/overbought conditions of the market and make a profit on that.
Though, I don't consider myself to be an expert in indicators trading, here are the great tips that will help you dramatically improve your trading with them.
#1️⃣ Do not overload your chart with indicators.
There is a fallacy among so many traders:
more indicators on the chart lead to an increase in trading performance.
Following this statement, traders add dozens of technical indicators to their charts.
The chart becomes not readable and messy.
The trader gets lost and makes wrong trading decisions.
Instead, add 1-2 indicators to your chart. That will be enough for you to make correct judgments. Do not overload your chart and try to make it clean: your task is to analyze the price action first and only then look for additional clues reading the indicators.
#2️⃣ Learn what exactly the indicator shows
The data derived from technical indicator must make sense to you.
You must understand the logic behind its algorithm.
You must know exactly what it shows to you.
Confidence in your actions plays a key role in trading.
During the periods of losing streaks and drawdowns, many traders drop their trading strategies. It happens because they lose their confidence.
You will be able to overcome negative trading periods only by being confident in your actions.
Only knowing exactly what you do, what do you rely on and why you can proceed even in dark times.
#3️⃣ Use the indicators that compliment each other
Many indicators are based on the same algorithms.
Most of the time the only difference between them is a minor change in its input variables.
For that reason, such indicators leave very similar clues.
In order to improve your trading, try to rely on indicators based on absolutely different algorithms. They must complement each other,
not show you the same thing.
#4️⃣ Price action first!
Remember that your trading strategy must be based primarily on a price action. Trend analysis and structure analysis must go first.
You must know the way to make predictions relying on a naked chart.
The indicators must be applied as the confirmation signals only.
They must support the trading strategy but not be its core.
❗️Remember that the indicators won't do all the work for you.
Indicator is just a tool in your toolbox that must be applied properly and in strict combination with other tools.
Would you add some other tips in this list?
❤️Please, support this idea with like and comment!❤️

Indicator Overview with the Laguerre RSI, Trendlines, and MADHi guys,
Take a look at how I use my indicators along with a brief description of what they are used for. I apologize for the grogginess of the video but I'll have my coffee before, next time!
Let me know what you think.

How I Use the RSI Indicator for DivergenceThis indicator always works best on higher time frame charts because on the lower time frames it becomes too noisy and not consistent. Suggest not using below the 1H chart. 4H chart or higher is always best. Sometimes it's always easier to see a real life example rather than a drawn out one or simulated one.

Here is Why RSI Divergence Will Increase Your ProfitsRSI can be beneficial in your trading if you use it correctly. This printable cheat sheet will assist you in divergence, so you can trade more precisely and increase your profits.
To print this cheat sheet, Right-click the illustration below and then click Save as Picture.
What Is RSI Divergence? With RSI divergence, the relative strength index of a specific asset shows lower highs when the price uptrend hits higher highs. Conversely, when the price is trending downward, it will hit lower lows with divergence while the RSI hits higher lows.
In a bullish divergence scenario you will see RSI show what is called being OVERSOLD and you will see price action form a lower low while the indicator shows a higher low. This represents a transition of volume from seller to buyers and the last push lower is sellers LAST attempt to take control.
The opposite is true for a bearish divergence scenario. You will see price action form a higher high, the last attempt from buyers, while RSI shows a lower high. This is a classic OVERBOUGHT setup and can be very profitable when combined with the rest of your technical analysis.
Those setups give us reversal signal in trending markets as well as ranging markets.
Keep in mind using one strategy is not enough to have consistent profits. Use combinations of strategies and setups to increase your winning rate. Always trade with affordable risk.
What indicator do you use for Divergence? Let us know in the comments
Have a best profits
Artem Shevelev

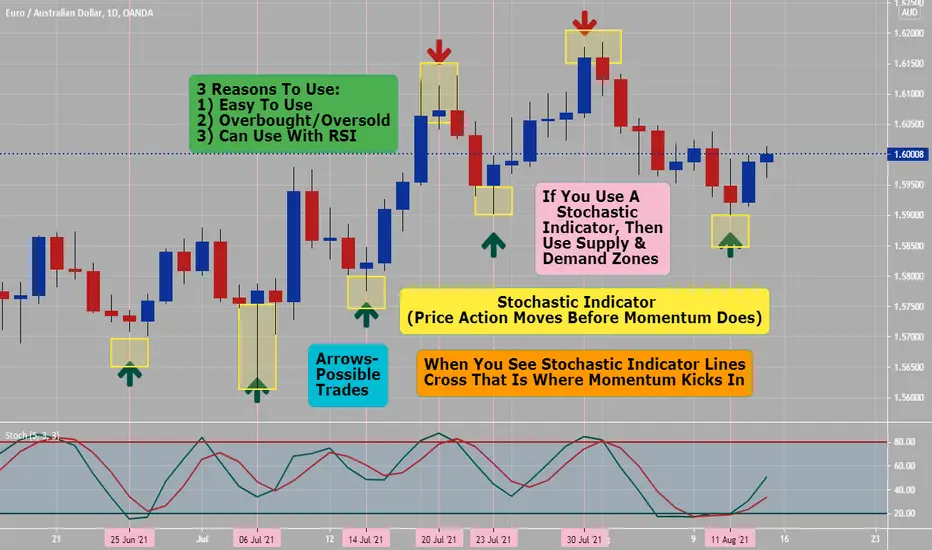
Stochastic Indicator (How To Use It)Trading with Stochastic indicator involves the following signals: *Remember: Price Action Moves Before Momentum Changes!!!
Stochastic lines cross — indicates trend change.
Stochastic readings above 80 level — currency pair is overbought,
Stochastic staying above 80 level — uptrend is running strong.
Stochastic exiting 80 level downwards — expect a correction down or beginning of a downtrend.
Same for readings below 20 level — currency pair is oversold, staying below 20 — downtrend is running strong,
exiting upwards above 20 — expect an upward correction or a beginning of an uptrend.
There are also so called "trigger levels" that are added to the Stochastic chart at 20 and 80 levels. Those lines suggest when the market is oversold or overbought once Stochastic lines pass over them. You can only trade oversold and/or overbought areas OR use demand/supply zones to trade more. Price Action does not ALWAYS need to hit 20 or below or 80 or higher for you to trade, might be in a trend or at a fib ret golden level (50%-61.8%) reversal area.
Strategy 1. Trading Stochastic lines crossover
The simplest and common method of reading signals from Stochastic lines as they cross each other. Stochastic %K and %D line work similar to moving averages and:when %K line from above crosses %D line downwards traders open Sell orders. when %K line from below crosses %D line upwards traders open Buy orders.
Strategy 2. Trading Stochastic oversold/overbought zones
Stochastic by default has 80% level, above which market is treated as overbought, and 20% level, below which market is considered oversold.
Strategy 3. Trading Stochastic divergence
Traders are looking for a divergence between Stochastic and the price itself.
NOTE: You can change the numbers on Stochastic Indicator to whatever you prefer, but for scalping and/or day trading I like 5,3,3 (more sensitive)
Reversal Zone Indicator / bitcoin litcoinIn this video, I show my most recent indicator that I have created which spots reversal zones based on stochastic RSI indicator combined with MACD indicator.
Potential buy zones are indicated with green columns printed on the chart, and sell zones are in red. a signal is more powerful and accurate whenever its surrounded by black bars before or after.

Divergences Explained by a RaccoonThis video's purpose is to go over the fundamentals of divergences.
How to spot them and the effects they have.
I might make a video later on practical application and how to trade them; as well as how to combine them with other technical analysis tools and techniques.
And I should be doing a stream soon where we just spend an hour hunting divergences on different commodities; whether it's crytpo, stonks, or forex.
I hope this helps those trying to understand divergences.
Let me know if anything seems off or is confusing, I am more than happy to make another video to clarify anything that seems off or incomplete.
Thanks for watching.

AUDUSD (Example Of ATR Indicator Used For Stops And Targets)All Traders should use the ATR indicator on every trade you take. This can set you stop losses and targets and keep Forex trading simple.

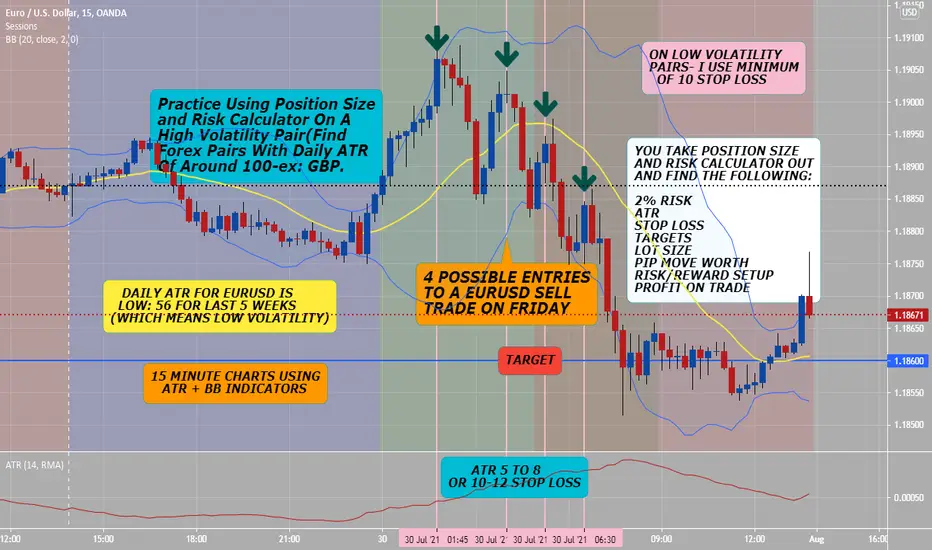
15 Min Chart (ATR + BB indicator) Part 4 of 4Please practice using the Forex position size and risk calculator on all trades you make.
Noted on EURUSD 15 minute chart are:
Four possible entries into a sell trade on Friday
- Low volatility EurUsd has last 5 weeks or 56 ATR [er day. (Hard to scalp or day trades with low volatility pairs)
- I used minimum of 10 stops on low volatility pairs, but consult with ATR and either use 10 pip stop loss and/or X 1.5 to get stop loss to use
This is a scalping or day trading trading strategy, quick trades. Please practice using position size and risk calculator to get: 2% risk, trading lot size, stop loss and target(s) on 15 minute time frames, I look for 1:2 risk reward over higher, how much profit you made and how much one pip move is worth? You need to know this so you can manage risk and set appropriate stops and targets for low volatility and high volatility pairs in Forex.
IF you have a need to be part of the masses and trade EURUSD, then put your efforts into when both London session opens to London session ends.
Why, this covers Tokyo/London overlap and highest most liquid and volume 4 hour time which is London/New York sessions overlapping period.
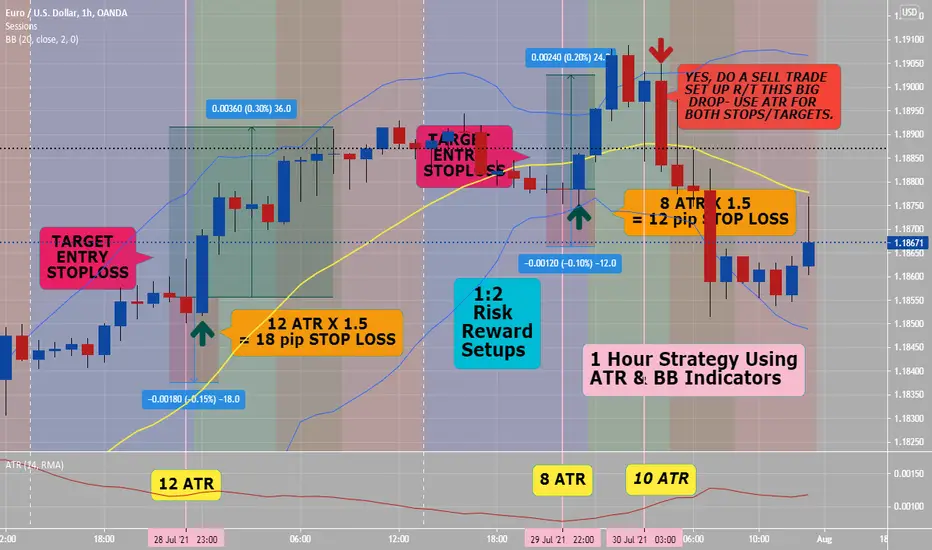
1 Hour Chart (ATR + BB indicator) Part 3 of 4On 1 hour and 15 minute time frames, I would be looking for minimum of 1:2 RR setups.
Both noted examples on EURUSD chart of 1 hour charts you both:
1) Setup at end of Tokyo session (use last 1 hour red candle open) for entry into buy trade of next candle, using ATR x 1.5 for stops and targets, risk 18 pips vs 36 pip reward setup.
2) Setup at end of Tokyo session (use last 1 hour red candle open) for entry into buy trade of next candle, using ATR x 1.5 for stops and targets, risk 12 pips vs 24 pip reward setup.
These trades are either scalp and/or day trades, using both BB indicator and ATR indicator for timing purposes and stops and targets. If price is above BB 20 ema (yellow line), then look for buying trades and if price action is below BB 20 ema (yellow line), then look for selling trades.
NOTE:
From Chart set up of both trades: Please find a position size and risk calculator: Your account size, 2% risk- using noted stop losses and targets-
How much profit did you make? What is your trading lot size? How much USD money is one pip move worth? Do this on all trades you do for risk management.
PRACTICE on Sell trade noted on right side of chart, using 10 ATR, find stop loss, targets, RR setup, trading lot size, 2% of your account, etc...
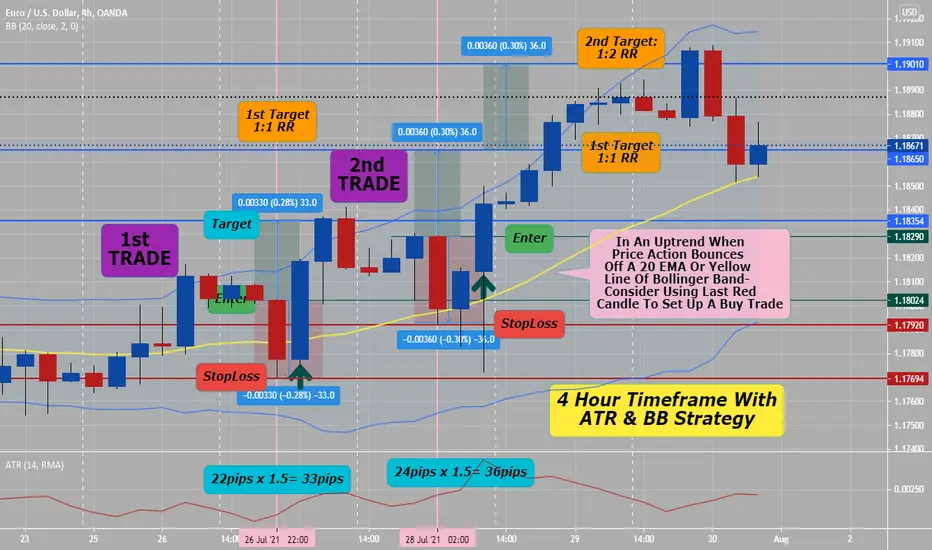
4 Hour Chart (ATR + BB indicator) Part 2 of 4On daily and 4 hour charts, I would only be looking for 1:1 Risk Reward setups using ATR and Bollinger Bands. This is if you are day trading or swinging within the same week time period.
1st example trade (on chart): Uptrend/Bullish trend this past week
1) Look for price action to swing low (make a 4 hour red candle) that hits BB center 20 ema line (yellow), set up a 33 pip stop loss at open of that red candle related to a 22 ATR x 1.5 pips = 33 pip stop loss, entry would be at open of that same red candle and exit/target would be 33 pips above enter. 1:1 RR set ups are great, especially because they win get you high win rate %. This trade would have been done in same day for a 33 pip profit.
2nd example trade (on chart): Uptrend/Bullish trend this past week
2) Look for price action to swing low (make a 4 hour red candle) that hits BB center 20 ema line (yellow), set up a 36 pip stop loss at open of that red candle related to a 24 ATR x 1.5 pips = 36 pip stop loss, entry would be at open of that same red candle and exit/targets would be either at 1st target of 36 pips next day or during two days 2nd target at 72 pips (noted on chart). 1:1 RR to 1: RR set ups are great for 4 hour and daily time frames, because they will get you a high win rate %.
4 Hour Time frames are mostly for swinging at least for one to three days, if you close out all of your trades within the same trading week.
Your should practice calculating lot sizes and risk on these two noted trades, using your account balance, 2% risk and atr/pips noted on trades.
Use ATR (To Set Stop Losses & Targets)ATR (average true range) is I think the best indicator(period)- related to setting your stop losses and targets. This ATR indicator should be part of your plan, trading edge and strategy to utilize on every trade you do.
This is 1st article of four articles related to this subject:
Note: Will be doing three more articles on using ATR on lower time frames: 4 hour, 1 hour and 15 minute in the future.
Using ATR On Daily Chart (see example here)
On chart notice the following:
1) Doji (undecided daily candle at support, low volatility candle) - happened on a Friday
2)Notice 9 day bearish trend prior to daily doji candle
3) This daily doji candle had an ATR of 60 rounded up (fyi). On daily I keep ATR and Stop Loss & Target the same for any daily trade setups
4) Stop Loss/Risk: 60 pips
5) 2% of $5000 account is $100 USD risk on trade
6) $1.66 PER PIP MOVE on EURUSD or trading lot size is: 0.16667
6) This trade would have made you from $100 to $200 USD within this last week (conservatively), by Thursday and/or Friday. (4 to 5 days).
Can you wait? Do you have patience to trade daily? Larger time frames are easier to trade then lower time frames, but it is all relative to personality.

“How To” Video Overview of Indicator “CM_MACD_Ult_MTF_V2”Hello TradingView!!!
-Video Posted on 07-28-2021-
This video is a detailed video overview of the CM MACD Custom Indicator - Multiple Time Frame - V2 Release.
I will post the link to the Indicator within a few minutes after this video goes live on TradingView either in the Link to Related Ideas below, or I'll post a comment below with the link.
Thanks for you patience.
I'm so excited to be back. Please Post and feature requests for this indicator below.

MFI From Scratch
Hello, traders!
As you know, the knowledge of a coin be overbought or oversold can be very profitable for any trader. That's why it's very important to identify these states. Moreover, the indicator that help us has already been invented. Well, today we'll speak aboout Money Flow Index.
The Money Flow Index (MFI) is a technical oscillator that uses price and volume data for identifying overbought or oversold signals in an asset. It can also be used to spot divergences which warn of a trend change in price. The oscillator moves between 0 and 100.
Unlike conventional oscillators such as the Relative Strength Index (RSI), the Money Flow Index incorporates both price and volume data, as opposed to just price. For this reason, some analysts call MFI the volume-weighted RSI.
There are two possible ways of using this oscillator - diverhence and detecting overbought and oversold regions.
It's rather easy to detect divergence of price with MFI. If you don't know whhat divergence is, read our cheat sheet to be aware of such powerful tool.
The overbought and oversold levels are also used to signal possible trading opportunities. Moves below 10 and above 90 are rare. Traders watch for the MFI to move back above 10 to signal a long trade, and to drop below 90 to signal a short trade.
I hope, you'll find the information useful. I try to make the articles that are interesting for me. However, I want to know your oppionoin. Write down to comments what is intersting for you.
