4H Bear Div using RSI/CBCI updateUpdate to RSI/CBCI charting for BTCUSD on 4h - Bear Div spotted using CBCI on RSI method.
Oscillators

Constance Brown Composite Index, RSI, DOSC Exploration Preliminary exploration of Constance Brown's trading style with a focus on divergence plotting with the Composite Index, RSI + Averages, and the Derivative Oscillator.
first, hide the price action + derivative oscillator so they're not visible, and only the RSI + CBCI are visible:
next, plot vertical lines where the CBCI (gray) crosses above or below it's two moving averages (sma11&33, aqua and green):
then, use the CBCI to spot divergences on the RSI, as an indicator of an indicator to spot divergences.
The CBCI was designed to have momentum + not be range bound and to work to spot divs on the RSI, as follows:
then draw the vertical lines from the crossovers on the price action/candlesticks and unhide the chart:
label/check each divergence and unhide the derivative oscillator:
then, mark on the derivative oscillator zero line crosses + directional momentum changes:
Filter out the majority of derivative oscillator zero line crosses and directional changes that occur during div periods that don't overlap:
Finally, filter derivative oscillator signals to congruence to divergence type and plot on chart:

Example of BTCUSD Charting with PAL8H:
1H:
4H:
30m:
EMAs used are 20/50/100. PAL (Price Action Levels) is used to automatically draw the relevant Open/High/Low.

Release: [AU] Waves+Plus version of Waves with components from both Waves Advanced and Mnemosyne. Essentially, Waves+ is highly configurable hybrid wavetrend oscillator and Fibonacci oscillator.
Pictured to the left are the various indicators that represent incremental steps/advancements toward the development and eventual refinement of a hybrid wavetrend fib oscillator.
Waves+ is available as part of the AU indicator set - contact for trial availability and pricing.

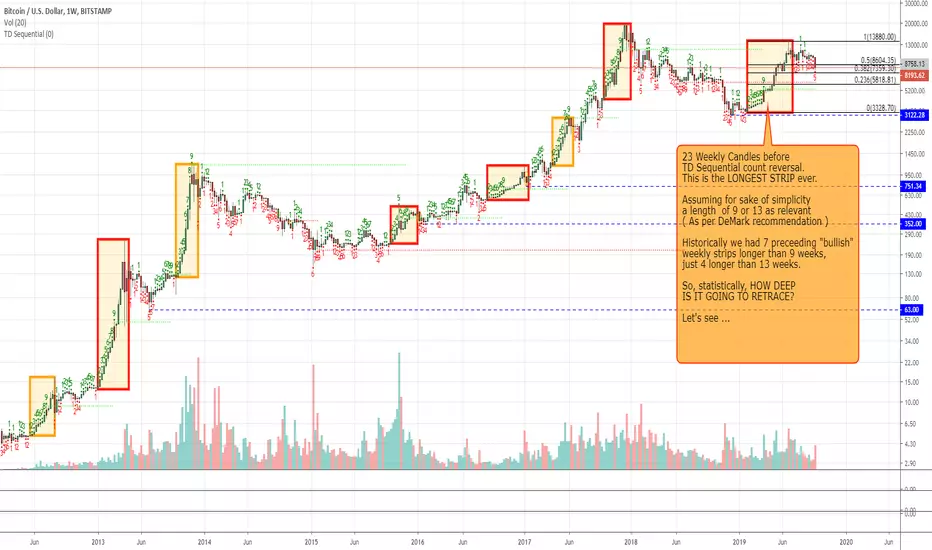
Playground: probabilistic estimation of depth of the retraceI think many among you already know about Tom DeMark "TD Sequential" method.
Here i'm applying that in some pretty unorthodox way, because i find it fascinating.
Let's find the longest weekly sequential strips, as the longest one ever came just into spring 2019.
Let's check what happened AFTER their blow, let's see how deep they retraced.
Let's collect some statistical data we can use for some (pretty basic) trend speculation.
Historically we had just 7 TD sequential strips lasting more than 9 weeks, only 4 lasting more than 13.
The longest strip EVER ( 23 weeks ) just ended in July.
So what can we presume now, given the past examples of long strips retrace ?
Considering just basic FIBs (0.5, 0.382, 0.236), history told there was a straight 100% probability to hit at least 8600$ (FIB 0.5 calculated on the whole strip).
Infact all the 7 previous strips retraced AT VERY LEAST to their own FIB 0.5.
Recent price action confirmed this was true also for the latest strip, so let's move on.
Now there's still a 57% probability to have some weekly close under 7350$ (FIB 0.382), but also a 72% chance as well that price WON'T close a week anymore under 5800$ (FIB 0.236).
This is pretty interesting, given price got down to 7700$ already.
Speaking of wicks ( or intra-week lows ) there's still a 85% probability to see some wick under 7350$, 57% for under 5800$ lows.
That's some pretty high chance of a deep failed low, maybe with a swift recovery on weekly close.
However if we consider only the longest strips ( red squares, longer than 13 weeks ), the probability of a dip under 7350$ is just 50%.
25% chance for some sub 5800$ low.
So after all a dip, if that's the case, may be less severe.
If so all the 7 thousands range would be a pretty good accumulation zone.
---
That's what this pretty small set of data data tells.
So dig into past and look for advices, do your own diligence.
Obviously Future != past , but often it makes a rhyme ...
Have a nice weekend.
** THIS AN EDUCATIONAL AND SIMPLIFIED POST, NOT A TRADING ADVICE ***
Testing performance of Cyber Ensemble Strategy on a model Stock..with the Squeeze Test insensitivity increased to 40.
Performs well even with 0.15% commission.
For best results with my strategy scripts, the parameters needs to be optimized and back tested for a particular chart and timeframe.
Default settings were optimized for Bitcoin (BTC) on the 6hr chart (but appeared to perform well at selected lower timeframes, including the 30mins timeframe).
Cyber Ensemble Strategy -- Base on a complex interplay of different conventional indicators, and an assortment of my own developed filtering (prune and boost) algorithms.
Cyber Ensemble Alerts -- My attempt to try replicate my strategy script as a study, that generates Buy/Sell Alerts (including stop-limit strategic buys/sells) to allow autotrading on exchanges that can execute trades base on TV alerts. This project is a work-in-progress.
Cyber Momentum Strategy -- This script is based on my pSAR derived momentum oscillators set (PRISM) that I personally rely on a lot for my own trades.
The "Alerts" version of this will be developed once Cyber Ensemble Alerts have been perfected.
PRISM -- pSAR derived oscillator and its own RSI/StochRSI, as well as Momentum/Acceleration/Jerk oscillators.

Quick guide on three buy/sell position suggestion scripts.+ Cyber Ensemble Buy/Sell positions signaling is derived from an optimized scoring of a large number of conventional indicators. (Blue/Purple plus Background HeatMap)
+ FG-Divergence is based on my own modified version a MACD style oscillator, with its own accompanying Momentum and Acceleration oscillator. (Light Green/Red)
+ PRISM Signals is based on PRISM, a pSAR derived oscillator coupled with its Momentum/Acceleration/Jerk Oscillator as well as pSAR based RSI and StochRSI. (Bright Green/Red)
—
For best results, users can tweak the parameters and enable/disable specific tests and scoring Thresholds for a specific chart and timeframe, and checking how well they perform wrt historical trends. Timeframe specific presets will be added in the future when I have more time. Please do feel free to play around with the parameters and share them. If they are good, they may be added as a preset in future updates with you credited. These scripts are freshly made, and for now, my focus is to slowly refactor and improve on the code, and tidying up the ordering of the inputs to make them easier for users to navigate and understand what each of them do. In the future, once things are sufficiently improved, I aim to include alert features and release a proper “strategy version” as well, and I may post up a clearer user guide for each one of them.

[Quick Guide] PRISM Signals & PDF indicators.
The PRISM Signals appears to work well especially at lower time-frames (even down to 5 min candles).
The key is to maximizing true-positives is to carefully optimize the input parameters and scoring weights and detection thresholds for a specific given chart and timeframe.
See also the 5 mins chart:
Also shown here is the PDF script, which provides: dynamic Fib levels, pSAR indicator, as well as 2 levels standard deviation bands (disabled here).
The thickest green/red limes are the local-top/bottom lines. Adjust the Fib Input Range accordingly to ensure that the local highs/lows are accurately captured.
The 61.8% levels are the thicker blue lines, and the purple lines are additional levels derived base on the mathematical conjugation between Fib levels.
Again, it is highly recommended to carefully check/optimize the input parameters for a given chart/timeframe against historical trends before proceeding to use it.
This script also provides consecutive higher/lower-highs/lows detection, which is disabled here.
Various features of these scripts can be manually Enabled/Disabled by the users to keep the chart neat.
Even though these scripts are constructed from a set of indicators, it is still highly advised to be used in conjunction with other analysis such as: trendlines, volume, and other indicators, etc., as well as analyzing and comparing with higher/lower timeframes, to help filter out or identify possible risk of false-positives to maximize your success rate.
==========================================================
Indicators used:
PRISM Signals (Color and Stdev bands disabled here) -- Algorithm to generate scoring-based bullish/bearish signals derived from the PRISM oscillators set.
PDF {pSAR /w HiLo Trends + Fib Retrace/Extension Levels} -- Parabolic SAR /w HighLow Trends Indicator/Bar-color-marking + Dynamic Fib Retrace and Extension Level.
Ichimoku Cloud {Cybernetwork} -- Ichimoku Cloud with modified parameters.
Related Indicator:
PRISM Oscillator -- pSAR based oscillator, with RSI/StochRSI as well as Momentum/Acceleration/Jerk indicators
==========================================================
~ * ~ * ~ * ~ * ~ * ~ * ~ * ~ * ~ * ~ * ~ * ~ * ~ * ~ * ~ * ~ * ~ * ~ * ~ * ~ * ~
Note:
In no way is this intended as a financial/investment/trading advice. You are responsible for your own investment decisions and trades.
Please exercise your own judgement for your own trades base on your own risk-aversion level and goals as an investor or a trader. The use of OTHER indicators and analysis in conjunction (tailored to your own style of investing/trading) will help improve confidence of your analysis, for you to determine your own trade decisions.
~ * ~ * ~ * ~ * ~ * ~ * ~ * ~ * ~ * ~ * ~ * ~ * ~ * ~ * ~ * ~ * ~ * ~ * ~ * ~ * ~
Please check out my other indicators sets and series, e.g.
LIVIDITIUM (dynamic levels),
AEONDRIFT (multi-levels standard deviation bands),
FUSIONGAPS (MA based oscillators),
MAJESTIC (Momentum/Acceleration/Jerk Oscillators),
and more to come.
Constructive feedback and suggestions are welcome.
If you like any of my set of indicators, and it has benefited you in some ways, please consider tipping a little to my HRT fund. =D
cybernetwork @ EOS
37DzRVwodp5UZBYjCKvVoZ5bDdDqhr7798 @ BTC
MPr8Zhmpsx2uh3F5R4WD98MRJJpwuLBhA3 @ LTC
1Je6c1vvSCW7V2vA6RYDt6CEvqGYgT44F4 @ BCH
AS259bXGthuj4VZ1QPzD39W3ut4fQV5giC @ NEO
rDonew8fRDkZFv7dZYe5w3L1vJSE51zFAx @ Ripple XRP
0xc0161d27201914FC0bAe5e350a193c8658fc4742 @ ETH
GAX6UDAJ52OGZW4FVVG3WLGIOJLGG2C7CTO5ZDUK2P6M6QMYBJMSJTDL @ Stellar XLM
xrb_16s8cj8eoangfa96shsnkir3wctdzy76ajui4zexek6xmqssweu85rdjxrt4 @ Nano
~ JuniAiko
(=^~^=)v~

Other important indicators!
RSI (Relatieve Strenght Index) indicator
Bollinger band (C)
Next to the: 4EMA indicator (4 moving average Exponential)
See also my first publish with MACD indicator (see my profile!).

How to use the Fast LIVIDITIUM dynamic level & PRISM oscillatorReading the chart using the FLVDT and PRISM oscillator.

#DeMARK #Sequential Tutorial 2 - Trend & Reversal (Bear -> Bull)Note:
This tutorial is based on the comments made in Jason Perl's book DeMARK Indicators.
I strongly recommend you to read this book if you want more in-depth knowledge.
I publish this tutorial for educational purposes only
TD Countdown - Bullish Case
1. Definition
TD Countdown is the second component of TD Sequential and cannot come into play until a TD Setup formation is complete.
Once the first condition is met, TD Countdown can begin, from the close of bar nine of TD Setup (inclusive), onward.
TD Countdown works in either direction: For the bullish case, the increment occurs when the current close is lower than the low two bars earlier. This price relationship is an important distinction from TD Setup, because the market must be trending for TD Countdown to objectively identify the likely exhaustion point for a trend reversal
In my TD Enhanced Sequential indicator , TD Countdown is represented by circled numbers from 1 to 13. Note these numbers from the countdown phase: 3/4/6/7/9/10 were replaced by a special character.
2. Requirement
# Prerequisite:
As soon as a TD Buy Setup is in place, we can start looking for the first bar of a TD Buy Countdown
# To initiate a TD Buy Countdown
With bar nine of the TD Buy Setup in place, there must be a close less than, or equal to, the low two bars earlier.
Bar nine of a TD Buy Setup can also be bar one of a TD Buy Countdown if it satisfies the previous conditions.
Unlike TD Buy Setup, TD Buy Countdown doesn’t have to be an uninterrupted sequence of qualifying price bars; the TD Buy Countdown process simply stops when markets are trading sideways, and resumes when prices start trending lower again.
# Nested TD Buy Countdown
On bar 9 Setups, an additional step exists to check if a Countdown is already in place.
In case a previous Countdown (A) is detected, a new nested Countdown (B) initiate without ending the (A) Countdown.
You will be able to detect the start of a nested Countdown with a clear graphical signal on 9 Setups:
Start of Normal Countdown: 9
Start of Nested Countdown:
Color Codes:
Green/Red : Perfected BUY/SELL Setup
Gray: Unperfected BUY/SELL Setup
# To Complete a TD Buy Countdown
The low of TD Buy Countdown bar thirteen must be less than, or equal to, the close of TD Buy Countdown bar eight, and
The close of TD Buy Countdown bar thirteen must be less than, or equal to, the low two bars earlier.
When the market fails to meet these conditions, TD Buy Countdown bar thirteen is deferred and a plus sign (+) appears where the number thirteen would otherwise have been.
# TD Buy countdown cancellation
Although a developing TD Buy Countdown doesn’t reset itself if there is an interruption in the sequence of closes each one of which is less than, or equal to, the low two bars earlier, there are a number of built-in conditions, or filters, to help the trader recognize when the dynamics of the market are changing. These filters erase the as-yet-incomplete TD Buy Countdown.
If the price action rallies and generates a TD Sell Setup, or
If the market trades higher and posts a true low above the true high of the prior TD Buy Setup—that is, TDST resistance.
As we may have now, 2 countdowns in place at the same moment, it is useful to identify which countdown is being cancelled. The "X" character indicates a Countdown cancel.
These colors clarify which countdown is impacted:
Green/Red : Main countdown
Gray: Nested Countdown
This completes the second tutorial. More to come.
Also check my profile to access more content.
Take care
MATHR3E

A Renko Strategy for Trading - Part 9This is intended more as educational material on a strategy for using renko charts. To begin with, I'll be using USOil in the examples but will include other markets as I continue through the series. The material is not intended to prescribe or recommend actual trades as the decision to place trades is the responsibility of each individual who trades as they assume all risks for their own positions and accounts.
Chart setup :
(Part 1)
Double Exponential Moving Average (DEMA) 12 black line
Double Exponential Moving Average (DEMA) 20 red line
Parabolic SAR (PSAR) 0.09/0.09/.23 blue circles
Simple Moving Average (SA) 20 blue line
(Part 2)
Stochastics 5, 3, 3 with boundaries 80/20 dark blue/light blue
Stochastics 50, 3, 3 with boundaries 55/45 red
Overlay these two on one indicator. Refer to 'Part 2' as to how to do this
(Part 3)
True Strength Indicator (TSI) 14/4/4 dark blue/ red
Directional Movement Indicator DMI 14/14 ADX-dark green, +DI-dark blue, -DI-red
Renko Chart Settings
Crude Oil (TVC:USOil): renko/traditional/blksize .05/.10/.25
Natural Gas (ngas): renko/traditional/blksize .005/.010/.025
Soybeans/Wheat/Corn (soybnusd/wheatusd/cornusd): can use the ngas setup
S&P 500 (spx500usd): renko/traditional/blksize 2.5/5.0/12.5
Euros (EURUSD): renko/traditional/blksize .0005/.0010/.0025

A Renko Strategy for Trading - Part 8This is intended more as educational material on a strategy for using renko charts. To begin with, I'll be using USOil in the examples but will include other markets as I continue through the series. The material is not intended to prescribe or recommend actual trades as the decision to place trades is the responsibility of each individual who trades as they assume all risks for their own positions and accounts.
www.investopedia.com
Chart setup :
(Part 1)
Double Exponential Moving Average (DEMA) 12 black line
Double Exponential Moving Average (DEMA) 20 red line
Parabolic SAR (PSAR) 0.09/0.09/.23 blue circles
Simple Moving Average (SA) 20 blue line
(Part 2)
Stochastics 5, 3, 3 with boundaries 80/20 dark blue/light blue
Stochastics 50, 3, 3 with boundaries 55/45 red
Overlay these two on one indicator. Refer to 'Part 2' as to how to do this
(Part 3)
True Strength Indicator (TSI) 14/4/4 dark blue/ red
Directional Movement Indicator DMI 14/14 ADX-dark green, +DI-dark blue, -DI-red
Renko Chart Settings
Crude Oil (TVC:USOil): renko/traditional/blksize .05/.10/.25
Natural Gas (ngas): renko/traditional/blksize .005/.010/.025
Soybeans/Wheat/Corn (soybnusd/wheatusd/cornusd): can use the ngas setup
S&P 500 (spx500usd): renko/traditional/blksize 2.5/5.0/12.5
Euros (EURUSD): renko/traditional/blksize .0005/.0010/.0025

How to use my FG oscillator in conjunction with DFG oscillatorLooks like BTCUSD still have a little bit further down to go, but is winding up for a next significant pump.
DEMO of the use of my FUSIONGAPS (FG) and DIFFERENTIAL FUSIONGAPS (DFG) scripts, with my LIVIDITIUM indicators set.
Not a financial/trading/investment advice. Exercise your own judgement and take responsibility for your own trades. ;)
See also:
If you like this set of indicators, and it has benefited you in some ways, please consider tipping a little to my HRT fund. =D
cybernetwork @ EOS
37DzRVwodp5UZBYjCKvVoZ5bDdDqhr7798 @ BTC
MPr8Zhmpsx2uh3F5R4WD98MRJJpwuLBhA3 @ LTC
1Je6c1vvSCW7V2vA6RYDt6CEvqGYgT44F4 @ BCH
AS259bXGthuj4VZ1QPzD39W3ut4fQV5giC @ NEO
rDonew8fRDkZFv7dZYe5w3L1vJSE51zFAx @ Ripple XRP
0xc0161d27201914FC0bAe5e350a193c8658fc4742 @ ETH
GAX6UDAJ52OGZW4FVVG3WLGIOJLGG2C7CTO5ZDUK2P6M6QMYBJMSJTDL @ Stellar XLM
xrb_16s8cj8eoangfa96shsnkir3wctdzy76ajui4zexek6xmqssweu85rdjxrt4 @ Nano
~JuniAiko
(=^~^=)v~

Bull/Bear cycle indication: Using the FUSIONGAPS oscillatorFUSIONGAPS (FG):
DIFFERENTIAL FUSIONGAPS (DFG):
Currently showing the BTCUSD (1M) chart, with only the 50/15 DMA FG oscillator shown.
The y-axis for the FG and DFG charts are both set to log-scale simply to allow comparison with historical behavior here.

Trading Divergences - An Alternate View for New TradersTrading divergences is a very common technical analysis strategy, but it comes with one big problem: the most common divergences (not hidden) trade against the trend. This means that new traders can often get into trouble by constantly looking for, and trading, against a dominant trend.
Here's an idea to help you become more profitable over the long-term: identify divergences on your chosen momentum indicator, but only trade on trend continuation signals. I'm not saying you need to do this forever, as once you're experienced you can trade both pullbacks and continuations - but doing so requires multiple layers of confirmation, and a lot of knowledge/planning/experience.
By trading trend continuation signals after divergences, you're stacking the odds in your favour by going with the dominant trend. You're also training your eye to see divergences, and seeing how the markets react to divergences. For new traders this can be a valuable lesson in the power of momentum in financial markets.
So, what are trend continuation signals? It depends on your chosen momentum indicator, so I can only provide general ideas; you need to adapt things according to what you're using. My chart contains a custom momentum indicator, loosely based on the RSI. However, it's far smoother than the RSI, so I can reliably trade precise signals (e.g. for me, a cross of 0). On the RSI, you may choose something a bit further down the scale, for example, a cross below Oversold (20/30). If you're using a Stochastic indicator, you may trade a cross below Overbought (70/80). If you don't understand why I'm suggesting you trade signals at the opposite end of the scale for RSI and Stochastic, let me know.
Hopefully this all makes sense, and remember that it's just an idea if you're a new trader and struggling to make good trades.
Let me know if you have any queries.
DD

How TO Use RSI (Relative Strength Index) This is a quick video explaining how i use the RSI indicator to know when to get into a trade for a bull run or a bear run.....

How to: "Auto-Trendline Strategy"RULES: -----------------Auto-Trendline Strategy ------------------------
For LONGS:
1- 3 Green squares on the Trend meter (Oscillators)
2- Green Trend line price Break
3 - Price above 10 EMA
4- Watch for support/resistance Gap in between.
5- Open 1:1 Risk reward ratio Long based on the largest wick of last 8 candles.
For SHORTS:
1- 3 Red squares on the Trend meter (Oscillators)
2- Red Trend line price Break
3 - Price below 10 EMA
4- Watch for support/resistance Gap in between.
5- Open 1:1 Risk reward ratio short based on the largest wick of last 8 candles.
In our case rule 1,2 and 3 are coded in the triangles so you only need 2 indicators (Auto-trendline strategy) (Support/Resistance zones)
You only need to follow rule 4 and 5.
DO NOT WAIT FOR FULL TP, THIS IS A SCALPING STRATEGY DONT GET GREEDY
when alt season begins this strategy is gonna be golden =) enjoy

#DeMARK #Sequential Tutorial 1Note:
This tutorial is based on the comments made in Jason Perl's book DeMARK Indicators.
I strongly recommend you to read this book if you want more in-depth knowledge.
I publish this tutorial for educational purposes only
TD Setup
TD Setup is the first component of TD Sequential. It determines whether a market is likely to be confined to a trading range or starting a directional trend.
TD Setup works in either direction: It consists of a nine consecutive closes; each one than the corresponding close four bars earlier.
In the TD+ Enhanced Sequential indicator, TD Setup is represented by numbers from 1 to 9.
1. Bullish case (TD Buy Setup)
# Definition:
Step1: Bearish TD Price Flip.
The prerequisite for a TD Buy Setup is a Bearish TD Price Flip, which indicates a switch from positive to negative momentum.
TD Price Flip is bar 1 (Red) out of 9.
Step2: TD Buy Setup
After a bearish TD Price Flip, there must be nine consecutive closes; each one less than the corresponding close four bars earlier.
# TD Buy Setup “Perfection”:
The low of bars eight or nine of the TD Buy Setup or a subsequent low must be less than, or equal to, the lows of bars six and seven of the TD Buy Setup
How to differentiate perfected and unperfected Buy Setup within TD+ Enhanced Sequential Indicator:
Perfected Buy Setup is a RED character '9'
Unperfected Buy Setup is a GRAY character '9'
# Interruption of a TD Buy Setup:
If, at any point, the sequence is interrupted, the developing TD Buy Setup will be canceled and must begin anew.
2. Bearish case (TD Sell Setup)
# Definition:
Step1: Bullish TD Price Flip
The prerequisite for a TD Sell Setup is a Bullish TD Price Flip, which indicates a switch from negative to positive momentum.
TD Price Flip is bar 1 (Green) out of 9
Step2: TD Sell Setup
After a Bullish TD Price Flip, there must be nine consecutive closes; each one greater than the corresponding close four bars earlier.
# TD Sell Setup “Perfection”
The high of TD Sell Setup bars eight or nine or a subsequent high must be greater than, or equal to, the highs of TD Sell Setup bars six and seven
How to differentiate perfected and unperfected Buy Setup within TD+ Enhanced Sequential Indicator:
Perfected Sell Setup is a GREEN character '9'
Unperfected Sell Setup is a GRAY character '9'
# Interruption of a TD Sell Setup
If at any point, the sequence is interrupted, The developing TD Sell Setup will be canceled and must begin anew.
This completes the first tutorial. More to come.
Also check my profile to access more content.
Take care
MATHR3E

A Renko Strategy for Trading - Part 7 Refactor/RefinementThis is intended more as educational material on a strategy for using renko charts. To begin with, I'll be using USOil in the examples but will include other markets as I continue through the series. The material is not intended to prescribe or recommend actual trades as the decision to place trades is the responsibility of each individual who trades as they assume all risks for their own positions and accounts.
(Part 1)
Double Exponential Moving Average (DEMA) 12 black line
Double Exponential Moving Average (DEMA) 20 red line
Parabolic SAR (PSAR) 0.09/0.09/.23 blue circles
Simple Moving Average (SA) 20 blue line
(Part 2)
Stochastics 5, 3, 3 with boundaries 80/20 dark blue/light blue
Stochastics 50, 3, 3 with boundaries 55/45 red
Overlay these two on one indicator. Refer to 'Part 2' as to how to do this
(Part 3)
True Strength Indicator (TSI) 14/4/4 dark blue/ red
Directional Movement Indicator DMI 14/14 ADX-dark green, +DI-dark blue, -DI-red

Early Warnings: using Trend Shift Indicator divergence.The attached chart has much of the explanation.
Here are the highlights:
TSI gives early sell warning via high values (near 170), relative highs, or in rare cases an "x" signal.
Divergence with price is also a key indicator of future action.
Examine the divergence illustrated during the price drop and the (still red) TSI values.
I hope this is helpful. Feedback appreciated.

A Renko Strategy for Trading - Part 6This is intended more as educational material on a strategy for using renko charts. To begin with, I'll be using USOil in the examples but will include other markets as I continue through the series. The material is not intended to prescribe or recommend actual trades as the decision to place trades is the responsibility of each individual who trades as they assume all risks for their own positions and accounts.
Chart setup:
(Part 1)
Double Exponential Moving Average (DEMA) 12 black line
Double Exponential Moving Average (DEMA) 20 red line
Parabolic SAR (PSAR) 0.09/0.09/.23 blue circles
Simple Moving Average (SA) 20 blue line
(Part 2)
Stochastics 5, 3, 3 with boundaries 80/20 dark blue/light blue
Stochastics 50, 3, 3 with boundaries 55/45 red
Overlay these two on one indicator. Refer to 'Part 2' as to how to do this
(Part 3)
True Strength Indicator (TSI) 14/4/4 dark blue/ red
Directional Movement Indicator DMI 14/14 ADX-dark green, +DI-dark blue, -DI-red
Part 6
Only use 2 block sizes SxS to trade with. One for placing orders and one to confirm plan
Previously I had many different block size charts of the same instrument but I think that causes more confusion the benefit
Set interval to 1 minute for all charts and block sizes
Potential block sizes to consider or experiment with:
Crude Oil: .10/.20
Currencies: .0005/.0010
BTCUSD: 10/20
SPX500: 2.5/5.0
Ags: .005/.010
I use BTCUSD for training purposes along with the TV paper trading capabilities.
Recap:
Basic analogy is that of an unconscious patient brought into an emergency department and a triage is performed to determine a plan of treatment. In this scenario, price is the patient, the indicators are probes and tests against the patient, and you're the ED physician performing the triage with the treatment plan the trading plan.
This is a reactive type of trading plan. Based on observation of price, volume and indicators, a reactive order is placed with a somewhat tight stop
Depending on trading style or success rate the exit strategy could be either a target method or trailing stop strategy
There are guidelines for adding positions or re-entry based on choice in previous step
Basic Strategy:
Buying
(basic)
12/20 DEMA where 12 crosses up over the 20 and + 1 block
(filters)
PSAR and price have swapped where price is greater than PSAR
Stoch (short term - blue) is or has recently crossed from near 0 up over 20
Stoch (long term - red) is or has recently crossed from near 0 up over 20
TSI (blue) has crossed up over the signal line (red)
DMI +DI moving up with -DI dropping. Ideally +DI crossed up over -DI at or soon after DEMA cross

A Renko Strategy for Trading - Part 5This is intended more as educational material on a strategy for using renko charts. To begin with, I'll be using USOil in the examples but will include other markets as I continue through the series. The material is not intended to prescribe or recommend actual trades as the decision to place trades is the responsibility of each individual who trades as they assume all risks for their own positions and accounts.
Chart setup:
(Part 1)
Double Exponential Moving Average (DEMA) 12 black line
Double Exponential Moving Average (DEMA) 20 red line
Parabolic SAR (PSAR) 0.09/0.09/.23 blue circles
Simple Moving Average (SA) 20 blue line
(Part 2)
Stochastics 5, 3, 3 with boundaries 80/20 dark blue/light blue
Stochastics 50, 3, 3 with boundaries 55/45 red
Overlay these two on one indicator. Refer to 'Part 2' as to how to do this
(Part 3)
True Strength Indicator (TSI) 14/4/4 dark blue/ red
Directional Movement Indicator DMI 14/14 ADX-dark green, +DI-dark blue, -DI-red
