EURUSD identifying dist. with RSI/15 min (ref.)RSI @ 7
oversold @ 75
Overbought @ 25
VWMA @ 100
Avoid selling into support (strength)
Avoid buying into resistance (weakness)
Oscillators

Overbought to Oversold - Keep It Simple, Stupid!After exploring the depths of profit taker heaven and stop loss hell, after combining many different indicators, finding correlations with momentum, trend, volatility, you name it... After trying to adjust the strategies to different assets, asset classes, market conditions... After finding out that each of these steps are way more difficult than I thought and will require much more rigor and a start from scratch...
I remembered the golden rule of strategy...
"Keep it simple, stupid!"
When others are buying like rabid dogs, you sell...
When others are selling like mad monkeys, you buy...
When others are greedy, you are fearful... When others are fearful, you are greedy...
So, we trade from overbought to oversold. No profit takers, no stop losses, no optimization for a specific stock or time frame or asset class, no correlation with other indicators... Just overbought to oversold.
Win rate of 90+%, profit factor of over 5.0, compared to holding the stock indefinitely with a loss of 80%.
Happy trading!

Kyber Network (KNC USDT) - Breakdown of Recent Trades I recently took two discretionary positions on KNC/USDT. In this analysis I've documented my thought process and execution sequentially from left to right in the call outs.
In these trades I used several methods of analysis.
1. Chart Patterns
My first trade entry was predicated upon a Rectangle Top Pattern I identified KNC forming. Rectangle Tops occur during bullish up trends and when the overall market is bullish, as altcoins currently are, they have a high probability of breaking to the upside.
2. Trend Analysis
Fundamental to my trading strategy is trading in the direction of the overall trend. Trading against the dominant trend is like stepping over dollars to pick up pennies. Using the Daily and 4HR time frame, I identified that KNC was above my Base Line indicator, therefore confirming a bullish trend and that I should be trading to the long side.
3. Target Measurement
For my initial trade I used Bulkowski's measurement method for Rectangle Tops, measuring the difference from Resistance to Support and adding that to Resistance. This proved to be successful, however my first trade ended up running quite a bit beyond my target. For this reason I used my primary method of profit taking, 50/50. I take 50% of my profit at a pre-determined level and allow the rest of my position to run to take advantage of powerful trends.
4. Indicator Support
Utilizing my ICYSbot indicator and strategy to help supplement entry and exit conditions.
5. Patience and Risk Management
I used a position sizing strategy where a pre-determined percentage of my account is at risk should my trade hit the stop loss. In this case, I personally used 2% risk per trade. I also did not rush these trades, I let price evolve and the trend emerge as it did. I attached no personal bias or feelings toward the trade.
Overall, quite happy with these trades. I hope this post was helpful in providing insight into how I view the markets and trade execution. Thank you for your support.
Trade safely!

Awesome OscillatorThe Awesome Oscillator (AO) is displayed as a histogram showing the market momentum based on a comparison of the simple moving average (SMA) of the last 5 price bars median to the simple moving average of the last 34 price bars median.
MEDIAN PRICE = (HIGH+LOW)/2
AO = SMA(MEDIAN PRICE, 5)-SMA(MEDIAN PRICE, 34)
When the momentum of the past 5 bars is weak compared to that of the 34 bar period, the AO displays this shift as a red bar. When the recent 5 bar momentum is stronger, the AO displays the shift as a green bar. The AO displays these shifts by a series of red and green bars. Series of red bars indicate declining bias. Series of green bars indicates rising bias.
Related to the AO are Zero Line Cross Over , Twin Peaks Patterns , and Price/Momentum Divergence . When the AO is added to other technical indicators, such as Divergent Bars and Bollinger Bands, traders are able to assess which way a stock is likely to move. The AO can help see what is coming!
Zero Line Cross Over
When the AO crosses over the zero line, moving from above the zero line to below the zero line, this is a declining bias indicator. A rising bias is indicated when the AO crosses over the zero line, moving from below to above.
Twin Peaks
The Twin Peaks pattern indicates a declining bias when the AO forms a series of green and red bars where each transition from green to red (a peak) is smaller than the previous peak.
A rising bias is indicated when the AO forms a series of green and red bars where each transition from green to red (a peak) is larger than the previous peak.
Price/Momentum Divergence
Declining Bias - When the AO shows declining momentum and, during the same time period the price of the stock is showing a rising trend (higher highs and higher lows), there is divergence that is forecasting an eventual decline in the price. When momentum weakens, price may still rise for a period however, without momentum the price will snap back because there is not enough buying volume to maintain the upward price momentum. Imagine a rubber band stretched between the two ends of the “V” formed by the two trend lines.
In the chart example above, you can see the strong divergence between rising price and declining momentum. The price ended up snapping back in line with the AO and then continued to move lower.
Rising Bias - When the AO shows rising momentum and, during the same time period the price of the stock is showing a declining trend (lower lows and lower highs), there is divergence that is forecasting an eventual rise in the price of the stock. When momentum strengthens, price may still decline for a period however, eventually increasing momentum will push the price higher.

The Holy Grail of RSI - How to use RSI Effectively 4 BIG PROFITSHello Traders,
This video explains how I use RSI to generate big returns in the Forex market. RSI has always been one of my favorite leading indicators I use when looking for confirmations. I highly recommend it. Take a few minutes to watch my video and learn how to use it effectively for intraday trading.
Trade Safe - Trade Well
~Michael Harding


BTCUSD 4 hour RSI signalling RSI sensitivity at 7
Instead of 70/30, levels are set at 80/20.
Using RSI as an adjunct/signal tool. Note the volume anytime RSI breaks the 20 level. You can set an alert at 20/30. Whenever price breaks this level you will be alerted and there may be a potential long situation setting up.
RSI can convey divergences between price and volume.
Also can be used as a final confirmation. for example, you are about to enter long but notice RSI hovering around the 50 level: Middle of range, not ideal.
Takes patience but there are opportunities off of the 20 RSI if you understand volume.
practice*

EURUSD 1H RENKO CHART STRATEGY #2The second simple Renko Trading Strategy system is an indicator based strategy that uses price-momentum divergence to identify trend reversals.
Renko Trading Strategy #2
For this Renko trading strategy, we only need to use the RSI indicator. We can use a 14- period or a 20-period RSI indicator. So, use the same period as the ATR 14 or 20 Renko brick size.
After we spot the momentum divergence an entry signal is triggered once we get a reversal. On the Renko chart, a trend reversal is set in motion once the brick changes color. In this case, when we spot a bearish divergence, enter a short position after the brick turns red.
For bullish divergence, wait for the brick to turn green.
We exit our profitable trade once another reversal pattern is formed in the opposite direction of our trade. As a method to protect our account balance and not lose too much, you can place your SL above and below the swing point developed after your entry.
A lot of the noise inherent in regular time-based charts are eradicated. So, if you trade with Renko charts, spotting divergence and trend reversals are a lot easier. The RSI is the best indicator to use with Renko.
Read the previous Renko Chart post to learn about Renko chart system.

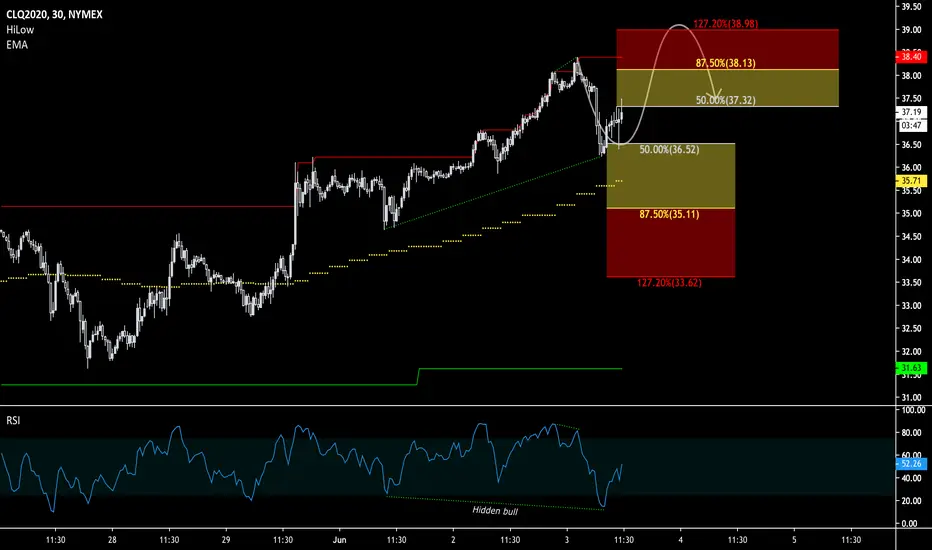
CLQ0: Corrective Formation Oil has been very bullish as of lately; the September delivery contract is up by almost 100% from its YTD low. The hidden bullish divergence implies a significant amount of pullback continuation players in the market. Trying to follow the momentum by buying dips and being alert for signs of bearish reversal is the prudent approach. The risk of a fast bear action that sheds at least 1/8th of the value is ever more present the further upside oil sees from here.
RSISometimes when the RSI is at 72, (overbought) you just need to short. We can clearly see that a simple look at it would have increased your profits. Personally, when ever it is over 70 or below 30, I always act corresponding to it. Remember trading is risky and things can go sideways fast!

USDJYP RSI Training referenceDowntrend
RSI (10) negative divergence into resistance with supply expansion
RSI 80/20
Diminished demand at test area (neckline) with supply in the background
Hypothetical push through entry to initial profit area .39%
Training reference/practice

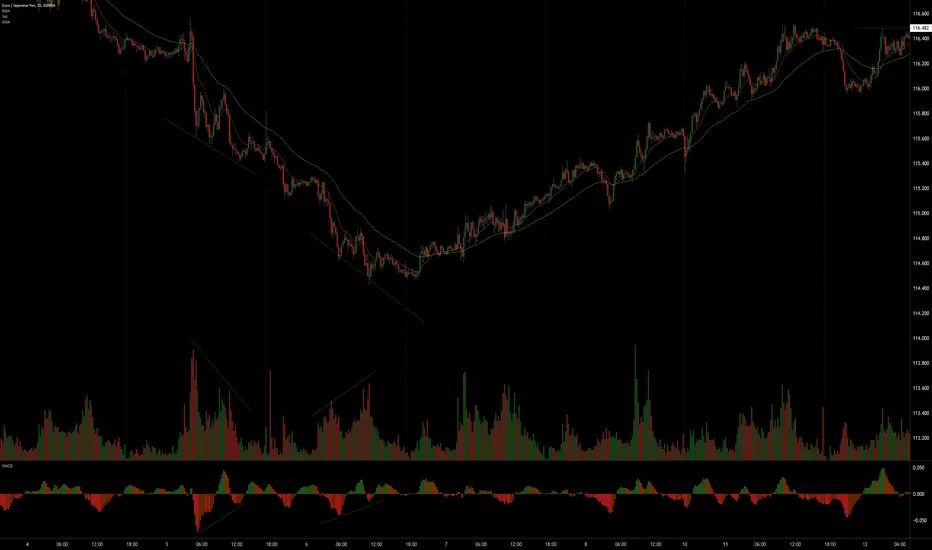
EURJPY how good are you part 5: Validating a divergenceOne positive divergence led to lower prices (failed divergence).
One positive divergence led to a trend reversal.
Why?
WHY IS MY TRADE STILL RED?? When will I see profits??!This a brief tutorial explaining pullbacks/retests/drawdowns in the market. I hope this helps put your mind at ease.
Example shown is of DAX30/GER30
Telegram @RichDadBre

NISON - SWING TRADING STRATEGIESNISON - SWING TRADING STRATEGIES
PB&J - Pullback to Sweetspot
TT9 - Trading The 9
Trailing Stop


Judge the price action momentum - rising wedge pattern and RSIThere are a number of ways to judge the price action momentum. In the previous post, I show you using trend channel as an alternative to up wave or upward thrust to gauge the buying or selling momentum.
In this video, I also adopt the same example S&P 500 futures ( CME_MINI:ES1! ) to show you using the popular pattern - rising wedge and RSI indicator to achieve the same objective.
Yet, what I would like to emphasize is to understand the rationale behind the pattern and the indicator, which we can always go back to the first principle to find out, i.e. why a rising wedge is bearish in nature or what bearish divergence in RSI actually means?
Once you understand the rationale or the first principle about the price action momentum, you can start trading without memorizing every single pattern or indicator if you prefer.

Divergences basics: types of divergences and how to trade them.Introduction and practical sample of how to trade divergences (in Russian).

4H Support / Resistance with RSI Day Trading StrategyRSI = Blue, EMA of RSI = Red.
RSI 14, EMA 45
Long Rules:
1) RSI > EMA RSI = look for long setups
2) Resistance is broken ( a new high )
3) Price rejects (pulls away) from the previous resistance
4) RSI > EMA RSI >> 50
Short Rules:
1) RSI < EMA RSI = look for short setups
2) Support is broken ( a new low)
3) Price rejects (pulls away) from the previous support
4) RSI < EMA RSI << 50
I typically like to place a stop loss at the top of the closest resistance (if going short) and at the bottom of the closest support (if going long) and TP 1:1.
Another method is to go for partial profit at the closest support/resistance and move the stop to breakeven to catch longer trades.
3/4 trade setups in the past month on AUDUSD
FLAGS:
*the setup on the 20th of March was a working short position, but the strategy is looking long.
*the setup on the 31st of March was not validated as the RSI is not > EMA of RSI

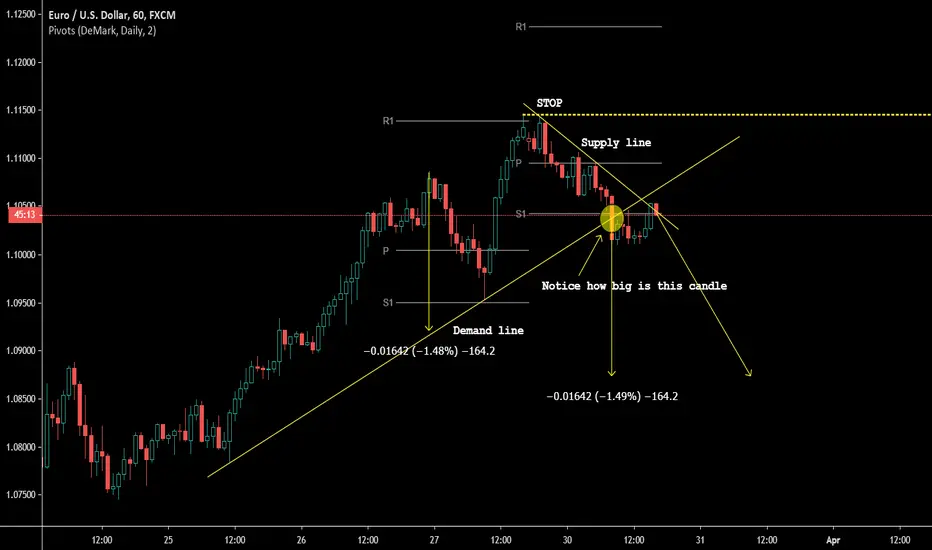
Demark Trendline and Monthly CamarillaHere you can see a perfect setup using Demark trendline breakout.
Price broke Monthly CAMS4 (month floor), hit CAMS5 (did not plot that) and reversed towards the floor.
With Demark Trendline technique we could catch all the breakout reversal to the pip.
One could reenter the longs many times at Demarks Daily Pivots or S1 support.
Market is predictable as you see. You just need the right tools.
I also demonstrated how target is projected.
Demark Trendline works also well with calssic monthly pivots and weekly pivots too.
But on 4 hours I would use monthly Camarilla or Monthly Classic Pivots which are very accurate.

Commitment of traders reportWHAT IS IT
The Commitment Of Traders (CoT) is a report issued by the Commodity Futures Trading Commission (CFTC) , one of the most important trading insitutionsof the American government. The report has the purpose of transparently showing market dynamics to the all the people involved or interested in the matter.
The COT report show all currently open positions (open interest) of the future and options market, where 20 or more traders hold positions for an amount greater or equal to the minimum amount amount established by the CFTC .
The report is issued every Friday at 3:30 P.M. (Eastern Standard Time, hence UTC-5). Each report normally contains data until previous Tuesday. CFTC usually receives data on Wednesday morning from the reporting firms (i.e.: Future Commission Merchants, Financial Insititutions, Brokers or International Stock Exchanges). After some verifications, CFTC publish data the following Friday. For each market, data are provided in terms of existing (still open) LONG and SHORT positions.
TYPES OF REPORTS
There are 4 types of report:
1) Legacy
It contains data split by stock exchange. This report has two different variants: "futures only", that contains data related to the futures market only, and "combined", that contains aggregated data for futures and options market. All the reported positions in this report are split in two main market actors categories: Commercials (or Large Speculators) and Non-Commercials
2) Supplemental
It includes contracts related to 13 selected agricultural market commodities. This kind of report split positions in 3 market actors categories: Commercials (or Large Speculators), Non-Commercials and Index Traders. Differently from Legacy report, the Supplemental is provided in the "combined" format only, hence contains data for both futures and options market
3) Disaggregated
This report contains the same data issued in the Legacy report, but with a more detailed drill down in terms of representation. First of all, it presents data split in 5 macro-categories: Agriculture, Petroleum and Products, Natural Gas and Products, Electricity, Metals and Other. Moreover, the report shows open positions/interests of 4 market actors categories: Producer/Merchant/Processor/User, Swap Dealers, Managed Money e Other Reportables. Aggregating data of this report, it is possible to obtain same data of Legacy report, hence this is a detailed view of data contained in the Legacy report. The Disaggregated, as well as the Legacy one, is available as "futures only" and "combined" variants
4) Traders in Financial Futures (TFF)
This report includes contracts related to currencies, US Treasury Bonds, Eurodollar deposits, VIX shares and Bloomberg Index only. The reports shows open interests of 4 market actors categories: Dealer/Intermediary, Asset Manager/Institutional, Leveraged Funds e Other Reportables. Last, also this report is available as "futures only" and "combined" variants
REPORT FORMATS
Legacy and Disaggregated reports are provided in two formats: short (synthetic) and long (extended). Both these formats contain same data, but long format contains also the concentration of open positions in the hands of the major 4 and 8 market investors at the moment of data collection, while short format does not contains any data about concentration.
TFF report is available in long format only, while the Supplemental is available in the short format only.
Report type Scope Format
Futures Combined Long Short
Legacy ✓ ✓ ✓ ✓
Disaggregated ✓ ✓ ✓ ✓
TTFF ✓ ✓ ✓ X
Supplemental X ✓ X ✓
Legacy report
As said above, market actors in Legacy report are divided in 2 categories:
Non-Commercials , or Large Speculators : they are market speculators as well as hedge funds. This category normally uses financial leverage to amplify variation of derivative asset and has an aggressive behavior in the market. They use rigid stop loss policies and, when the market falls below certain levels, they reverse positions on the other side. The main purpose of Large Speculators is not the asset they buy or sell, but to obtain a net profit from the buy/sell cycle. They normally have a trend following behavior.
Commercials buy futures just because they are interested in the underlying asset and try to hedge their financial exposition related to the commercial activity with the assets they are interested in. These market actors hold more than 50% of open positions in the US futures market and normally they go against the price trend: they sell when the market goes higher and they buy when the market goes lower. Their positions on underlying assets normally anticipate market trend, hence they should be carefully monitored
Non-Reportable : are the open position of small investors/traders that normally are on the wrong side of the market. This investors category is usually confused and not disciplined. They do not follow precise rules and are usually dragged by the trend, but they are slow to reverse positions when the market trend reverses.
The following example contains data about "futures only" market for BUTTER, coming from Chicago Mercantile Exchange.
BUTTER (CASH SETTLED) - CHICAGO MERCANTILE EXCHANGE Code-050642
FUTURES ONLY POSITIONS AS OF 03/17/20 |
----------------------------------------------------------------------------------| NON-REPORTABLE
NON-COMMERCIAL | COMMERCIAL | TOTAL | POSITIONS
--------------------------------|---------------------|--------------------------|-----------------
LONG | SHORT |SPREADS | LONG | SHORT | LONG | SHORT | LONG | SHORT
--------------------------------------------------------------------------------
(CONTRACTS OF 20,000 POUNDS) OPEN INTEREST: 11,597
COMMITMENTS
0 2,473 453 10,401 8,149 10,854 11,075 743 522
CHANGES FROM 03/10/20 (CHANGE IN OPEN INTEREST: 753)
0 -127 101 675 796 776 770 -23 -17
PERCENT OF OPEN INTEREST FOR EACH CATEGORY OF TRADERS
0.0 21.3 3.9 89.7 70.3 93.6 95.5 6.4 4.5
NUMBER OF TRADERS IN EACH CATEGORY (TOTAL TRADERS: 47)
0 12 10 28 22 38 34
It is possible to see as in the report is provided the total amount of LONG and SHORT positions for Non-Commercial, Commercial and Non-Reportable actors. Variations from previous week are moreover reported.
In addiction to LONG and SHORT positions, Legacy report contains also the SPREAD amount, that is available for Non-Commercial only, and refers to contracts that are opened LONG and SHORT at the same time. Normally a growing SPREAD value means a high level of uncertainty.
If we calculate NET POSITIONS (NP) for the 3 actors categories, as it's easy to check, the report show a zero-sum scenario:
NP Non-Comm = 0 – 2,473 = - 2,473
NP Comm = 10,401 – 8,149 = 2,252
NP Non-Rept = 743 – 522 = 221
NP Non-Comm + NP Comm + NP Non-Rept = -2,473 + 2,252 + 221 = 0
OPEN INTEREST value is the grand total resulting as the sum of LONG, SHORT and SPREAD positions:
Open Interest = 0 + 453 + 10,401 + 743 = 11,597
Supplemental report
Even the Supplemental report (called also Commodity Index Traders - CIT) shows data in the same manner of Legacy report, but the market actors are 3: Non-Commercial, Commercial and Index Traders.
Non-Commercial and Commercial actors are the same, while Index Traders category has appeared for the first time in January 2007. Before that date, investors that are now reported in this category were scattered in the two existing categories (Non-Commercial and mostly in the Commercial). The creation of Index Traders category has had the purpose to separate that category from Commercials, because Index Traders are not involved in the buy/sell cycle of underlying assets, and are usually managed funds, institutional investors or swap dealers. Index traders are normally interested in passive and longstanding LONG positions, while are not interested in the short-term price fluctuations. It's not unusual that this category start buying when price is falling and technical analysis says that the price falling will be even more deep. Index Traders are hence a counter-part of speculators, who have usually a contrarian habit.
Supplemental report is provided for 13 commodities:
• WHEAT-SRW - CHICAGO BOARD OF TRADE
• WHEAT-HRW - CHICAGO BOARD OF TRADE
• CORN - CHICAGO BOARD OF TRADE
• SOYBEANS - CHICAGO BOARD OF TRADE
• SOYBEAN OIL - CHICAGO BOARD OF TRADE
• SOYBEAN MEAL - CHICAGO BOARD OF TRADE
• COTTON NO. 2 - ICE FUTURES U.S.
• LEAN HOGS - CHICAGO MERCANTILE EXCHANGE
• LIVE CATTLE - CHICAGO MERCANTILE EXCHANGE
• FEEDER CATTLE - CHICAGO MERCANTILE EXCHANGE
• COCOA - ICE FUTURES U.S.
• SUGAR NO. 11 - ICE FUTURES U.S.
• COFFEE C - ICE FUTURES U.S.
Disaggregated report
Market actors of Disaggregated report are:
Producer/Merchant/Processor/User : they are involved in production, handling, packaging or transport of physical assets that is underlying to the future instrument or option. These actors use futures to cover/hedge risks associated to the activities they are involved in that are strictly related to the production of the assets
Swap Dealers : they are subjects that are involved in trading swap contracts related to the commodity and uses futures market to cover/hedge risks associated with swap transactions. The counterpart of a Swap dealer could be a speculative traders, as well as an hedge fund, or a more traditional Commercial subject that is interested in managing risks associated with the commerce activities of the asset
Money manager : to this category belong Commodity Trading Advisor (CTA), Commodity Pool Operator (CPO) or an unregistered fund identified by the CFTC. These subjects are delegated from their clients to do financial operations in their behalf
Other Reportable : all speculative traders that are not belonging in the three previous category are included in this category
Even in this case, the report shows LONG, SHORT and SPREAD positions.
Comparing this kind of report with Legacy, we can see that:
COMMERCIAL = PRODUCER/MERCHANT/PROCESSOR/USER + SWAP DEALERS
NON-COMMERCIAL = MONEY MANAGER + OTHER REPORTABLE
This explains why the report is called "disaggregated". It shows the same data but with a more level of detail especially regarding the actors that hold open positions.
If we take the Disaggregated report about BUTTER for the "futures only" market coming from Chicago Mercantile Exchange (equivalent to the previous example that is showed under the Legacy report section, we see:
:------------------------------------------------------------------------------------------------------------------------------------------------------ :
: Producer/Merchant : : : :
: Processor/User : Swap Dealers : Managed Money : Other Reportables :
: Long : Short : Long : Short : Spreading : Long : Short : Spreading : Long : Short : Spreading :
--------------------------------------------------------------------------------------------------------------------------------------------------------
BUTTER (CASH SETTLED) - CHICAGO MERCANTILE EXCHANGE (CONTRACTS OF 20,000 POUNDS) :
CFTC Code #050642 Open Interest is 11,597 :
: Positions :
: 8,893 6,326 1,048 1,363 460 0 301 180 0 2,172 273 :
: :
: Changes from: March 10, 2020 :
: 244 648 324 41 107 0 -12 -8 0 -115 109 :
: :
: Percent of Open Interest Represented by Each Category of Trader :
: 76.7 54.5 9.0 11.8 4.0 0.0 2.6 1.6 0.0 18.7 2.4 :
: :
: Number of Traders in Each Category Total Traders: 47 :
: 24 18 . . 4 0 . . 0 10 9 :
---------------------------------------------------------------------------------------------------------------------------------------------------------
If we take the categories Producer/Merchant/Processor/User and Swap Dealers and we sum all LONG positions and then subtract all SHORT positions, we obtain an overall NET positions like this:
NP = (8,893 +1,048 + 0 + 0) - (6,326 + 1,363) = 2,252
Now, if we do the same calculation for Commercial category of the correspondent Legacy report (see above) we obtain:
NP = 10,401 - 8,149 = 2,252
This is the confirmation that Disaggregated report contains the split of data reported in the Legacy report, where Commercial category is divided in Producer/Merchant/Processor/User and Swap Dealers. Same calculation would demonstrate that Non-Commercial category in the Legacy report is spitted here in Managed Money and Other Reportable categories.
If we now consider the Disaggregated report and we sum all LONG positions and then we subtract all SHORT positions for each actors category, we obtain:
(8,893 + 1,048 + 0 + 0) – (6,326 + 1,363 + 301 + 2,172) = 9941 - 10162 = -221
Given that the grand total should represent a zero-sum scenario, e can deduce from Disaggregated report that net position of Non-Reportable subjects should be +221, hence a net LONG of 221 contracts, and that is correct, in fact it is possible to obtain the same result from correspondent Legacy report (see above) by subtracting net SHORT position for Non-Reportable actors to the amount of net LONG positions for the same actors. Hence Disaggregated report allow us to calculato also net position of Non-Reportable, even if the data do not explicitly report the value.
Traders in financial futures report
This report is a further view on the market and split market actors in two sides (SELL and BUY) and 4 categories:
SELL SIDE
Dealer/Intermediary : are financial intermediaries who earn by the commissions related to the sell of financial products. Big banks and other financial entities are involved in this activities
BUY SIDE
Asset Manager/Institutional : they are insitutional investors, including pension funds, insurance companies and investment portfolio managers whose clients are mainly institutional entities
Leveraged funds : these are typically speculative funds (hedge funds) and various types of money managers, including the Commodity Trading Advisors (CTA) and the Commodity Pool Operators (CPO) not necessarily registered by CFTC. These subjects can be involved in hedging strategies and arbitrages on their own capital, or even third parties capital
Other reportable : these are all the traders that are not included in previous categories
Differently from Disaggregated report, the TFF report the positions of the mentioned actors categories are not an exact disaggregation of Commercial and Non-Commercial positions reported in the Legacy report. Here each actor belonging to one of the categories mentioned above could belong to the Commercial or the Non-Commercial category in the Legacy report, basing on the decision that CFTC takes during the report creation, that can be different time after time (i.e.: a subject that has already been considered a Commercial one in the beginning, can be shifted to Non-Commercial after a while, depending on the specific activities he is involved during the time, that can change as well). The TFF report is moreover available only in the LONG format
REPORT ANALYSIS
If we properly analyze data in the Commitment of Traders legacy report, we can determine the expectations of each market actor category regarding the market future.
The possibility to know the net positions of Commercial subjects (institutional investors) is the basis to understand the market sentiment. Their influence is, in fact, between 50% and 75% of the entire futures market of S&P500 and from 40% and 60% of Nasdaq100.
It is useful to point out that Commercial subjects, as well as the Non-Commercial, can take arbitrage or hedging positions, or, alternatively, put in place an active management of their portfolios by buying or selling futures on foreign (not US) markets, or, again, have open position on the futures' underlying assets and protect themselves from risks of price variations by taking opposite positions on the futures market. Hence the Commitment of Traders Report is an important thermometer to measure US stock exchange sentiment, but it isn't a tool that, alone, can allow us to predict how financial markets will move. It should be used (as usual) together with other indicators, tools, analysis and perspectives to have a better understanding of what is happening and a good approximation of what is going to happen (most likely).
Commercial subjects are active actors in the futures' underlying asset market and generally sell when the market (price) grows and buy when the price is more convenient (low), hence their activities are contrarian to the logic of speculators. For this reason the Commercial actors are often responsible of market moves and trends. They drag prices and the market with their activities, hence they anticipate and determine the market trends.
Non-Commercial subjects, viceversa, have opposite interests. They want to make money by price variations, hence they buy when the market shows growing prices and sell in the opposite conditions. This behavior is what we call "trend following" approach.
Here are some typical scenarios that we can find by analyzing the Commitment of Traders report:
1) If Non-Reportable actors (small/retail traders) are LONG and Commercial are SHORT, the Non-Reportable actors are most likely going to loose money because the price will go to to the side where Commercial are pushing it (down)
2) On the maximum levels of an asset price (i.e. near significant RESITANCE levels), Non-Reportable are likely pushed to SELL their positions. Then stop loss levels are likely hit and only after the price starts his falling stage
3) If Non-Commercial are LONG and Non-Reportable are SHORT, we are likely in the middle of an UPTREND and there is more space for the price to gro further
4) If Non-Commercial are LONG and also Non-Reportable are LONG, we are likely in the "euphoric" phase of the trend, hence the trend is going to finish soon
5) If Non-Commercial are SHORT, Non-Reportable are upgrading their SHORT positions and Comemrcial slow down their LONG positions, e re likely in the terminal phase of a downtrend
If we accept the hypothesis that Commercial traders hold better information on the market than the others just because they are active actors of the futures' underlying assets (it's their own business!), it is very important to monitor their behaviour in order to understand how they are evaluating the situation related to the specific commodity that is at the center of our interest.
Commitment of Traders Index
An interesting approach to have effective insights from the Commitment of Traders report can be obtained by calculating an index using the report data. Normally Comemrcial net positions are used to calculate the index as follows:
NP (Net Position) = Long Positions – Short Positions
Usually, an interval of 26 periods (weeks) is selected and the calculation to determine the index value is:
COT Index = * 100
The index, expressed as a pecentage value from 0 to 100, reflects net position of Commercials on the basis of last 26 periods. It can be used as an indicator of overbought and oversold zones and can be a good tool to understand where investors are moving.
The index can be also calculated for Non-Commercial or Non-Reportable positions.
Last, but not least, remember that Commitment Of Traders report is released every Friday evening, but contains data up until previous Tuesday, hence a "lagging" effect should be seriously considered in all the analysis that involves it.
The content of this article has solely education purposes and should be not considered trading or investement advise.

Demark trendlines + Demark pivotsThis is more or less how Demark Trendlines work.
Connect two more recent lows (shadows) from right to left, called DM points N. Condition - each N has to have 3-6-9-12...20 candles (you decide the number)
above the low on both sides. The bigger number the more serious is the low. Usually they use like 3-10 candles on both sides.
Both lows have to have similar amount of candles.
The same applies to the downtrends - you connect 2 most recent descending highs, from right to left.
The ideal would be when the swing to the upside (before the breakdown) would be bigger (overextension, overbuying, auction final).
You measure target by the length of the inner bow and project it from breakout.
I noticed it works well with Demark Daily Pivot boxes. Breakout of R1 or S1 usually coincides with Demark trendline breakout.
Daily Demark S1 or Demark R1 hold trends on hourly incredible well (better that Ichimoku or any MA). Those are great for stops.
Breakout of daily Demark S1 or Demark R1 is the first sign of trend change.
I am still learning this so...
Support/Resistance Long StrategyChart TF: 4H
Indicators: 14 EMA, 40 EMA, Vortex Indicator 30, RSI 22, TRIX 10
I have been tweaking this simple, yet profitable, system for a few weeks and wanted to share it with the public to receive feedback/opinions.
This post will go over the long entry conditions, look at my profile for the short conditions (they are simply flipped).
Long Conditions:
1) 14 EMA > 40 EMA.
2) A bullish candle must break above a resistance level.
3) The price must be above both EMAs.
4) VI(+) > VI(-) by at least .15
5) RSI > 50
6) TRIX > 0
If all conditions are met, enter long.
Stop Loss:
1) Set SL to the closest support.
Take Profit:
1) Set TP 1:1 R/R with the stop loss.
In this recent 21 day stretch, 02/26/20 - 03/18/20, this strategy gave 6 successful long entries and over 500 pips on EURGBP.

Support/Resistance Short StrategyChart TF: 4H
Indicators: 14 EMA, 40 EMA, Vortex Indicator 30, RSI 22, TRIX 10
I have been tweaking this simple, yet profitable, system for a few weeks and wanted to share it with the public to receive feedback/opinions.
Short Entry Conditions:
1) 40 EMA > 14 EMA.
2) A bearish candle must break below a support level.
3) The price must be under both EMAs.
4) VI(-) > VI(+) by at least .15
5) RSI < 50
6) TRIX < 0
If all conditions are met, enter short.
Stop Loss:
1) Set SL to the closest resistance.
Take Profit:
1) Set TP 1:1 R/R with the stop loss.
In this recent 28 day stretch, 02/19/20 - 03/18/20, this strategy gave 5 successful short entries and over 300 pips on NZDCHF.
