Trading on the Stoch RSI StrategyNot Financial advice. For my personal education only.
This shows how someone could use the stock RSI to trade, The idea is to make a trade when the Stoch RSI moving average lines cross each other.
But as with all indicators this isn't a fool proof strategy, as high lighted in the green circles that when the market moves sideways you can potentially lose money.
Also if you only traded the crosses when the market goes past the over bought or over sold lines you could still be caught out as the point of the all time high the Stoch RSI is saying that the market is over sold and giving the signal to buy.
In my personal opinion this is a very good indicator but should not be used on its own.
Oscillators

Tom Demark Targets, Support and Resistance levels TrendlinesThis technique pans out more often than not and is easy to chart with the tradingview tools.

Considerations about "RSI Rollercoaster" trading strategy.The RSI rollercoaster in my opinion is one of the safest trading strategies, because combines a clever use of the stop-loss at points that guarantee receiving a good percentage in profit. It is particularly good when you do middle term trading, and you have regular jobs which impede being in front of the charts regularly.
Nevertheless there is one situation about the RSI rollercoaster that I do not no how to handle:
Lets suppose that you take a long position on any symbol, using the criteria of identifying the upward crossing of the K line with 20.
You go long at 10000, considering a stop loss at the pivot point (9500), and selling half of your position at 10000+50% of your risk.
Possible outcome 1 : first target of 10000+50% of risk is not met, and the value of the share starts going down. In this case the stop loss will protect your position making you going short again, in case the trend continues being bearish.
Possible outcome 2 : first target of 10000+50% of risk is met, and the share continues going up, in this case you liquidate half of you position at targe and increase the level of your stop loss to breakeven. Then go short after the RSI has a downward crossing with the 80 level.
Possible outcome 3 : First target is meet, wich means that you sell half of your position, but then the share goes down up to the break-even point. At this stage, you liquidate all of your shares, but in a market that you expect to be bullish.
The question is, in a situation like outcome 3, How to enter again to the market? , how to define the strategy to enter back again?
I will just keep studying to try to identify patterns, but all comments are welcome.

Complex indicators. Should we use them or not?Hi guys!
I've decided to continue exploring various instruments. Today we'll talk about Stochastic oscillator. But before we start, I have an important message for you. Using indicators with their default settings will not yield good results. I try to tell you not only about basis but about different specificities of each instrument. That will make your technical analysis more diverse.
Stochastic consists of %K and %D lines. It also has percentage scale and oversold/overbought zones (If you are interested in detailed the calculation, you can fund the information on the net).
Buy signals:
1) When %K line goes out from the oversold zone.
2) When %K line crosses %D line upward (this signal also gives many false signals and I don't recommend you to follow it).
3) Various divergences and convergences of indicator and price.
Correct indicator setting is very important. Depending on the time frame that is comfortable for you to work, use next settings:
1) time frame less than 1h: (5,3,3)
2) time frame from 1h to 1d: (10-20,3,3)
3) time frame 1w: (21,7,7)
And remember: the main specificity of Stochastic is that it gives many false signals when the market is in trend. In the next article, I will prepare information about filtration methods of false signals of this indicator.
Comment if you are interested in such information. Thank you for likes and followings!

RSI Indicator - Technical Analysis Summary using ETCBTC D ChartGeneral RSI Indicators applied to the ETCBTC D chart (where present). This helped me in taking in the lesson below from Crypto Cred.
I hope others find it useful.
Source Used: Thanks Crypto Cred!!
www.youtube.com
www.babypips.com

day trading BTC: managing the dip and return cycleBoth dipping and recovering price cycles represent good buy-ion points for BTC day trades. There are a multitude of good buy ins given the above indicators and bollinger band overlay (200 day SMA).
When price is falling, the lower standard deviation of the bollinger bands are helpful in establishing buy in points. When price is collapsing initially after a high, this is the scariest buy in. However, you can see how EMA 34 and SMA 50 are both far below SMA 200, and exhibiting room for collapse.
Once a significant BB low takes place, scraping the lower BB for the last time, there is an opportunity to buy in, with expectation of a set of improving buy-sell cycles. There will be several before the final, parabolic jump of the day, justifying your attendance in the market.
I see several very healthy gains, buying these hits along the lower bollinger band, which may surpass the parabolic gain, taking place in the final jump.
My contribution is the cup-like trend, traveling the lower range of the bollinger distribution, scraping lower standard deviation points. But the recovering price-pump at the right (4.4%+) is signed by rising prices versus the lower bollinger band, and a combination EMA 34 and MA 50 surging closer to SMA 200.
This document is for information and illustrative purposes only. It is not, and should not be regarded as “investment advice” or as a “recommendation” regarding a course of action, including without limitation as those terms are used in any applicable law or regulation

Example of the Relative Strength Index Indicator on BCHUSDThe relative strength index (RSI) is a momentum indicator. It is primary used to attempt to identify overbought and oversold conditions. It is considered overbought when the RSI indictor is above 70 and it is a sign to make a short, and oversold when is below 30 and it is a sign to make a long.

Another way to use "Divergence" to spot Fakeout from Breakout -is to find out if the momentum is getting stronger or weaker, if the chart make a higher high and the indicator made lower high so it refer to; the momentum is decreasing, in order to spot the (breakout from fakeout)
-in this example we have a rectangle consolidation, you can see the first breakout was a fake out, here we'll use divergence to spot this fake out take a look at the indicator is making higher low while the price get back to same low this indicate the momentum is decreasing, the bears are already exhausted and the price get back to rectangle pattern.
-But the next one was a real breakout look at the indicator is making lower low just like the price, also if you look what just happened next the price soar up to reach the support line of the rectangle pattern which is turned to resistance, the bears gathers more steam to push the price down
-Hopefully this was helpful and another tool to put it in your arsenal facing the market wish y'all a green week, Peace.

Usage of an enhanced RSI indicator to spot turnsThe following chart shows the enhanced RSI indicator in with the settings of the current dominant market cycle. The cyclic-smoothed (cRSI) indicator is able to indicate price turns analog to indicator turns above/below the cyclic lower/upper much clearer than the basic RSI.
The indicator is available for usage in TradingView:

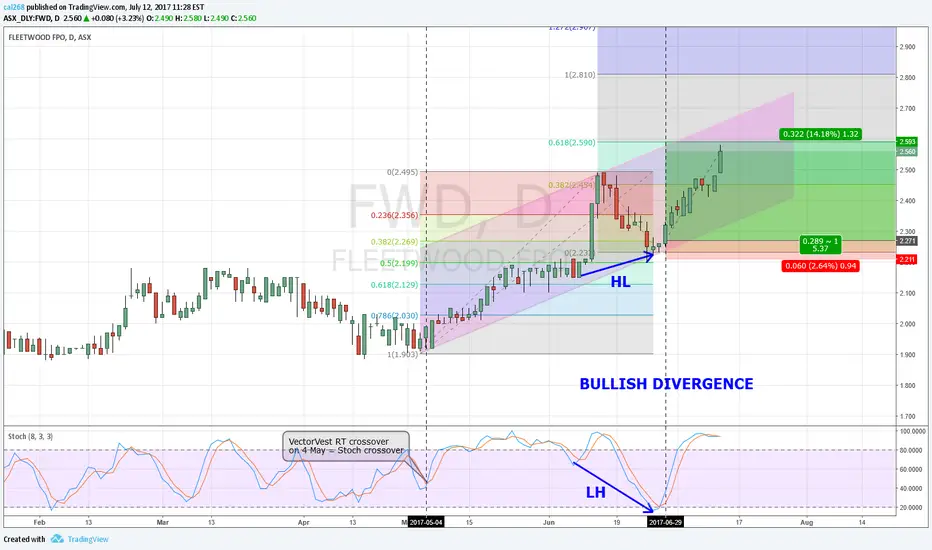
Trend Base Analysis & DivergenceToday, I show this example for you to understand why bullish divergence is important for an entry order.
FWD.AX is selected because VectorVest indicator RT crossover occurred on 4 May which is the same day that Stochastic (8,3,3) crossover occurred
Value of RT changed from 0.97 (3 May) to 1.03 (4 May)
Value of RT yesterday was 1.53
If you hold this stock since the crossovers occurred on 4 May, you gain 30% return so far.
For beginners, you may also try the second entry on 29 July. Why? It is simply because of the bullish divergence. And also, the price actions struggled at the Fib Ret. 38.2% as well.
Your homework is to analyse JIN.AX, using the same strategies above and the markups on the graph. Show me why JIN.AX gained 10% in one day on 11 July.
Creative use of RSIDue to the nature of an oscillating indicator such as an RSI vs lagging idicators such as MACD, the breakout of the RSI Linechart may indicate a range breakout and volatility expansion before price action.

Super Easy MACD & Stochastics Trading TechniqueI am fairly new to this but have been testing out this technique with stochastics and MACD and it works well for me.
Once stoch goes bullish from oversold, wait for MACD to cross and confirm a bullish trend is emerging and buy.
When we have reached a peak and it's time to sell - stoch will cross to bearish from overbought followed by MACD.
This works well with any time frame and trading pair!
Happy trading and if my technique helped you profit - feel free to donate some BTC: 17CmGuFs55TVFSC3BZbWoYkVHLMm5ko5Yg

Trading Applications: How To Use Oscillators Correctly! You need to read the tutorial first before this post. Here is the tutorial :
This is an example of how to apply the concepts I explained in the oscillators tutorials.
I have numbered the text boxes so that you read them in the correct sequence. Start from the left hand side and move along the chart. In this example we have applied some basic concepts like support and resistance and candlestick patterns as an additional tools to the oscillators. It is always important to use more tools to support your view (but not too many).
Also it's always important to put things in context of the the price action. Whether it is trending up or down or sideways. In addition, remember to look at the bigger picture, as an uptrend on the daily chart , might be merely an upwave in a sideways market on the weekly or monthly chart.
Best
Technician

Trading Fundamentals: How To Use Oscillators Correctly!Note: A prerequisite tutorial about trends is posted in the related links below.
Oscillators can be a very useful indicators in trading if used correctly. However misusing them will only return disappointing results.
Some of the most popular examples of oscillators are the stochastics, and relative strength index . I will use stochastic in this tutorial, but the same logic applies to most other oscillators.
Definitions:
What are oscillators:
Oscillators are indicators that derive their value from the price . The price is an input for the oscillator formula. The formula is usually a simple calculation that compares the latest close value for the price to a the range of price over a specific period of time( u can change this period in the oscillators settings). Then give the result in a percentage format(0 to 100). The main purpose of this calculation is to show whether the price is overbought or oversold compared to that period range. For example: if stochastic reading is at 80% or above, its said to be overbought. And if at 20% below it is oversold.
Divergence:
When the price is making new highs and the oscillator fails to make a new high, this is called a bearish divergence. The opposite is true, when the price is making new lows and the oscillator fails to make new lows this is called a bullish divergence. Bullish divergence is a buy signal and bearish divergence is sell signal.
If you follow the overbought and oversold signals and divergences as a sell and buy signals without taking in consideration the price trend, the results will be catastrophic. ill explain why shortly
How to use oscillators to maximize your chances:
1) In TRENDING MARKETS
Rule #1: Oversold signals in uptrending market is a reliable buy signal.
Overbought signals in downtrending market is reliable sell signal.
Look at the chart, start from the left, you can see that the price broke above the latest swing high for the prior down trend, And that signalled a potential reversal. Accordingly, a trader should had looked to buy new oversold signals on stochastic. Afterwards, every time the stoch. was oversold in this uptrending market, we witnessed a rebound and resumption of the uptrend.
Same logic should be applied to downtrending market.
Rule #2: Overbought doesn't mean sell if occurs in an uptrend, and oversold doesn't mean buy if in downtrend.
Rule #3 : Bearish divergence doesn't mean sell if occurs in an uptrend, and bullish divergence doesn't mean buy if occurs in a downtrend.
This might be counter intuitive, but the chart above gives a clear example:
As you can see on the chart, when the market is up-trending, overbought, and bearish divergences signals are very common due to the fact that there is a strong demand. Therefore these signals are NOT RELIABLE and should be ignored. UNLESS there are other major multiple technical indications of reversal such as a major resistance level, and a bearish candlestick formation, or trend structure break. Same logic goes for down-trending market, where you should ignore oversold signals and bullish divergences.
At the end of the chart, another example of a bearish breakout below the uptrend structure. That was an early signal of a new downtrend. After that breakout, traders should look to sell new OB signals on stochastic.
2) In SIDEWAYS MARKETS
Overbought and oversold are reliable on a sideways market. Have a look at the image below
If you spot a side-ways market, look to buy oversold signals and sell overbought signals. As the price tends to reverse direction near the top and bottom of the range. If the range is broken, you should exit your trade and stop applying the the logic of sideways market. instead look to apply the logic of the trending market explained above.
Hope this will help you trade better
Best
Tech

(EDUCATIONAL) Hidden DivergenceHello Traders:
we have a Hidden Divergence ( + ) in EURUSD
Hidden Divergence says that in this position the prize will Rise
Let's see that it is working or NOT
Good Luck
:::PEACE:::

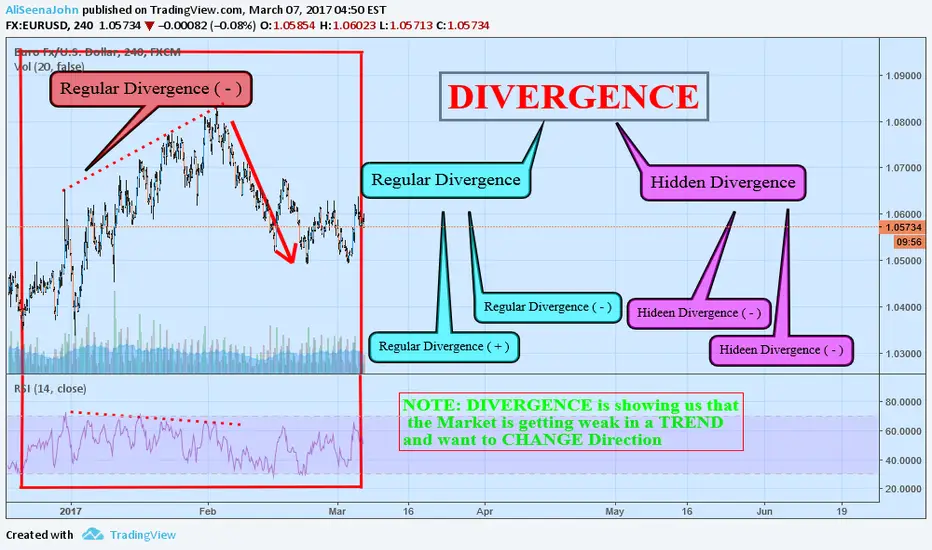
(EDUCATIONAL) DivergenceHello Trader:
Although Divergence is same in MACD and RSI or any OSCILLATOR like this, shows Divergence.
if this Chart is EDUCATIONAL then:
If you wanna Learn more about Divergence then follow me to LEARN MORE...
and please like for other TRADERS to give them the chance that the could also see this CHART and they learn too, something less from Market Behavior
GOOD LUCK
:::PEACE:::
(Education) EURJPY - How to trade this RSI Bamm on EURJPY?Hey guys, this is an update to the EURJPY setup I posted last week.
We are right there at the bottom of the triangle.
What is interesting to me is the formation of an RSI bamm at Friday's closing price.
Pattern Identification
RSI Bamm at bottom of triangle.
RSI Bamm is the formation of a W/M structure at RSI oversold/overbought where this is considered a prelude to a potential end of trend.
A W/M structure, followed by a retracement to the 50% level of the RSI indicator and a final retest at oversold/overbought will be considered a potential buy/sell opportunity.
Trade Execution
Next week, I will watch out for a move up out of the RSI oversold zone for EURJPY to initiate a buy.
SL will be below the low of Friday.
I am aiming at 119.50 for TP where the higher boundary of the triangle is at.
If EURJPY continues lower on Monday, this trade trade will be invalid and we will look for other opportunities to trade this pair.

Using Multiple Timeframes to Enter a TradeHello Traders!
As many of you know, I use the Stoch RSI as my main cycle indicator. As an indicator of an indicator, it normalizes the RSI indicator itself and provides excellent guidance on the price cycles of Gold. And while I base my daily analysis on the Daily time frame, I use 2 shorter time frames to enter my positions. These time frames are 30 minutes and 60 minutes.
Let me give you a real life example from yesterday of how I added to an existing short position.
Last week ended with a beautiful down candle on the daily chart. Long upper wick and a full body that closed just a few points above the bottom of our wedge. With plenty of room left on the Stoch RSI before it crossed the 20 line, I wanted to add another position to my existing short. But I new that I didn't want to jump in at Friday's closing price. So how could I gauge any potential pullback and set an entry price?
The first thing I did was to look at the 30 and 60 min charts, specifically to find where price was on those charts in relation to the overall down cycle.
Here is the 30 min chart on Sunday night at 11 pm PST. It's clear from the Stoch RSI that price was at the bottom of it's cycle. Not an ideal time to enter a trade. And the same was true on the 60 min chart (bottom chart). Therefore, I wanted the Stoch RSI to cycle up to get the best possible entry price. Looking at the BB, I placed a limit order at the inner BB (1.0 Std. Dev) @ 1321, thinking that would give both Stoch RSIs enough time to complete an up cycle. Turns out that was pretty close to the high of the day!
I have had the best entries when I wait for the cycle indicators across multiple time frames to get in sync. Waiting for harmony across multiple time frames is a great way to create a repeatable system for entries and really helps to remove emotions from your trading.
I would love to hear if this technique is helpful!
Safe Trading and Protect Your Profits!

AUDNZD: An example of a high probability trade #forex #audA simple trade using a harmonic three drive and RSI. Entry for the trade has already gone. But it could be useful to point to the setups and conditions around it, because it provide a great example of combining high probability technicals to initiate a trade.
The price provided a great shorting opportunity after completing a three drives pattern around 1.0770 level. A long upper wick was formed at that level confirming a high chance reversal. Meantime, RSI Divergence supported the short scenario.
Also, If you take a look at the daily chart, you will see a clear rejection and long upper wicks candles for the past two days.
All my ideas are just my personal view. Trade Your own view.
I have no incentive to post if i don't get enough support from you. Likes and comment.
You can SKYPE me at : Technician - The Forex Channel
My Regards,
Technican


RSI Is Your Friend - What Non-Price Analysis Can Tell You #ForexFriends,
Let me just start by making this statement, which has caused more reaction than I have ever cared, but it simply is true:
1 - RSI's bearish divergences do NOT foretell an impending decline in price. Instead, they are associated with sustained rise in price.
Conversely:
2 - RSI's bullish divergences do NOT foretell an impending rise in price. Instead, they are associated with a sustained decline in price.
Yes, I know. You have been told, taught and even paid for statements that come in direct contradiction to this, but let me tell you right now: Put your gun down, Google Positive Divergence in RSI (not Bullish Divergence) for instance, and you would be more apt to find a RSI signal associated with a consistent premonition in terms of signal than any of that bearish/bullish divergence.
I have given multiple lessons to private individuals or public audiences demonstrating that before any reversal, there are multiple bearish/bullish divergences, and that the reversal only comes true after a sustained numbers of the said divergences.
In contrast, a Positive/Negative Divergence in RSI only comes in a great while, and is typically associated with a deeper retracement, if not a reversal.
I continue to be dismayed that even professional traders keep on pointing at bearish/bullish divergences. I have to explain here that the trader is NOT completely wrong to point these out, but remember that these divergences are associated with a contrarian trend (i.e.: bullish with decline and bearish with rising prices for the most part).
As a predictive analyst/forecaster, and having worked, decorticated and peeled RSI studies for many years (I started in 1997, the year I entered medical school), I soon learned that RSI is and continues to be erroneously taught.
Another feature of my trading is that I do NOT trade off of price. As many of you might have heard from me: "Price is the dangling carrot at the end of the stick held by institutional hands". The institutional traders know every stop-losses, every positions and can decide to move a M5, M15, H1 or even a H4 chart against a widely held position of retail traders, wide the screen clean of these SLs and yet not impart much changes at the daily/weekly levels at which they trade for their liquid providers/banking clients. So, keep that in mind as well.
So, best is to use certain indicators. I use the RSI-14 set at HLC/3. Here is an old method I used to decide on entries:
Take a look at the bottom of the chart. See a trend? Do you also realize that all the lines are perfect parralels to one another (there are one steep and one soft-sloped). See how they keep on failing while price remains (recently) in a downward trend?
Now, of late, RSI is approaching its upper steep-TL boundary. Do you see the association with the price's own TL?
My point here is to use an indicator in the most discreet and alternative way. After so many years of doing research on RSi (lots of backtesting in several RSI values, and across many TF and markets), RSI can definitely be one of your best trading buddy.
By the way, the author of RSI himself has a few residual students who are now teaching. These students are teaching the first rule I mentioned above, so this is not something I made up, but something that comes right from the RSI author himself - Question is: Why do institutional trading firms continue to erroneously teach RSI and offer you to open an account there? Is this a misleading attempt, or simply a developing case of the blind leading the clueless?
Cheers,
David Alcindor
Predictive Analysis & Forecasting
