Looking for Hull 10/McGinley 10 Crossovers!DISCLAIMER: Trading Forex involves risk and you may lose more money than you started with! These posts are not to be taken as trade recommendations or financial advice and I offer NO guarantee that any of these ideas will result in profit. Also, trade ideas may change, depending on ever-changing market conditions. You are trading at your own risk and past performance is NOT indicative of future results. Please, know how much you are willing to risk on EVERY trade that you take and be SMART!
Simplify your trading. Always measure your risk and be okay with being wrong ; ) Wait patiently and get the price that you want. Use the market. Don't let the market use you.
Volume


EURJPY High Probability Demand ZoneEURJPY High Probability Demand Zone. Volume is high in that zone suggesting institutional orders.


XRPUSDT 29 JULY (how to recognise traps)For a more detailed/professional explanation websearch Wyckoff Spring/upthrust.
In general these trap moves are going to present as a break outside of the trading range boundary with a quick reaction back into that range.
Make note of the volume that accommodates this move... The greater the better.
Not always indicative of a reversal, but should serve as a warning that price may not continue in that specific direction.
This is exactly why you want to avoid chasing as price nears the trading range boundary.
In an uptrend you are looking for entry's nearing or below support (below median)
In a downtrend you are looking for entry's nearing or above resistance (above median)
What you also want to do is:
Avoid buying into weakness/resistance/supply
Avoid selling into strength/support/demand
Avoid entry in the middle of the TR

Trendlines, Volume and FibonacciTrendlines are the simplest chart pattern you can find, but they are some of the most widely used, and for good reason.
They highlight a price trend going up, down, or sideways. Which therefore will be used for further analysis and other chart patterns, but what many people don't know are the specifics of trendlines. Firstly, widely-touched trendlines (about a month apart) perform much better than closely-touched trendlines. Trendlines with more touches also perform better than those with fewer. Furthermore, the longer the trendline the better the performance. However, steeper trendlines don't cut - performance usually lacks when trendlines get steeper.
The Gold monthly chart shows a downward channel highlighted by blue trendlines. This channel isn't the best since the breakout doesn't kick in for a couple of years, however, it would have been great for a few swing trades.
Highlighted by the blue notes are regions of high volume at valleys and peaks. Heavy volume at peaks and volumes are good indicators of support and resistance. Represented by the white horizontal lines. However, one important thing to note is that horizontal consolidation regions provide better support and resistance then peaks and valleys.
The HCR is presented by the yellow note and the highest blue note in the chart.
Also shown is the Fibonacci retracement. The Fibonacci retracements of 38%,50%, and 62% are good regions for support and resistance. A stop placement at 67% protects trades 66% of the time.

GBPUSD "avoid selling into support" exampleIt keeps me aware of my location on the chart at all times and save me a lot of frustration. There are circumstances where you can get away with breaking this criteria however, it comes with increased risk and one should know how to adjust the capital they are using appropriately based on the risk.
Here is an example of price/volume reaction at support. If you were tempted to enter short, price would now be moving against you and you are at the mercy of the market. It might play out short yes, but more times than not, this WILL work against you. All that does is cause you to stare at the screen hoping things go your way. That is a very un-enjoyable and stressful situation to be in. I think in Wyckoff technique its called "phase B"... Phase B being the portion of the trading range where supply/demand balances/imbalances get worked out and you do not want to be in the way of that process.
But what will save you and/or at least give you time to react to a poor entry with minimum loss is to:
Avoid selling directly into support/strength/demand
Avoid buying into resistance/weakness/supply
Avoid entering positions in the center of a trading range
There is a lot more to it. There are a wide range of techniques to experiment with/employ. But no matter the technique one principle must alway be considered:
SM buys low
SM sells high

EURUSD multi time frame Bollinger band to identify weaknessUsing the multi-time frame bollinger bands here. Set to 1 hour.
Focus your attention to the activity that takes place outside of the bands. Look at the volume. What is SM doing here... PREPARING for a markdown.
SM and skilled traders are always thinking 2-3 moves ahead. If criteria is not met, we ignore it and wait for a favorable set-up.
Avoid trading in the middle of a range. That can be RSI, Bollinger bands, support/resistance.
The true action is always at the edges.
Practice*

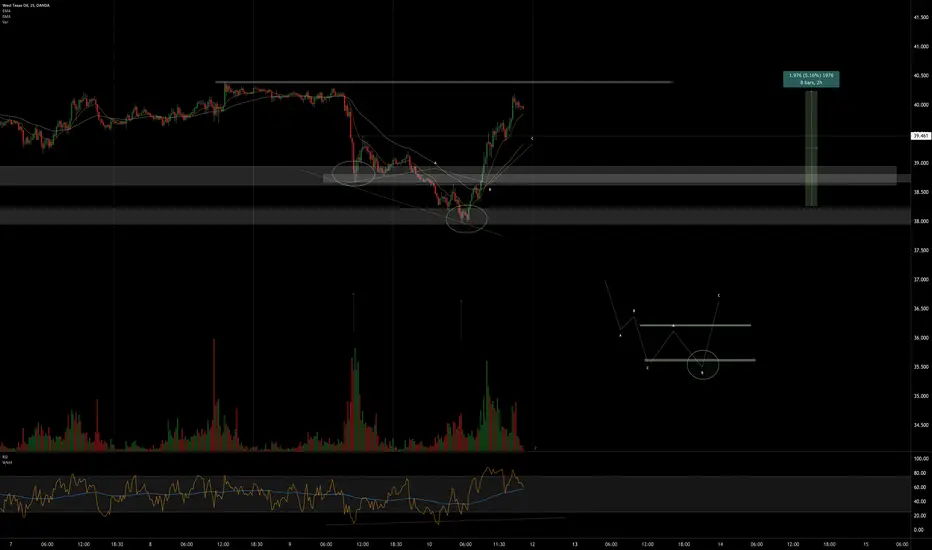
WTICOUSD re-accumulation example 15 min with POS RSI DIVCloser look at the anatomy of that recent mark-up.
Confluence of factors:
Uptrend
strength in the background/evidence of accumulation
RSI oversold
RSI positive Divergence on volume into a key supporrt
You can see the demand to the left. SM stopped buying, allowing price to drift/shaking out remaining weak hands.
Spring below support on slight iincrease in volume
"no-supply" signal near spring
"push-through" entry seen at resistance .
PM with questions.

GBPUSD 08 JULY 2020 1400 hrs -identifying DIV in a channel ref.RSI as an adjunct.
Preferred to look for accumulation below the median of RSI (50 level) and distribution above the median line. Volume is always primary. I am finding RSI set at 7 with oversold at 75 and overbought at 25 to be extremely useful in setting alerts into my preferred target areas.
If RSI alert is triggered in the target area, further analysis must be conducted to properly identify where you are in the market cycle.
If you do not know where you are located within the market cycle chances that the trade works against you elevates.
Training/Practice**

Re-accumulation example (ref.)Areas to look for re-accumulation:
Below support
50-61.8% fib
Previous resistance turned support
Chosen EMA (14/50 here/Fader technique).
RSI is useful for setting alerts. RSI here is at 7. Oversold at 75/overbought at 25.
Also useful for a last conformation (although not needed). You may also get a divergence below the creek on the 5 or 15 once price intersects with the other factors listed above.
Ideally, you get in on the test and take it to your profit target. Take profit and wait for this to repeat itself. If you think you just so happened to buy right before its going to skyrocket like never before, think again.
Always have a profit taking plan in your trading*
Holding is for investors and people who don't know what they are doing.
PM for TA questions.
Training*
Sources of education:
Richard Wyckoff
Tom Williams Volume spread analysis VSA/ Master the Markets
Pete Faders VSA*
Read the ticker dot com
Wyckoff analytics
Dee Nixon

Accumulation into demand line (positioning reference) Example of why its better to avoid selling at support or into a demand line (if using channels).
Isolated example of active buying, prepping, for a counter trend position. SM will buy until the sell pressure is low enough for them to mark the price up with as little in their path as possible. Refer to Tom Williams Master the Markets for a thorough and very easy to understand explanation.
Its useful to have a grasp of basic supply/demand dynamics. When there is more supply than demand price goes down and when there is more demand than siupply price goes up. Volume analysis vastly improves ones ability to recognize imbalances of the two.
Training*

EURUSD identifying dist. with RSI/15 min (ref.)RSI @ 7
oversold @ 75
Overbought @ 25
VWMA @ 100
Avoid selling into support (strength)
Avoid buying into resistance (weakness)

HEXUSD ... TA and accuracyhere is an example of slop.
Where is support or resistance?
Where are the buyers? where are the sellers?
Do you think your technical analysis is going to be accurate in an environment like this?
Definitely will need a lot more time to develop.
Training/practice*

ETHUSD Stopping volume (more examples/ reference)SOS off of or IVO support. Very high volume that stops continuation of the down move. It's ideal to do what institutions are doing. Are they buying or selling?
In crypto 5-10% wins on repeat is how you succeed. Buying and holding is just going to be higher risk. Anything can happen.
Imagine if you made 5-10% gains 3-5 times a week. Would you be in a better financial position?
Training/practice*

Accumulation or Distribution ?Understanding there is no additional contextual data and just using the information that is available, which out of the two trading ranges is which?
Which pattern is indicative of accumulation?
Which pattern is indicative of distribution?
Hint: Look at the volume activity at support and resistance. Where are the higher concentrations of supply or demand?
Training/practice**

BTC - EUR volume side by side comparisonJust to convey the difference in volume between BTC and EUR.
Note the uniformity of EURUSD volume and how it correlates with teh day to day session/schedule. It almost looks like trading is a 9-5 job....hmmmm
Now note the volume for BTC on a day to day basis.... Which is more predictable?
If you are looking to be an actual day trader, stop worrying about what it is you are trading. When you do a side to side comparison, which side do you think is going to earn you the most gains (assuming you even know what you are doing)?
Learn volume.

Quiz: Which 5 wave here is potentially more bullish? Using volume, which wave count is potentially going to have a more bullish A or B? Why?

BTCUSD 4 hour RSI signalling RSI sensitivity at 7
Instead of 70/30, levels are set at 80/20.
Using RSI as an adjunct/signal tool. Note the volume anytime RSI breaks the 20 level. You can set an alert at 20/30. Whenever price breaks this level you will be alerted and there may be a potential long situation setting up.
RSI can convey divergences between price and volume.
Also can be used as a final confirmation. for example, you are about to enter long but notice RSI hovering around the 50 level: Middle of range, not ideal.
Takes patience but there are opportunities off of the 20 RSI if you understand volume.
practice*

Volume Profile Possibly the most important indicator you'll useFind value in finding the most traded SP without having to keep changing your input, simply click the visible range volume profile Zoom out as far as you can go and start adding support lines as explained.
Then zoom into a time significant to you i.e the last year or 2 and see if those support lines are still relevant!
I make no apologizes for the poor audio recording or the thick accent.
Any positive comments or support and I'll invest in a better microphone

How to use the new Anchored VWAP drawing toolThis chart shows the Nasdaq-100 ETF QQQ as a weekly chart going back several years. It shows price, volume , and the newest addition to all TradingView charts... Anchored VWAP. It's been added as a drawing tool and getting started is easy:
1. Select Anchored VWAP from the drawing tools list on the chart’s left-side panel.
2. Now select a point on the chart from which you would like to start your calculation.
3. Click that point and the VWAP line will instantly calculate and appear on your chart.
4. In addition, you can change the color and thickness of the Anchored VWAP line by double-clicking on it and adjusting its colors and style in Settings.
Anchored VWAP displays the volume-weighted average price for a specific time period, starting from a user-selected point. In other words, Anchored VWAP shows the price of an asset adjusted for its volume starting from any point chosen on the chart. This is a powerful tool because it takes into account the number of shares traded at each price level and presents it as a smooth line anchored to any moment in time.
We’re excited to help the trading and investing community by adding Anchored VWAP to all TradingView charts. Also, if you missed it, we’ve recently improved the original VWAP indicator and now you can choose the interval to calculate. This gives traders the ability to construct any VWAP line based on a time interval of their choosing.
Please leave any comments or questions you may have in the comments below. If you're an expert at using Anchored VWAP , please share some tips and strategies so that new traders and investors can learn from you. Thanks for reading!

Using the Volume Flow Indicator (VFI) to trade like a proOne of the hardest things to do when you're new to trading, and even when you've been in it for a while, is to figure out when to buy and when to sell to maximize profit. I'm sure there have been many times when you've sold too early, or bought in too early, and vice versa. What a waste!
Now I'd be lying if I told you there is any sure way to tell the best time to buy/sell, but indicators can definitely help, especially when you're not very experienced. One of my new favourites is the the Volume Flow Indicator (VFI) by LazyBear. I'm not going to explain to you what it is or how it works; you can read that at the link provided at the bottom of this post.
But I'll show you an example of how I used it based on the author's suggestion. According to the author, typically a reading above the zero line puts you in bullish territory, and one below the zero line in bearish territory. But as you can see, it might be a bit late if you wait for that. So what you can do instead is look at divergence on the VFI as an indicator of trend reversal. Divergence is basically a higher low near the bottom (yellow lines shown above), or a lower high near the top (blue lines shown above).
As you can see, it's a pretty good indicator of trend reversal. I'll be using it a lot more going forward. One thing to note is that I'm using a 4 hour chart here. You may get better results on a daily chart, or 1 hour chart, depending on the coin/stock in question, so do experiment a bit on a per coin/stock basis to see what back-tests the best in that particular case. Another tip from the author is to use a Coefficient of 0.2 for day trading, and 0.1 for intraday trading, which you can change by clicking the gear/settings icon on the VFI toolbar (I'm using 0.2 here).
If you think this tutorial is absolutely amazing, and will help you be the best trader you can be, please smash the like button and give me a follow, because I'll be writing a lot more of these, and you'll be notified if you follow me.
Do you agree or disagree with me? Do you have any feedback? Let me know in the comments.
Disclaimer
No Investment Advice Provided
Any opinions, chats, messages, news, research, analyses, prices, or other information contained in this Post/Idea or in connection with it are provided as general market information for educational and entertainment purposes only, and do not constitute investment advice. This Post/Idea should not be relied upon as a substitute for extensive independent market research before making your actual trading decisions. Opinions, market data, recommendations or any other content is subject to change at any time without notice. I will not accept liability for any loss or damage, including without limitation any loss of profit, which may arise directly or indirectly from use of or reliance on such information.
I do not recommend the use of technical analysis as a sole means of trading decisions. I do not recommend making hurried trading decisions. You should always understand that PAST PERFORMANCE IS NOT NECESSARILY INDICATIVE OF FUTURE RESULTS.
