Indicator introduction: Custom Volume - Periodic Peaks & TroughsThis script is a custom volume indicator with additional features.
But why is this useful?
The minimum and maximum volumes, in different time periods, are displayed by labels below the bars. I call them "Peaks" and "Troughs"(Hover your mouse cursor over the labels to see more details)
These parameters are widely used in technical analysis .
If traders want to confirm a reversal on a level of support–or floor–they look for high buying volume . Conversely, if traders are looking to confirm a break in the level of support, they look for low volume from buyers.
If traders want to confirm a reversal on a level of resistance–or ceiling– they look for high selling volume . Conversely, if traders are looking to confirm a break in the level of resistance, they look for high volume from buyers.
How to use alerts
Note that by creating an alert, an instance of the indicator, with all your settings, will be activated on the site's server and alerts will be triggered by it.
After that, changing the indicator settings on the chart will no longer affect the alert.
Open the settings window and select the alert conditions as you wish
Click the Create Alert button (or press the A key while holding down the ALT key)
In the Condition section, select the name of the indicator.
Make the rest of the settings as you wish.
Finally, click on the Create button.
It's finished. After a few moments, your alert will be added to the Alerts menu.
Volume

How to use "Volume Records + Alert" IndicatorThis indicator is a "volume analysis" tool for confirming the direction and strength of price trend and spotting trend reversals.
What Is Volume Analysis?
Volume analysis involves examining relative or absolute changes in an asset's trading volume in order to make inferences about future price movements.
A significant price increase along with a significant volume increase, for example, could be a credible sign of a continued bullish trend or a bullish reversal.
The gradual darkening of the bars is a sign of the strength of the trend.
Volume can be an indicator of market strength, as rising markets on increasing volume are typically viewed as strong and healthy.
How to use alerts
Note that by creating an alert, an instance of the indicator, with all your settings, will be activated on the site's server and alerts will be triggered by it.
After that, changing the indicator settings on the chart will no longer affect the alert.
Open the settings window and select the alert conditions as you wish
Click the Create Alert button (or press the A key while holding down the ALT key)
In the Condition section, select the name of the indicator.
Make the rest of the settings as you wish.
Finally, click on the Create button.
It's finished. After a few moments, your alert will be added to the Alerts menu.

Significant Candles (Find Them)This is where and when big banks and institutions, during large significant candles. They give you a lot of valuable information- that will help you in your trading. Per chart: yellow lines are high psychological price actions where large candles either range, with large bodies or price reacts when it hits them.
I personally do not day trade outside of the times of Tokyo end to London end (12 hours), which is highest daily liquidity and volume times of Forex- other times scalp for 12.5 to 25 pips related to low liquidity and volume. Also, Monday and Fridays have lower liquidity and volume then Tuesday thru Thursday, so might do more scalping or short trades.
Significant Candles happen:
During The Right Pair
During The Right Session
At The Right Price
At The Right Time
+ Large Ranging candles, With Large bodies and Price reacts to candle once it reaches it.

REASONS not to trade 1st hour of sessionIf you are either a scalper trader and/or a day trading, the 1st hour of new session is never a place to trade: Here are some reasons:
1) Low Liquidity
2) Low Volume
3) Very High spread widening ( can be 15 to 20 pips) from broker
4) Very Large hourly candlesticks (example: 88 pip large clearing doji candlestick) happens for broker to take both buyer and seller positions out.
Note: 1st hour of session is during Sydney session, then afterwards Tokyo session starts. Increasing liquidity and volume starts end of Tokyo.
Part of your plan should be:
Pairs to trade
When to trade
What setups to trade
Trading edge & Strategy
Do not be greedy especially during the financial craziness going on in most countries around the world, just get a piece of PIP PIE in a trade if you are either a scalper or day trading. Use risk management and commonsense- this is no place to gamble with your money- use probabilities of success of setups.

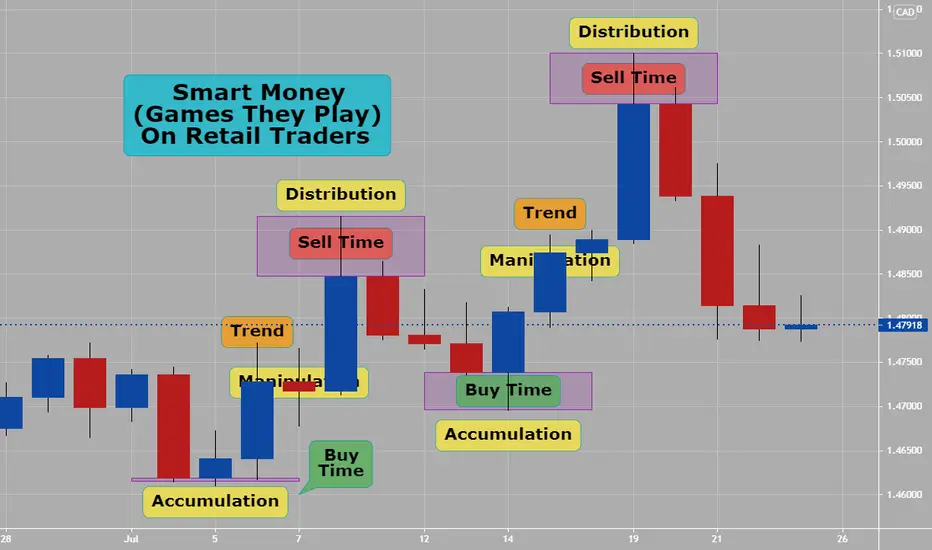
Smart Money- (Accumulation-Manipulation-Distribution)This is applicable to any time frames but example attached chart is daily.
You could be able to do this on any charts and will keep you trading with big banks or smart money.
Please practice this on charts- retail traders should never fight big banks but get on the trade ride with them.
On charts you need to be able to see and block in the following areas look like:
Accumulation (Buying) looks like in bull and bear conditions
Manipulation (Trend) looks like in bull and bear conditions
Distribution (Selling) looks like in bull and bear conditions.
Trading Forex is half trading edge, plan, risk management and other 1/2 is knowing what smart money is doing and how to trade to exploit it and win.
Indicators For A Volume Profile Based Trading StrategyVolume Profile has been popular among futures traders since the beginning of electronic trading and the introduction of TPO charts. I use several scripts from the TradingView Volume Profile Suite for a trading strategy I'll teach in a upcoming video. For now, here are the scripts and indicators applied to the charts I show in this, and past, recordings.
Indicators on the 30m Chart:
Volume Profile > Session Volume HD
PriorDayOHLC (Available in the Public Library)
233 EMA (Built-ins)
Indicators on the 5m Chart
Volume Profile > Visible Range
VWAP Stdev Bands v@ Mod (Available in the Public Library)

General Rules in Volume AnalysisThe market is bullish if a new high occurs with heavy volume. A new high on light volume is deemed temporary.
A new low price with high volume is a bearish indicator. A new low on light volume is less significant.
A rally to a new price high on expanding volume but with less activity than the previous rally is questionable. It may point to a coming reversal in trend.
A rally on contracting volume is questionable. It warns of a possible price reversal.
If prices advance after a long decline and then go to a level at or above the previous trough, the indicator is bullish when volume on the secondary trough is less than the first.
If the market has been increasing for a while, an anemic price increase coupled with high volume is a bearish sign. After a decline, substantial volume with minor price changes points to accumulation, typically a bullish indicator.
Volume Price Interpretation
Increasing Rising Bullish
Decreasing Falling Bullish
Increasing Falling Bearish
Decreasing Rising Bearish

What is Head and Shoulders Pattern?Introducing series topics of trading systems we gonna do on Tradingview and hope readers can learn something from our educational content. Three main systems are the followings:
1)Pattern recognition
2)Trending following
3)Counter trend
Start with pattern recognition, and we will mainly cover two main categories of price patterns: Major Reversal patterns and continuation patterns.
Then introduce today’s educational content: H&S pattern , which is probably the most reliable and best known of all major reversal patterns. Most of the other reversal patterns are just variations of H&S.
Volume Factor: H&S Pattern is relatively easy to recognize but many people ignore the importance of volume: The head should take place on lighter volume than the left shoulder which indicates a diminishing buying power. And volume should also expand on the breaking of the neckline to confirm the pattern.
Price Target: :Also the price target is not guaranteed to be the height of pattern, height may only be a minimum target. Also when we take other factors into consideration such as pivot support area, we need to adjust our price target rather than brainlessly using the height of the pattern as price projection.
Coming back to the topic Bitcoin chart as of today. Bitcoin is also forming the same pattern on a larger time frame.
What do you think, will Bitcoin hold the neckline and rebounce above the right shoulder to form a new bullish trend or will Bitcoin break the neckline with volume confirmed to aim for the next pivot support (also the previous breakout level) around 20,000?
Follow us for more education content on Technical Analysis.
Next Topic Preview: The Inverse H&S pattern

Indicator introduction: Auto Trendline & Breakout AlertNote: This indicator will be published soon
In short, this indicator is a tool designed for different purposes:
1) Automatic drawing of trend lines
2) Classification of trend lines based on the reaction of price chart and trading volume
3) Receiving trend lines breakout alerts
4) Analyzing smaller time frames is time consuming and tedious, but this tool makes it easy. The following figure shows 5-m time frame chart, you can see the panel of the latest breakouts on it (You can enable the panel in the settings menu):
How it works?
Trend lines are classified into 6 levels, of which only 3 are enabled by default.
Level 01 (Red Lines) is the strongest level. Therefore, the breakout of these lines is the most important signal of this indicator.
Volume verification helps you avoid fake Breakouts.
As you can see, both the labels and the table show the status of the trading volume when the lines breakout.
Trading volume is classified into 5 levels:
Over volume (confirmed ✅)
High volume (confirmed ✅)
Neutral
Low volume (potential fake breakout ⚠)
Minor volume (potential fake breakout ⚠)
This indicator can be used on both logarithmic and linear charts. (Scale in the settings menu can be changed from linear to logarithmic)
Finally, this indicator includes a trend line breakout alert and you can be notified wherever you are. you can add alerts to different charts and enter the market in the best conditions.
If you like it, please leave a comment.

What Is Price Action Trading?What is Price Action Trading?
The “Price Action” method of trading refers to the practice of buying and selling securities based on the fluctuations, or “action,” of their prices; typically the data of these price changes is represented in easily-readable candlestick or bar charts, which are the bread and butter of the price action trader.
Traditionally, price action traders rely on a “naked” chart – they reject the inclusion of indicators with the conviction that, since all supplemental indicators are necessarily lagging interpretations of the basic data available on the price chart, the action of price is itself the most reliable and accurate indicator.
The patterns of price movements reveal in real time the balance between the supply for sale and the buying demand of any given security or currency pair. Any price change implies a shift in the relationship between buyers and sellers; an increase in supply will push price down, whereas an increase in buying demand will send price higher.
The price action trader bases their trades on predictions of whether buying demand is greater than the supply of sellers – and therefore price is poised to head higher – or vice versa. In the Forex market, this means that a trader will endeavor to buy (or “go long on”) a currency pair when the base currency, the one quoted first, is likely to appreciate against the counter currency, the one listed second; conversely, they will sell (or “go short on”) a currency pair wherein they expect the counter currency to appreciate relative to the base currency.
In order to make these predictions, price action traders interpret the confluence of many factors, particularly trends, candlestick patterns, and price levels known as “support and resistance.” The risk management practices are essential to profitable trading.

The volume based approach that beats holding ETH with +940% Beating Ethereum's stellar +815% gains over a year is no easy feat. Add limiting drawdown to the task and it becomes even more complicated - especially vs USDT. However with longer term strategies like this it really becomes apparent how you should simply think about the best time to buy and sell, and try to express it though market metrics, rather than trying to plague your strategy with complexity.
It's really startling this simple strategy returned 940% in one year on spot!
WILL POST EVERY POSITION BELOW (including open/close time/SL level + how every position was closed)
The strategy goals:
- Beat holding Ethereum - so more than 815% profit
- Simple to execute and stay disciplined on
- Max drawdown of 30% - we don't want to be dipping as far as the market is
The strategy:
This strategy tries to strike a balance between catching solid dips and riding reversals based on volume. Volume precedes price. It does not have to be some extremely sophisticated trading system, especially when trading a trending asset as Ethereum. If market participants start buying rapidly, Ethereum will spike. If they start selling it will go down. The key is to use metrics that help you pin this, simple as that. So in our case on the 1 hour chart:
1. We will open a position when Crypto Total Volume is up by 4% in last day AND Price is below SMA(5)
2. We will close the position when Crypto Total Volume is down by 4% in last day AND Price is up by 3% in last 3 days
We will set a stop loss at 20% of market price, no take profit. All the rules are followed 100% of the time.
The result:
This strategy accumulated +940% over a year on spot. So If you started with 10,000 USDT you'd be sitting on 94,000 USDT without touching leverage. It's also so simple to execute that you can set all these rules as alerts and just act when you need to or automate it.
It's also great that although it's a lower time frame strategy it's still created only 63 positions. It wins 77.8% of them with a bit over 8%. When it loses it's at about 11% on average. Positions are usually opened and closed within 3 days.
The drawdown amounts to about 25% over the year - a solid performance for crypto. It performed well even in the past 3 months bringing in +74.4%.
The positions:
26/06/2021 00:00
28/06/2021 08:00
2 days
OP 1,809
CP 2,049
SL 1,447.2
+13.3%
22/06/2021 13:00
24/06/2021 17:00
2 days
OP 1,792.1
CP 2,011.4
SL 1,433.7
+12.2%
21/06/2021 00:00
22/06/2021 13:00
2 days
OP 2,243.5
CP 1,794.8
SL 1,794.8
-20%
Stop Loss
08/06/2021 00:00
16/06/2021 00:00
8 days
OP 2,592
CP 2,543.6
SL 2,073.6
-1.87%
01/06/2021 02:00
07/06/2021 06:00
6 days
OP 2,662.1
CP 2,786.1
SL 2,129.7
+4.66%
29/05/2021 00:00
31/05/2021 12:00
3 days
OP 2,412.3
CP 2,551.8
SL 1,929.9
+5.78%
24/05/2021 05:00
26/05/2021 00:00
2 days
OP 2,104.1
CP 2,705.1
SL 1,683.3
+28.6%
20/05/2021 00:00
23/05/2021 01:00
3 days
OP 2,438.9
CP 2,362
SL 1,951.1
-3.15%
13/05/2021 00:00
19/05/2021 04:00
6 days
OP 3,810.2
CP 3,048.1
SL 3,048.1
-20%
Stop Loss
10/05/2021 10:00
12/05/2021 00:00
2 days
OP 4,104.8
CP 4,173.5
SL 3,283.8
+1.67%
04/05/2021 01:00
08/05/2021 00:00
4 days
OP 3,260.7
CP 3,479.8
SL 2,608.6
+6.72%
01/05/2021 09:00
02/05/2021 00:00
15 hours
OP 2,830.1
CP 2,944.8
SL 2,264
+4.06%
29/04/2021 01:00
30/04/2021 00:00
23 hours
OP 2,724.9
CP 2,757
SL 2,179.9
+1.18%
27/04/2021 04:00
28/04/2021 00:00
20 hours
OP 2,493.2
CP 2,666.1
SL 1,994.5
+6.94%
23/04/2021 00:00
26/04/2021 04:00
3 days
OP 2,397.9
CP 2,454.9
SL 1,918.4
+2.38%
17/04/2021 00:00
22/04/2021 00:00
5 days
OP 2,422.4
CP 2,357.1
SL 1,937.9
-2.7%
13/04/2021 00:00
16/04/2021 00:00
3 days
OP 2,137.9
CP 2,514
SL 1,710.3
+17.6%
11/04/2021 05:00
12/04/2021 00:00
19 hours
OP 2,130.4
CP 2,151.4
SL 1,704.3
+0.987%
06/04/2021 00:00
10/04/2021 05:00
4 days
OP 2,107.4
CP 2,191.2
SL 1,685.9
+3.97%
01/04/2021 04:00
05/04/2021 00:00
4 days
OP 1,923
CP 2,075.7
SL 1,538.4
+7.94%
24/03/2021 00:00
28/03/2021 00:00
4 days
OP 1,668.2
CP 1,712.5
SL 1,334.6
+2.66%
16/03/2021 01:00
20/03/2021 03:00
4 days
OP 1,731.3
CP 1,828.4
S 1,385
+5.61%
08/03/2021 04:00
15/03/2021 01:00
7 days
OP 1,723.7
CP 1,871.6
SL 1,379
+8.58%
04/03/2021 00:00
06/03/2021 22:00
3 days
OP 1,567.7
CP 1,642.9
SL 1,254.1
+4.8%
23/02/2021 10:00
02/03/2021 00:00
7 days
OP 1,500.5
CP 1,570
SL 1,200.4
+4.63%
16/02/2021 00:00
23/02/2021 10:00
7 days
OP 1,779.3
CP 1,423.5
SL 1,423.5
-20%
Stop Loss
08/02/2021 01:00
12/02/2021 00:00
4 days
OP 1,596.5
CP 1,785.8
SL 1,277.2
+11.9%
05/02/2021 00:00
06/02/2021 00:00
1 day
OP 1,595.5
CP 1,719
SL 1,276.4
+7.74%
28/01/2021 00:00
31/01/2021 00:00
3 days
OP 1,238.9
CP 1,378
SL 991.14
+11.2%
21/01/2021 23:00
24/01/2021 09:00
2 days
OP 1,135.6
CP 1,325
SL 908.46
+16.7%
20/01/2021 00:00
21/01/2021 23:00
2 days
OP 1,365.4
CP 1,092.3
SL 1,092.3
-20%
Stop Loss
16/01/2021 03:00
18/01/2021 15:00
3 days
OP 1,163.5
CP 1,237
SL 930.82
+6.32%
11/01/2021 15:00
14/01/2021 07:00
3 days
OP 1,038.5
CP 1,121.2
SL 830.82
+7.96%
11/01/2021 00:00
11/01/2021 15:00
15 hours
OP 1,254.2
CP 1,003.4
SL 1,003.4
-20%
Stop Loss
08/01/2021 00:00
10/01/2021 00:00
2 days
OP 1,224.9
CP 1,276
SL 979.89
+4.18%
03/01/2021 04:00
05/01/2021 00:00
2 days
OP 772.44
CP 1,041.4
SL 617.95
+34.8%
23/12/2020 02:00
31/12/2020 00:00
8 days
OP 627.26
CP 752.17
SL 501.81
+19.9%
16/12/2020 00:00
19/12/2020 00:00
3 days
OP 588.78
CP 653.76
SL 471.02
+11%
09/12/2020 00:00
13/12/2020 10:00
4 days
OP 554.92
CP 583.47
SL 443.94
+5.14%
05/12/2020 00:00
08/12/2020 00:00
3 days
OP 567.24
CP 591.27
SL 453.79
+4.24%
01/12/2020 01:00
03/12/2020 00:00
2 days
OP 605.57
CP 596.88
SL 484.46
-1.44%
27/11/2020 03:00
29/11/2020 08:00
2 days
OP 517.12
CP 541.33
SL 413.7
+4.68%
21/11/2020 03:00
26/11/2020 01:00
5 days
OP 508.15
CP 575.39
SL 406.52
+13.2%
12/11/2020 00:00
20/11/2020 02:00
8 days
OP 463.09
CP 479.4
SL 370.47
+3.52%
10/11/2020 00:00
11/11/2020 00:00
1 day
OP 444.32
CP 450.34
SL 355.46
+1.35%
05/11/2020 01:00
09/11/2020 00:00
4 days
OP 401.57
CP 454.29
SL 321.26
+13.1%
03/11/2020 00:00
04/11/2020 17:00
2 days
OP 383.01
CP 401.2
SL 306.41
+4.75%
27/10/2020 03:00
01/11/2020 23:00
6 days
OP 392.34
CP 395.3
SL 313.87
+0.754%
20/10/2020 01:00
23/10/2020 00:00
3 days
OP 378.74
CP 413.94
SL 302.99
+9.29%
13/10/2020 00:00
14/10/2020 01:00
1 day
OP 386.51
CP 384.53
SL 309.21
-0.512%
06/10/2020 01:00
12/10/2020 00:00
6 days
OP 352.38
CP 374.17
SL 281.9
+6.18%
02/10/2020 01:00
05/10/2020 09:00
3 days
OP 351.06
CP 350.22
SL 280.85
-0.239%
22/09/2020 00:00
26/09/2020 05:00
4 days
OP 340.31
CP 351.98
SL 272.25
+3.43%
14/09/2020 01:00
19/09/2020 00:00
5 days
OP 358.05
CP 384.4
SL 286.44
+7.36%
11/09/2020 02:00
12/09/2020 00:00
22 hours
OP 365.53
CP 373.62
SL 292.42
+2.21%
18/08/2020 00:00
24/08/2020 22:00
7 days
OP 430.89
CP 406.74
SL 344.71
-5.6%
14/08/2020 03:00
15/08/2020 00:00
21 hours
OP 422.13
CP 438.12
SL 337.7
+3.79%
08/08/2020 04:00
13/08/2020 21:00
6 days
OP 378.01
CP 409.8
SL 302.41
+8.41%
02/08/2020 05:00
04/08/2020 00:00
2 days
OP 372.37
CP 385.91
SL 297.9
+3.64%
28/07/2020 00:00
29/07/2020 00:00
1 day
OP 321.95
CP 316.77
SL 257.56
-1.61%
24/07/2020 01:00
27/07/2020 00:00
3 days
OP 273.92
CP 311.02
SL 219.14
+13.5%
02/07/2020 00:00
23/07/2020 00:00
21 days
OP 230.99
CP 263.75
SL 184.79
+14.2%
30/06/2020 01:00
01/07/2020 00:00
23 hours
OP 227.62
CP 225.59
SL 182.1
-0.892%

Volume Profiles on TradingViewIf you are new to @TradingView
Or a new trader, there is a pretty useful feature called volume profiles - available with paid membership of Tradingview. This is a quick introduction to and not a full lesson on how to use, strategies or techniques (will post one if there is interest for that).
TradingView's own definition of Volume profile
Volume Profile is an advanced charting study that displays trading activity over a specified time period at specified price levels. The study (accounting for user defined parameters such as number of rows and time period) plots a histogram on the chart meant to reveal dominant and/or significant price levels based on volume. Essentially, Volume Profile takes the total volume traded at a specific price level during the specified time period and divides the total volume into either buy volume or sell volume and then makes that information easily visible to the trader.
Source - www.tradingview.com
Types of volume profiles available
First there is session volume
As it says on the tin - session volume calculates the volume of transactions during the session, boxed off individually on a session by session basis.
Inside the session volume;-
Second type of volume profile is "Visible range" - again not much of an explanation needed, however - this one is a little more tricky as a lot of novice traders spend a lot of time flipping between charts, time frames and so on. So you need to be careful as it will compute, whatever you have in view on the chart.
Here we can see the value area, just like the session - but for the visible range.
I have also highlighted the region outside of the value zone - grey area in orange boxes. (for this example) and of course the point of control.
By zooming out to another swing high you can see how this changed the profile.
This is due to the fact we are now viewing on the chart a different range - A bigger swing with more info inside the calculation.
The third type of volume profile on TradingView is the fixed range;
In simple terms - this kind of works between the two; you can highlight what you want, but it is then anchored much like the session volume.
In this example above, I have shown the fixed range to match a visible range - larger left and the profile larger on the right. As well as a smaller fixed range showing the original smaller range form the visible range image 1.
Mix and match - or different use cases;
There are several different ways to apply volume, the use case, the logic & the strategy will depend on what one or what combo works best for you. As I mentioned above, I will do a lesson on strategies for volume if requested.
In this example below; I have shown a fixed range and a session profile.
And finally - just to reiterate, there are several techniques when trading volume, at a glance here you will see a cluset of "PoC's" consolidating at a high before the price moves on down over several sessions.
This is just one application.
As always, I hope this helps some newer traders out there get into volume profile, It can be a powerful tool when you know how to use it.
Disclaimer
This idea does not constitute as financial advice. It is for educational purposes only, our principle trader has over 20 years’ experience in stocks, ETF’s, and Forex. Hence each trade setup might have different hold times, entry or exit conditions, and will vary from the post/idea shared here. You can use the information from this post to make your own trading plan for the instrument discussed. Trading carries a risk; a high percentage of retail traders lose money. Please keep this in mind when entering any trade. Stay safe.

Interesting observation with the Volume Profile...DISCLAIMER: Trading Forex/Cryptocurrency involves risk and you may lose more money than you started with! These posts are not to be taken as financial advice and I offer NO guarantee that any of these ideas will result in profit. Also, trade ideas may change, depending on ever-changing market conditions. You are trading at your own risk and past performance is NOT indicative of future results. Please, know how much you are willing to risk on EVERY trade that you take and be SMART!
Simplify your trading. Always measure your risk and be okay with being wrong ; ) Wait patiently and get the price that you want. Use the market. Don't let the market use you!

The best models of the volume profile. Deals with confidenceWhat is the Volume Profile indicator?
Volume Profile is an advanced charting study and indicator. It shows the traded volume amount of an asset over a specified period, at certain price levels. Volume Profile makes use of previous traded volume and all the strategies and plans are brought from historical data.
Traders focus on the regions where a reversal could occur with volume profile. Some people believe that volume profile analysis provides traders with an “unfair” advantage as a result of market context and that institutions and banks use such strategies.
What is Volume?
Volume, also referred to as volume of trade, gives the total number of shares or stocks traded for a specific security. Volume indicates the amount of transactions that carried out. As a result, it can also measure the liquidity of security. A security is considered active or liquid when volumes are high.
How does indicator work?
The volume profile can come in any shape depending on the distribution of volumes. It draws by using horizontal lines to form a histogram. The more the volume trades at a given level, the bigger the profile becomes.
The volume profile is usually located at the right side of the chart beside the price levels. It is represented with bars. The volume profile bars are created by getting total volume traded at a price, in a given time. The total buy is then divided, and volumes sold representing it on a histogram chart. Traders can understand and use the volume profile indicator as one of the important tools among all their technical analysis tools.
Types of Volume Profile
There are three different kinds of volume profile used in trading. There is not so much difference in the way they all operate. The differences that exist amongst them are the way they appear on the chart and the ease of access to volume profile on the precise time period you want to view.
Volume Profile Visible Range (VPVR): Volume Profile Visible Range (VPVR) is the basic volume profile tool most trader use. It appears next to price levels on histogram. It displays the volume traded in the price level automatically from the candles displayed on the screen. When one go back and forth in the price action’s time period, the volume profile visible range will change.
Volume Profile Fixed Rage (VPFR): This is almost the same volume profile with the VPVR, only with a little difference. When one wants to view the traded volume in a period of price action, like the uptrend or downtrend, you can determine the initial and final point and view the volume profile only for that time period.
Volume Profile Session Volume (VPSV): This displays all the volume profile of the session that is appearing on the chart. Each session presenting on the chart has a volume profile grouped with it. Each session is considered daily and that goes for the change of time period of the chart.
The various shapes of Volume Profile
There are various shapes volume profile histogram can print out and many details and information can be generated from them.
D – Shaped Profile: This corresponds with alphabet “D” and it is the most common shape. It informs us that there is a temporal balance in the market.
P – Shaped Profile: This corresponds with alphabet “P” and it is an indication of uptrend.
b – Shaped Profile: This corresponds with alphabet “b” and it is the inverse of P-shaped profile. B-shaped profile mostly appears in a downtrend or at the rear of an uptrend.
Thin Profile: This corresponds with the alphabet “I”. Thin profile indicates a strong trend. There is little to no time for building-up trading positions in a fierce price movement. Just minute volume clusters are made in this type of profile.
Terminologies associated with Volume Profile
It is very important that one understands has some basic knowledge about the concepts related to volume profile.
High Volume Node (HVN): This is a point in volume profile where is a really higher volume than average. The most crucial component of the volume profile is to be able to display the most traded prices for a particular time period.
Low Volume Node (LVN): This is a point in volume profile where there is a really lower volume than average. LVN and HVN are inversely proportional to each other.
Value Area (VA): This is where 70% of the volume can be found. The volume profile gets a bit complex in this area. This means that 70% of total volume used on the chart had occurred cumulatively at these price levels, hence, called Value Area.
Point of Control (POC): This is the highest volume node that exists on the volume profile. Numerous volumes are transacted here. Traders make use of POC for as a vital retest point and for support.
Clearance: This is an area in the volume profile that constitute of only LVNs, as there are no HVNs in this region.
Developing Point of Control (Developing POC): This is a change in POC over time. As POC changes over time, you can notice the change by observing the Developing POC line to what it was in time past.
Value Area High (VAH): This is the highest point in the value region section
Value Area Low (VAL): This is the lowest point in the value region section
Volume Profile rules
Traders can identify the state at which the market is by using the volume profile. When you have been able to determine the state at which a market is, then these rules tells us what to search for in volume profile in those different market conditions.
If the price is consolidating (ranging price): Here, the price would be jumping between HVNs and LVNs. Value area will be situated at the center of the volume profile.
If the price is trending upward (uptrend): Price here will likely retrace to the value area high. Value area would be situated on beneath the volume profile.
If the price is trending downward (downtrend): Price would most probably retrace to the value area low. Value area would exist above the volume profile.
Conclusion
Volume profile is a very vital valuable analysis tool which is used everywhere by traders. Volume profile has been continually relevant as a result of its versatility. It is a charting tool that has a wide usage capability.
The volume Profile provides trader with accurate data. It is more of a reactive tool for discovering traditional and resistance areas and so traders are still developing indicators which would be more proactive and predictive in nature.
With every other indicator, calculations are done with only two variable which are: Price and Time but with volume profile indicator, there are three variables available. These variables are: Price, Time, and Volume.
Most standard trading indicators only show how the price is moving in the past. The main notable difference between those numerous indicators is how they visualize it. That made them less efficient and makes traders to keeping moving from one indicator to the other.
But with volume profile, it directs you to regions which where and will be crucial for large trading institutions. To put it mildly, volume profile is capable of predicting what will happen in the future.

ETH vs. BTC - Who's the likely winner?DISCLAIMER: Trading Forex/Cryptocurrency involves risk and you may lose more money than you started with! These posts are not to be taken as financial advice and I offer NO guarantee that any of these ideas will result in profit. Also, trade ideas may change, depending on ever-changing market conditions. You are trading at your own risk and past performance is NOT indicative of future results. Please, know how much you are willing to risk on EVERY trade that you take and be SMART!
Simplify your trading. Always measure your risk and be okay with being wrong ; ) Wait patiently and get the price that you want. Use the market. Don't let the market use you!

How To Trade Forex VolumePlease look at any Forex 4 hour chart with simply volume on bottom- what do you see? Part of your trading edge should be only trading with high liquidity and volume (in-between these 12 hours a day)- then do other things to maintain balance of body, mind and soul in your life.
Yes, you see that only times you should be either scalping or day trading is in between 10 p.m. to 10 a.m. PST/USA ( 12 hours)- this is at the end of Tokyo session to end of London session. *NOTE: convert these times with your own times and/or location.
What is Forex volume: How to use it to your advantage:
If you did not know, the Forex market has an average turnover of $6 trillion daily! In other words, that is the Forex volume! Forex allows swing traders, scalping and position trading... even long term trading. You can enter markets at any time, with tight spreads and good leverage. Lets explain what is Forex volume and how to use it to your advantage...
The Forex players:
To start, interestingly, the bulk of trades are made with major currencies. And only a few global powerhouses account for most of these trades. Forex traders are separated into two categories: Institutional traders: Major banks, governments, hedge funds and portfolio managers. Retail traders: Individual traders ( like you and me) and prop traders (who work at proprietary trading firms).
Institutional trading makes up 90% of the Forex market- the smart money. Only 10% of trades are done by individual and prop shop traders (i.e. traders who trade capital for other people).
Forex volume and liquidity: The Forex market trades 24 hours a day, five day a week. Traders often confuse Forex volume and liqudity. Forex volume is the total amount of capital traded in market. Lots of trades around the clock means a massive amount of volume in the Forex market. Therefore, trades have high liquidity with steady money flows to buy and sell currency. Liquidity is the ability to move your money in and out of the market. High liquidity allows you to enter or exit your trade quickly.


How to find potential strength ; )DISCLAIMER: Trading Forex/Cryptocurrency involves risk and you may lose more money than you started with! These posts are not to be taken as financial advice and I offer NO guarantee that any of these ideas will result in profit. Also, trade ideas may change, depending on ever-changing market conditions. You are trading at your own risk and past performance is NOT indicative of future results. Please, know how much you are willing to risk on EVERY trade that you take and be SMART!
Simplify your trading. Always measure your risk and be okay with being wrong ; ) Wait patiently and get the price that you want. Use the market. Don't let the market use you!

Simple Renko Trading Explained - Pt. 1DISCLAIMER: Trading Forex/Cryptocurrency involves risk and you may lose more money than you started with! These posts are not to be taken as financial advice and I offer NO guarantee that any of these ideas will result in profit. Also, trade ideas may change, depending on ever-changing market conditions. You are trading at your own risk and past performance is NOT indicative of future results. Please, know how much you are willing to risk on EVERY trade that you take and be SMART!
Simplify your trading. Always measure your risk and be okay with being wrong ; ) Wait patiently and get the price that you want. Use the market. Don't let the market use you!

Trade: No, Maybe or Yes!!There are 6 (six) boxes of 4 hour (candlesticks) per day- best times to trade our at end of Tokyo to end of London- related to liquidity and volume.
Please look at hourly chart for more details- convert times to your location.

Money Flow Index: MFI analyses tutorial with 4H candlesticksMFI or Money Flow Index as a strategy is quite similar to RSI or Relative Strength Index. The key differentiator for MFI is the consideration of volume.
Money Flow Index oscillator:
MFI uses both price and volume to measure buying and selling pressure.
MFI oscillates between 0 to 100.
Intuitively, the volume-weighted feature makes MFI a comparatively better 'Lead' indicator than the RSI.
Most reversals can be identified and acted upon best through the Money Flow Index oscillator.
MFI above 80 indicates Overbought territory. It suggests that the underlying asset is driven by a buying pressure.
MFI below 20 indicates Oversold territory. It indicates a selling pressure.
MFI crossing over 20 gives a BUY signal.
MFI crossing down the 80 mark gives a SELL signal.
Stop loss should be used as a precautionary measure.
Trailing stop loss can be used to let the profits ride, while ensuring safety in case of trend reversals.
--------------------------------------------------------------------------------
Comments and feedback would push me to come out with better analyses. Thank you!

Sessions & Overlapping TimesVisualizing the different sessions (Sydney, Tokyo, London & New York) on a chart is easier, then just reading about them. Best times to trade are both the Tokyo/London overlap (purple area) and London/New York overlap (purple area). Price action and risk management is key to profitable FX trading.
Remember Four Things When Making Any New Trades:
1) Pair Traded
2) Price Traded
3) Session Traded
4) Time Traded
All of the above four things equal liquidity and volume when you are trading, best of both is at Tokyo end to London end session.
The chart times are PST/USA times- please convert to your local times, if you would like too.

Do You Day Trade? (Part 2/2)You need to know that during the 3rd/4 hr candle or from 10:00 pm to 2:00 am (PST/USA)- please convert to your time zone, that most of the time the L.O.D. (low of day) or H.O.D. (high of day) is made, within that 4 hr candle. If you get that right, you can profit with right risk management.
There is a high correlation that 11:00 pm to 2:00 am PST/USA that the High or Low being established for the daily session, in the majority of the cases.
Attached chart example of GBPJPY 1 hour chart of Thursday, making a H.O.D. during this 3rd/4 hour candle of session, then price action dropping 80 pips.
This is why I use Daily, 4 hour and 1 hour mostly when scalping and day trading.
Do not fight big banks, if you are scalping or day trading- just jump on their train and go with it for success.
