Data Might make 6% From Here It is not a financial advice, It is just my personal idea under the practicing my learning and apply
But hope it happened
Volume

ES Price action analysis for 30 Mar 2020 trading plan
27 Mar 2020 - last hour sell off with big spread looks threatening. Yet, it still formed a higher low and within the H1 up channel. Expect a test of the bearish last hour bar during non-RTH on Monday. A break of the up channel and 2500 should send ES to test 2400-2450.
Overall H1 structure - potential up thrust of 2550 level followed by a test (last hour bar on 27 Mar). Confirmation is via a break of 2500.
Potential intraday setup during non-RTH - look for a test of the last hour bar followed by a reversal.
Key levels - First support 2500, 2nd support 2400-2450, resistance at 2550-2600
Commitment above 2600 will violate bearish scenario.

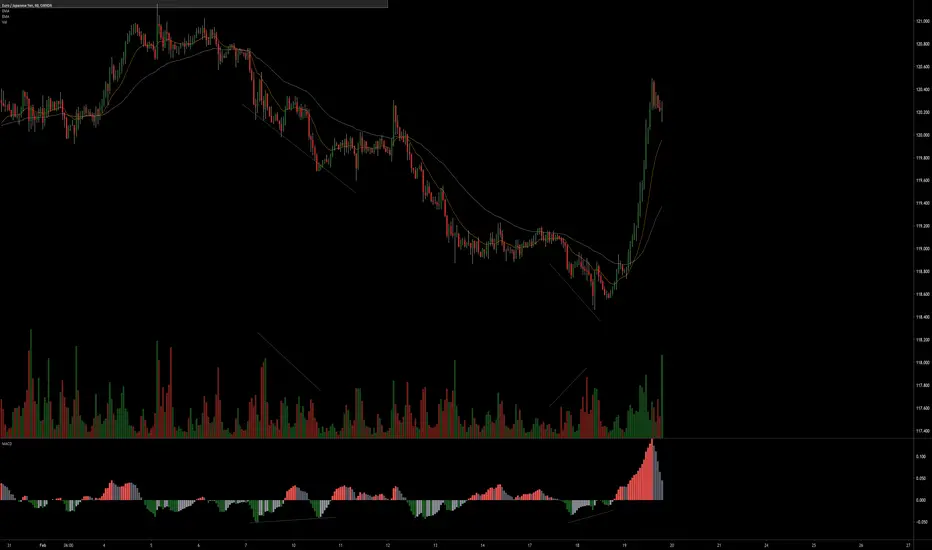
EURJPY 1 Hr MACD histogram positive divergence key ingredientIn this example there I have pointed out 2 MACD histogram positive divs.
Can you spot a key difference?
If using divergences, it is not a bad idea to utilize your volume. Notice the increase in demand, into new low ground, with the accommodating MACD positive divergence (example to the right).
Although there is a positive divergence (to the left of the chart) notice how the increase in demand is not as high. A counter trend situation did occur, but was rapidly met with enough supply to cancel the mark-up attempt (upthrust on high volume).
MACD histogram may be another useful confirmation tool. Not only for divergences, but it can also help one to identify accumulation and distribution areas above or below zero line ( for another time).
Hope this helps.
Practice*
ES Price action analysis with key levels & what to expect
25 Mar 2020 - Climatic run up with increasing volume followed by biggest down wave with highest supply. Bearish reaction with slow grinding down move during non-regular trading hour (RTH). Could it be preliminary supply?
26 Mar 2020 - Another climatic run up after shocking number of jobless claim (think this ugly number will pressure the House to approve the bill?) ES broke above 2550 with fading volume. Possible exhaustive demand?
Key levels to watch - First line of support - 2550, 2nd support- 2400, If stays above 2550, should challenge 2700.

BTCUSD 10 MAR 2020 1500 ("no-supply") ex.Example of a VSA no-supply signal.
-Strength in the background
-volume lower than the previous 2 bars
-no candles closed below the low of the NS candle
-Test of resistance
-confirmed no supply in combination with a push-through of resistance.
Practice*


USDJPY "no-supply" and "push-through AR" examples using BBRefer to VSA for more detailed explanation of "no-supply"/ "no-demand" and "push-through AR/AS".
Using Bollinger bands can be very useful for setting alerts. I like to know when price is testing any of the 3 points on the BB (lower, higher, median).
Here, the 15 minute used for targeting the above signals.
Practice*
PM me any questions on TA or refer to the listed resources below.
Sources of education:
Richard Wyckoff
Tom Williams Volume spread analysis VSA/ Master the Markets
Pete Faders VSA*
Wyckoff SMI
Read the ticker dot com
Wyckoff analytics
Dee Nixon
BTC trading challenge price action/volume techniques
Good luck

One hard truth about trading crypto: many 'clocks'Well, friends... Hello again!
After turn of day excitement and disillusionment, here a simple but important example of how key is to keep more than one exchange in check for key levels:
4.272 projection for 'wave 1', down at low 8000's, was hit on many, if not all (most relevant) crypto exchanges, except... Bitstamp. Now, not anymore.
It cost some folks the bad sensation of being trapped for who knows how long, or be point-blank stopped. Could they have avoided it? What do you think?
So, trading crypto is a bit like having many clocks. You never know which one is right at any given moment.
As such, the best you can do is, whenever you have a target, double-check it on multiple "clocks" / exchanges.
Those that I watch more frequently, here on TradingView, are:
BitMEX
Bitstamp
Bitfinex
Binance
Coinbase
HitBTC
(BTW, there was a second option to avoid this trap: as it usually happens in many trading situations, this latest rejection level is also related to 2 day TD Setup resistance line. Please check related idea for more information.)
Now, changing topics, briefly: another noticeable event, also highlighted on charts, are "off-the-book" margin operations on Bitfinex, which frequently lead to higher volatility, as exemplified. Such event preceded latest run up too.
To learn more about this topic, please check here .
So, what you think now? Price going down -- a bit a least -- or no chance, the way is up?
Cheers!
PHInkTrade

EURUSD 30 JAN 2020 2200hrsLesson learned (again)..
Don't overlook the daily and larger times frames for key S/R areas. Definitely higher priority areas of volume information. Its very important to know where you are in relation to these area. Because your mind can entice you to buy right into a key resistance or sell right into a key support, this is very dangerous .
Any time price goes against you, it would be a good idea to make a mental note of where you were )price wise) in relation to key S/R areas. Maybe even take a look at the most recent news announcement. Basically the same if you do find yourself in a good trade.
In this example, price is in very close proximity to a key daily support area. Its in a down trend.
How strong is this trend, was there any notable accumulation/positioning? Is it in an accumulation phase and if so where is it within the trading range?
I imagine anyone that went after it short near that support is now hoping the downtrend continues. But can we confirm that it will? Or will it make another fake attempt to lure chasers and trigger stop losses creating a massive amount of volume that is enough to force a mark-up?.. really killing the ones holding short, moving stop-losses higher/still hoping.
Practice*

USDJPY Trading range labeling game (28 JAN 2020)/practice*Never received any formal Wyckoff training. Have been trying to put it together so if this is not 100% accurate, bear with me... its practice.
Bing Wyckoff accumulation schematic and there you will receive a plethora of Wyckoff accumulation and distribution schematics. In my opinion, understanding what this is must be central to your trading style.
Wyckoff developed the blueprint in the 1930's and has stood the test of time. Even with the automation and the speed/access to the markets by the layperson, the principles of supply and demand have remained the same.
Sources of education:
Richard Wyckoff
Tom Williams Volume spread analysis VSA/ Master the Markets
Pete Faders VSA*
Read the ticker dot com
Wyckoff analytics
Dee Nixon
BTC trading challenge price action/volume techniques

Eurusd shortEurusd has been shorting for a very long time due to the dollar strength that has been going over the past years. I am still expecting shorts in the near future on this monthly time frame.I’m going to go ahead and set up breach points on the lower time frames to be able to see future short opportunities on this pair.

BTCUSD 23 JAN 2020 1 hour 2340 hrs .. This is likely a stretch but:
downtrend
3-4 day trading range (cycle)
8-10% move per cycle
slight demand increase to slow down progress to the down side
decreased supply pressure at 14 EMA
converging with previous resistance (creating demand thus slowing progress)..
Trying to think 2-3 times ahead. What makes sense? Where are they taking the price? Who are the winners and who are the losers? When and what are going to be events to create movement/announcements?
Practice*

OBV has not confirmed breakout.OBV is still within a range compared to price indicating further downside may be in store in the short term. However, looking at the broader picture, I believe a breakout upward is still likely by May as OBV and MACD are setting higher lows.
With that said, if OBV breaks the range resistance and the downward triangle to the upside, this would be a good long entry point in my opinion.
This is for educational purposes only. I only pretend to know what I'm talking about as this is a complex subject.

USDCAD long setup example as i was practicing =, this formation appeared. I thought there were a few things that stood out that were worthy of sharing. Always refer to Tom Willams VSA and Wyckoff for formal explanation and resource (never pay, resources are freely available)...
background was an uptrend. Objective is to find entry signals that align with the trend on the back of SM.
You should be able to clearly see a "fall through the ice" situations here. (break of support). Upon the break of support, price finds very high volume (demand) which created a violent rejection back above the broken support. Very typical VSA SOS. The spring action is circled in red. Notice again the rapid rejection right back into the TR on high volume. The spring also happened to be a 50% fib retracement (green box). This is a potential entry area.
Break-test-continuatioin pattern after the spring (2nd potential entry area) . Slight volume expansion on test (maybe called an LPS) circled in blue. The LPS converges with the 14/50 ema ad previous resistance turned support.
The trend line would have been drawn in hindsight but the 50% fib retrace could have been plotted. However, you do see the convergence after the fact.
set-up took about 2 session to begin playing out.
There are a few more variables that could be talked about here, but I am sticking to the highlights. Again, please refer to VSA and Wyckoff for more detailed training and entry techniques.
practice*
“Patience is key to success not speed. Time is a cunning speculators best friend if he uses it right”
Jesse Livermore
Sources of education:
Tom Williams Volume spread analysis VSA/ Master the Markets
Richard Wyckoff
Pete Faders VSA*
Read the ticker dot com
Dee Nixon
BTC trading challenge price action/volume techniques
Good luck

Short term bearish pattern identificationEntering a short under 8130 doesn't look ideal to me, but it already dropped before I could finish this...
The bit about lower volume on a higher high after a range break is what I look at to indicate top. It is a bluff by the 'market makers' to thin out the orderbooks and allow the price to float up without pressure, or simply shift the orders higher, to catch stops right above what was assumed to be the high.
Ranges are different on every timeframe and ideally one adjusts position size according to the size of the range and avail. portfolio to burn

The Delta of Volume ExplainedThis is the first part of a tutorial series I will develop about trading concepts I use that are not well understood. I am using BTCUSD specifically, but the general ideas apply to every tradable asset.
Volume is the amount of force applied to the market in both directions, buy and sell. It is "Ipso Facto" (by the fact itself) that force moves objects, with the object here being price. So, the amount of Buy Volume pushes the price up, Sell Volume pushes it down. But these orders are being executed every second of every day. What happens if 100btc is bought and sold on the same tick? The two forces neutralize each other.
Delta is the "Net Force" being applied to the market. The buying minus the selling. Delta doesn't tell us anything about how thick the order book is. Thus it does not tell us anything about the speed of movement of the price (in fact ignore order book thickness for now). However, The question delta answers is: "Who is DOING what?"
Who = Market Participants
What = Buying or Selling
We know institutions are profitable because otherwise, they would be out of business. We also know they move the most volume. Since they are generally profitable and have the largest volume footprint, we can assume they're betting on the correct future direction of the market and their activity will be visible in the volume. So, what if we just watched what they are doing? That's essentially the delta, the net of all the whales' buying and selling. There are many complicated strategies they will deploy that involve both buying and selling in different ways at different times (using futures and spot, meaning futures and spot are both independently important).
Watching the delta is to pay attention to its direction and rate of change. By doing this we can see what is happening in the and then when there's a strong current, you jump into it like Dude Crush from Nemo into the EAC, the East Australia Current.... duuuuude.
I have found that market orders are, in fact, responsible for price movement. That is to say, I have yet to see a period where the price is dropping and delta is not also dropping. It MAY be positive still, but it drops lower. So, that implies that Delta indicates the current direction and provides information that can predict future direction. (Also, it seems to me that, futures drive direction more than spot at this time)
Feel free to ask any questions about this you have. Thanks for reading.

My favorite Volume Profile setup EXPLAINEDMy favorite Volume Profile setup EXPLAINED on recent trade on EUR/USD

MesattoTrend v1 and v2New indicator everyone, info on the screenshot
Have a great week, happy profiting.
Indcator 1
Indicator 2

Strong support, what's next?Here is current bitcoin's bias on short term. we can see that the down trend channel is holding true and current price is moving just slightly above the lower line of the channel. Not just touching it, it has touched the strong psychological support which is around $8000 region. we might see a dead cat bounce from this area and challenging the previous broken support that is now become resistance around $8500 region.
On lower time frame, I haven't seen any sign of bullish pressure yet. the price keep moving sideway around $8050 - $8200 region which is not significant and not worth to enter long position for now. We must once again consider the higher time frame as a wider horoscope of potential direction of the price in the near future. The wide range of support could still be in play with a possible huge wick to the down side before it starts the bulls rally in short term. we must to be very reactive and very cautious at this levels, considering the wick fish is becoming the natural behavior a past movement.
I am still waiting for potential dead cat bounce, but I don't think that this is the right time to enter long position.

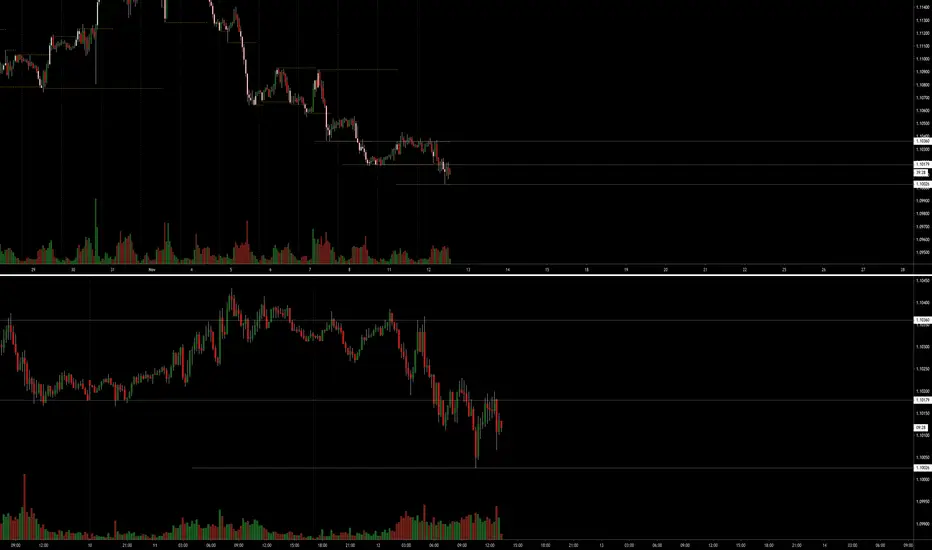
Lazy bear RSI S/R plotting tip In this example the 1 hour is above and 15 min below.
On the 1 hour chart the RSI support and resistance plotting tool is activated. The numeric settings are out of the box. The only change here is the color of the S/R lies and candle illumination.
Once the indicator is activated i chose support and resistance levels that were closer to being in play and superimposed horizontal rays on the selected areas.
You would leave those in place and the drop down to your smaller time frame where you will now have kep support or resistance price level marked. Now you can analyze the volume activity off of these levels based on the higher time frame.
Useful for volume analysis/supply and demand methods. (VSA, Wyckoff, Faders).
The Lazy bear S/R suite contains different variations based on various oscillators and volume. Basically it paints overbought and oversold regions directly on your chart. I cant find any formal instruction on this suite and have been trying to make sense of it on my own. Please add to this if you are more schooled in this are and if you have any questions please ask.
Good Luck!
“Patience is key to success not speed. Time is a cunning speculators best friend if he uses it right”
Jesse Livermore
Sources of education:
Tom Williams Volume spread analysis VSA/ Master the Markets
Richard Wyckoff
Pete Faders VSA*
Read the ticker dot com
Dee Nixon
BTC trading challenge price action/volume techniques
Good luck
CIPLA chart studyWill face stiff resistance around 445-450 levels. If breaks with volume then only go long.
If supply area not broken, can see a slip till 425-420 levels.

Faaalling Bitcoin? Cup and Handle + Volume AnalysisThis is a daily chart for BTCUSD on Bitstamp.
The most obvious thing I want to highlight is the battle at the 0.382 Fib level.
It is very very common for an asset to have a few checks and tests off of 0.382.
And BTC is no exception.
For the past few months, we've witnessed a battle between Bulls V Bears at 0.382.
Now, bull and bear volume has been declining. Who will take over?
It seems like the technical bearish pattern Cup and Handle has surfaced.
The Cup and Handle target is projected downward,
equal to the distance between the neckline and the highest point of the Cup and Handle.
This projection takes us right around the 0.618 and 0.786 levels.
These levels are very common to show reversals .
And around this level, the price is around $6K.
Funny, this is around double the last bottom ($3.1K).
Why am I bringing this up? Remember, if you consider Bitcoin
as a commodity, then you must remember that a commodity's price will gravitate to its cost of production over time .
With difficulty increasing, we know that CoP will increase over time, and that BTC will have higher bottoms , at least for the short to medium term.
So, it makes sense for BTC to follow this Cup and Handle projection.
But remember, the market can do any damn thing it wants; we'll just have to wait and see ;)
