Ethereum Classic - Trend line BATTLE - Who will win?This is a daily chart of ETCUSD on Kraken.
Looking at some of the recent price action, it seems like we're in a trend line battle.
If we draw an uptrend line (green) from the low around $3.5, we see that this is being highly contested with, right now.
Similarly, if we draw a downtrend line (red) from the high around $10, we see that price has not used it much as resistance yet.
Based on this alone, the bears are clearly winning.
But let's look at volume, too, to give us a better picture.
Even in volume, we are in the midst of a long downtrend which has not been contested much with, yet.
Overall, the bears are in control and the bulls have fallen asleep.
Volume

The Key Fib Levels of 0.618 and 0.786 + Volume ProfileHere's a chart that nicely illustrates how the 0.618 and 0.786 levels are frequently used as reversal points by the market.
Price is ping-ponging back and forth between these key levels, and we can also see an almost full Volume Profile (parabolic in shape).
The shape of this VP tells us that all the prices within this given range have been discovered, with the middle areas being the places where the most buying and selling has occurred.
This is a sign of a normal and healthy range.
So, we have the Fib levels working in unison with Volume Profile to paint a picture of a ranging market.

[Quick Guide] PRISM Signals & PDF indicators.
The PRISM Signals appears to work well especially at lower time-frames (even down to 5 min candles).
The key is to maximizing true-positives is to carefully optimize the input parameters and scoring weights and detection thresholds for a specific given chart and timeframe.
See also the 5 mins chart:
Also shown here is the PDF script, which provides: dynamic Fib levels, pSAR indicator, as well as 2 levels standard deviation bands (disabled here).
The thickest green/red limes are the local-top/bottom lines. Adjust the Fib Input Range accordingly to ensure that the local highs/lows are accurately captured.
The 61.8% levels are the thicker blue lines, and the purple lines are additional levels derived base on the mathematical conjugation between Fib levels.
Again, it is highly recommended to carefully check/optimize the input parameters for a given chart/timeframe against historical trends before proceeding to use it.
This script also provides consecutive higher/lower-highs/lows detection, which is disabled here.
Various features of these scripts can be manually Enabled/Disabled by the users to keep the chart neat.
Even though these scripts are constructed from a set of indicators, it is still highly advised to be used in conjunction with other analysis such as: trendlines, volume, and other indicators, etc., as well as analyzing and comparing with higher/lower timeframes, to help filter out or identify possible risk of false-positives to maximize your success rate.
==========================================================
Indicators used:
PRISM Signals (Color and Stdev bands disabled here) -- Algorithm to generate scoring-based bullish/bearish signals derived from the PRISM oscillators set.
PDF {pSAR /w HiLo Trends + Fib Retrace/Extension Levels} -- Parabolic SAR /w HighLow Trends Indicator/Bar-color-marking + Dynamic Fib Retrace and Extension Level.
Ichimoku Cloud {Cybernetwork} -- Ichimoku Cloud with modified parameters.
Related Indicator:
PRISM Oscillator -- pSAR based oscillator, with RSI/StochRSI as well as Momentum/Acceleration/Jerk indicators
==========================================================
~ * ~ * ~ * ~ * ~ * ~ * ~ * ~ * ~ * ~ * ~ * ~ * ~ * ~ * ~ * ~ * ~ * ~ * ~ * ~ * ~
Note:
In no way is this intended as a financial/investment/trading advice. You are responsible for your own investment decisions and trades.
Please exercise your own judgement for your own trades base on your own risk-aversion level and goals as an investor or a trader. The use of OTHER indicators and analysis in conjunction (tailored to your own style of investing/trading) will help improve confidence of your analysis, for you to determine your own trade decisions.
~ * ~ * ~ * ~ * ~ * ~ * ~ * ~ * ~ * ~ * ~ * ~ * ~ * ~ * ~ * ~ * ~ * ~ * ~ * ~ * ~
Please check out my other indicators sets and series, e.g.
LIVIDITIUM (dynamic levels),
AEONDRIFT (multi-levels standard deviation bands),
FUSIONGAPS (MA based oscillators),
MAJESTIC (Momentum/Acceleration/Jerk Oscillators),
and more to come.
Constructive feedback and suggestions are welcome.
If you like any of my set of indicators, and it has benefited you in some ways, please consider tipping a little to my HRT fund. =D
cybernetwork @ EOS
37DzRVwodp5UZBYjCKvVoZ5bDdDqhr7798 @ BTC
MPr8Zhmpsx2uh3F5R4WD98MRJJpwuLBhA3 @ LTC
1Je6c1vvSCW7V2vA6RYDt6CEvqGYgT44F4 @ BCH
AS259bXGthuj4VZ1QPzD39W3ut4fQV5giC @ NEO
rDonew8fRDkZFv7dZYe5w3L1vJSE51zFAx @ Ripple XRP
0xc0161d27201914FC0bAe5e350a193c8658fc4742 @ ETH
GAX6UDAJ52OGZW4FVVG3WLGIOJLGG2C7CTO5ZDUK2P6M6QMYBJMSJTDL @ Stellar XLM
xrb_16s8cj8eoangfa96shsnkir3wctdzy76ajui4zexek6xmqssweu85rdjxrt4 @ Nano
~ JuniAiko
(=^~^=)v~

Story of the BitCoin is about to surprise everyoneFriend of mine said "I hope Bitcoin will go a little higher".
I truly believe this is the problem, too many wishes and hopes by inexperienced people trying to make a fortune, gambling / guessing with absolutely no technical analysis.
It goes up so I buy now, sell later. Easy... Shit! It went down!... I hope it will go back up.
Problem is, it might not go back up soon Ladies and Gentlemen.
I'm not saying this is something anyone of us wants to see but keep your eyes and mind open.
Don't live with promises of Bitcoin reaching 20k, 30k, 60k USD.
Early 2001 everyone was saying that CHF is stable and it is unlikely to move up... guess what? June 2001 started 10 years of a bull market! 10 freaking years!!!
Now let's go back to Bitcoin. It doesn't matter that people are calling which direction Bitcoin will go, because if YOU will not do your own research you are not covered.
The same story is for any Crypro, Forex, Stock, Indice, Commoditie and so on.
Trading is not about feelings, hunch and hope.
Stop lying yourselves and start doing your own research, your own analysis. Make a plan for every single trade and stick to it!
Do it for yourself because I honestly don't mind anyone losing their money, but at the same time is would love to everyone successful with their trades.
Even though a trading guru did a perfect analysis, it can still go the other way, this is normal, it happens and that's part of the trading.
The key is to make more profit than loss.
And for love of God, don't trade only cryptocurrencies. They are way harder than any other type of trading in my humble opinion.
Now drop a like and prepare for Monday session.
Disclaimer
I am not a financial advisor. The advice here given is not financial advice even though my excitement might make it look like such.
You trade at your own risk and nobody can guarantee you results. Even if someone could, I don't.

FACEBOOK MANIPULATION OVER NEWS AND PUMPING EARNINGS IN Q1 2018Accumulation taken place in late 2018 until February 2019 when the mark-up phase began to develop.
Lesson: forget about the news, earnings , etc. This is a pure example of stock manipulation.
Check volume for selling climax, spring and earnings report like the one on the 30th January to break the range.
Well played by the composite operator.
@Mikephicc

Price Volume ActionThe chart explains how we can read a trend breakout and price volume action which can be very helpful in identifying momentum.

Profiting from Order Flow: How to follow the Institutional MoneyHow Order Flow and Liquidity Move the Market
Order flow is the key driver which causes market price to move, buyers and sellers enter the market at different price levels by either supplying liquidity (via Limit orders) or consuming liquidity (via Market orders). When the liquidity balance is tipped, being more buyers than sellers (or vice versa) at a particular price level, the market will move until it reaches equilibrium again.
From the charts this is immediately apparent, by looking for the Support and Resistance levels which indicate a liquidity imbalance - causing price to bounce, moving to the areas of consolidation which indicates the equilibrium zones. Which is the rhythm of the market constantly repeating itself time after time.
The market participants trading the largest amount of volume will ultimately move the market. Those being the most capitalized institutions such as Investment & Commercial Banks, Governments, Funds, Corporates and Institutional Investors. By analysing the Institutional Order Flow, we can make far more informed decisions on where price is likely to go and devise a trading strategy based upon this knowledge.
How to read Order Flow
There are many ways to read order flow - on exchange traded markets with central order books you can analyse the market depth and time and sales, to identify the price levels where large orders have been executed and where they currently lie (given they are not hidden). However, for OTC markets like Spot FX, it is not as transparent as the market is fragmented, non-centralised and lacks a common order book. The market depth available on ECN’s and broker platforms is localised to that venue and will likely not give a true picture of where the large Limit orders rest and the overall market sentiment.
Our Indicators
1. Futures Volume – We will use CME (Chicago Mercantile Exchange) Futures volume. As the Futures price mimics the Spot price, the volume can be used as a reliable indicator to guarantee accuracy due to both markets being directly correlated, and there being a transparent central exchange-based order book.
The Volume displays the number of Futures contracts traded for a certain time period (hour, day, week, month, etc.). Analysing the traded volume is an integral element of the analysis, and according to the dynamics of the volume, we can judge the significance and strength of the price movement.
This indicator shows a fixed interest of the market in relation to some prices or price ranges. It follows that price fluctuations, one way or another, are derived from the inflow or outflow of funds into or out of the market. Therefore, by analysing the volume we can determine the potential places where a price move will start or end. This is due to the cyclical nature of price movements flowing from one volume level to the next in a rhythmic nature, which repeats itself over any time period.
2. Delta – This is the difference between orders executed at the ASK and BID prices. Which is the CME Futures volume of BUY contracts vs SELL contracts traded; it allows us to see the “footprint” of the market beyond the simple candlestick chart.
The net delta value will therefore be Positive or Negative and represents the current market sentiment. A positive delta indicates “positive” order flow as the result of buyers being more aggressive at that price. A negative delta indicates “negative” order flow as the result of sellers being more aggressive at that price.
Consequently, based on the delta we can quantify the potential direction of future price moves with a greater level of conviction, as there is a high correlation between price direction and order flow.
Delta is usually used in several applications:
• studying of the general background of the market sentiment
• searching for a "large" deal
• divergence of the delta, etc.
3. Retail Market Sentiment – This is the current positioning and attitude of Retail investors and is a ratio of Long/Short positions on particular currency pairs. From studies on behavioural finance, market sentiment is seen as a good indicator of market moves, especially when it is at extreme levels.
We will use the MyFXbook Community Outlook indicator as it is a rich data set sourced from hundreds of thousands of live retail trading accounts across the globe, trading with a multitude of independent retail brokers.
We will use this tool as a contrarian indicator to “bet against the crowd”, as typically very bullish sentiment is usually followed by the market going down more than often and vice versa, combined with the fact that a high percentage of Retail investors are unsuccessful.
The Strategy
The key principle of the trading strategy is to discover moves and plans of the Institutional market participants and follow them. The volume shows us where they entered the market (volume levels), the delta shows a disproportion between them (sellers vs buyers). As a result, we can define where the “Institutional players” have their positions (volume levels), determine who dominates the market currently (with the help of delta), and replicate their positioning to make a profit. Additionally, the system always trades against the “crowd” (retail traders) as they have the highest probability of losing money on regular basis. For that purpose, the sentiment indicator is used, which displays the “mood” of the market.
For example, we will be looking for a combination of the following for our entry/exit, as they indicate the turning points in the market:
1. High Volume levels
2. High Delta levels
3. High Retail Sentiment level, which is opposite to the Delta
In summary, the system is based on volume-delta analysis, trend-following, and intraday-swing trading. SLs and TPs are always set; and the minimum risk/profit (SL vs TP) ratio is ½.
To see further analysis and trade ideas based on these principles please follow us!
The Professional Traders choice: VARIANSE

Volume Rising - Altseason?Market cap is still low, but volume is rising again. Might see a new cycle starting.


Small Cap Stock to Watch: NSTG with Dark Pools, Pro TradersNSTG had a speculative momentum run out of a short term bottom. This small-cap stock has finally broken out of its long term trading range to a new high. Now it needs to shift sideways to avert a falling stock price. There is some mild accumulation in the consolidation patterns that are representative of one or two Dark Pool giants and some pro traders who both stabilize and control price to a neat and tidy-looking consolidation.
NSTG is not a buy at the moment as the run is overextended at this point, but it is worth considering for a possible watchlist candidate since it is in Nano technology, which is finally forging ahead again with more products moving to the market acceptance phase.

AKAM: Dark Pools & Pro Traders Patterns Ahead of Earnings TodayAkamai Technologies Inc. reports earnings today with a solid start to a bottoming formation with Dark Pools' and then Pro traders’ footprints. The stock is currently at a completion level for the short term bottom. A Shift of Sentiment™ pattern formed between October and January. AKAM moved lower before finding the final low support from a previous Dark Pool Buy zone while Accumulation/Distribution indicators exposed the positive divergence. The pattern is a setup for a swing trade, not a position trade opportunity yet.

Identify Impulse and Corrective MovesMarket moves can generally be categorized as either an IMPULSE move or a CORRECTIVE move.
A fast and strong move is described as an IMPULSE move.
A slow and weak move is described as a CORRECTIVE move.
Practical Exercise
1) Pick any currency pair, any timeframe, and identify the IMPULSE and CORRECTIVE moves on the chart.
2) Draw a line on the IMPULSE move; draw a box on the CORRECTIVE move.
3) Post your chart on the comment section below.
4) Repeat this practice on 2 other currency pairs.

Gaps in the volume profileJust a example to show how gaps in the Volume Profile caused during fast falls or rises in price are filled at a later date.
The gap between 4200 down to 3800 during the drop on 24th November was filled just over 24 hours later.
The left window shows the volume profile prior to the drop and up to the bottom of the drop.
The right window shows the volume profile from the start of the rise back up to 4000.
I have displayed the volume profiles back to back to make it easier to visualise.
The range of the gap in the volume profile has been marked with a box extending across both sides.
There are some other boxes in the chart that mark previous volume areas from last year.
This was created on my working chart and I didn't want to spend the time hiding them or opening a new chart for this example.

Going Full Wab with WABIBTC: 20% Gain over 3 Days in 6 TradesDid you know that the word "wab" is a word? Seriously, check it out. Anyway, as much as I love trading high-volatility altcoins, I really don't like doing it on 15 minute periods. For most alts, you're risking getting stopped out due to dumps that are happening in the meantime.
Yet, if you're willing to shoulder some risk and the market is "generally" positive, there's money to be made. That's the case with WABIBTC over the past 3 days. The chart has been mostly sideways, trading within a tight range. But when it exploded earlier today and left me with a >10% gain , I figured I'd share the results with my fellow traders.
As you can see, my indicator signaled 6 profitable trades. Although two of them were for virtually nothing, when you are automating and have things set up correctly you can get out without too much trouble.
============================================================================
List of Entry Signals + Trades Captured with the AllCryptoSignals Volume Pressure Gauge
===========================================================================
Here's a quick list of WABIBTC trades over the past three days. These exact trades can be made with the following two tools:
1) My AllCryptoSignals Volume Pressure Gauge Indicator ( )
Chart period: 15 minute, VP Gauge setting: 12, Alert Crossing Up over -1
2) An automated trading bot that buys on my signal and sells using a trailing stop once hitting a specific price gain (Gunbot + Trailing Stop - Stop Limit or any other bot that supports a trailing stop is perfect!)
Trade #1 - 3.5% (3 hours)
Trade #2 - 1% (4 hours)
Trade #3 - 1% (2.5 hours. Exited manually)
Trade #4 - 1% (3 hours. Automated exit due to the recent negativity)
Trade #5 - 4.5% (1.5 hours. Finally a decent gain!)
Trade #6 - 11% (There's the pump! Got out right on time.)
There are pros and cons to setting my VPG indicator to a high setting. On the plus side, the trades are generally safer and function better with low-volume altcoins. On the downside, the signals come a bit later so you end up missing potential gains. Oh well!
What are your thoughts? Have you been trading WABIBTC or just sitting this round out?
AllCryptoSignals
(Learn more about the AllCryptoSignals Volume Pressure Gauge indicator here: )

Liquidity Pool / Stop Loss Explanation POE SignalA group member had a question about why the stop loss was "so low" being 23% under the buy price. The reasoning is you need to avoid the liquidity zone, where price could easily be pushed.
The purpose of our stop is to exit the trade if its no longer valid (not get stopped out only to see a pump happen afterwards). This could be another accumulation cycle, so we want to ride out the potential for a dip.
As normal traders we normally dont have to deal with extremely large positions. But the whales/institutions who do have to think about liquidity very differently than you or I. Order flow intersections are what they look for. They have to go TO the liquidity - which is many times where people end up placing their stops. They cannot simply accumulate or distribute a large position whenever and wherever they wish. Rather, they must look to those levels where liquidity is aggregating, and stops are helping them in an indirect way.
Without a Support/Resistance Finder (SRF) to help you, you can also/alternately use a volume profile as shown. SRF auto plots the S/R lines for the current range (all the horizontal dashed red and green lines are done by SRF). You want to place your stop BELOW where the liquidity is likely located - and also where your trade idea is invalidated.
In the opposite sense there is a liquidity zone above as well. Many times you will see price probe the same levels over a few days. This is testing the resistance and seller appetite. You can see this here in the 210+ area as price has been probing the upper resistance.

ETH volume profile idea...detail in the chart, playing on the idea that the majority make use of the default tradingview settings for this indicator...

GapologyThis indicator can be used as a simple measure of price action tradability. It's an alternative to volume that focuses on the gaps between close and open candle prices. The bigger the gaps, the more spread and slippage you'll get when trading.


How to separate the volume indicator from the chartPlease see the video on how to do it.
Have a good one!

Fundamentals of the Head and Shoulder BottomMany of the educational posts out there are mere examples of past chart patterns that have already completed themselves. Which this is an excellent way to study data and to help predict future movements, it tends to create over-confident traders.
As many of us know that there is no 100% guarantee to any chart pattern. However many people, myself included, sometimes become too stuck on one pattern and its outcome, and to not fully recognize the fact that it can fail.
Leading to why I decided to make this educational post, whether this pattern completes itself or not, it is here to show you what trading is actually like.
The chart above displays a textbook Head and Shoulders Bottom (also called Inverse Head and Shoulders) pattern forming. However, this pattern has yet to fully complete itself, and even if it does, it may or may not hit our preferred target.
But lets break down the fundamentals of a Head and Shoulders Bottom.
Prior Trend : The reason it is called a head and shoulders bottom pattern, is because it occurs after a previous downtrend. So we first must check that the trend is down before considering this pattern.
The Body : The reason it is called a head and shoulders pattern is due to its shape. The head is ALWAYS the lowest point in this pattern, while the left and right shoulders sit at similar levels above the head. All three of these points then share the same resistance level know as the neckline.
Neckline : The neckline forms by connecting the highs following the left shoulder and the head of the pattern. This line can slope up, slope down, or be horizontal. This is the key level to break in this pattern.
Right Shoulder : There seems to lots of controversy with the right shoulder, some believe that this level must at the exact same or higher level than the left shoulder. However this is not the case. While symmetry is preferred, sometimes the shoulders can be out of whack, and the right shoulder will be higher, lower, wider, or narrower.
Volume : Since this pattern forms on the bottom of bear trends, there should be heavy selling volume on the left and right shoulders, while the right shoulder should be accompanied by light selling pressure.
The most important moment for volume occurs on the advance from the low of the right shoulder. For a breakout to be considered valid, there needs to be an expansion of volume on the advance and during the breakout.
Neckline Break : In order for this pattern to complete itself. There MUST be a break above the neckline . Otherwise the neckline remains resistance the the trend continues downwards.
Confirmation : Some believe the the neckline break serves as confirmation. However the real confirmation is once the neckline which once acted as resistance, later acts as support.
Target : The preferred target may be measured by taking the distance from the bottom of the head up to the neckline. While this is just a preferred target, one must consider other possible resistance levels.
Remember, even with all the patterns out there, there is never a 100% guarantee in trading.
I wish you all the best of luck!
I Hope you all found this educational post intresting and maybe even a little helpful!
DISCLAIMER:
Please note I am only providing my own trading information for your benefit and insight to my trading techniques, you should do your own due diligence and not take this information as a trade signal.

VPVR: Using HVN & LVN with BitcoinLonging here & giving a quick lesson on how to use high & low volume nodes with the VPVR. Price will often move from HVN to HVN while blasting through LVNs where there is a low amount of orders/low liquidity. You can use this to find S&R levels and price targets.

ETH potential long levelsI have mentioned a few times that ETH is my favourite fundamental pick in the complex. I wouldn't pretend to know details about the technologies, but the resilience of ETHUSD in the latest selloff further boosts my conviction. Presenting some chart analysis here.
There is a new significant zone emerging at the 735-740 level. I would stay flat below that level in order to preserve capital. I still place value in the 755 level which was the last PoC, would get half long above that and add to it on a breakout of the 775 level. It can be quite difficult to be patient to buy at a higher level, but that is the key to capital preservation imho. Should the complex sell off further, even the strongest tickers will follow lower. The key is to wait for the market to stabilize, and then get behind the strongest of the bunch.
“Do not anticipate and move without market confirmation—being a little late in your trade is your insurance that you are right or wrong.” -Jesse Livermore

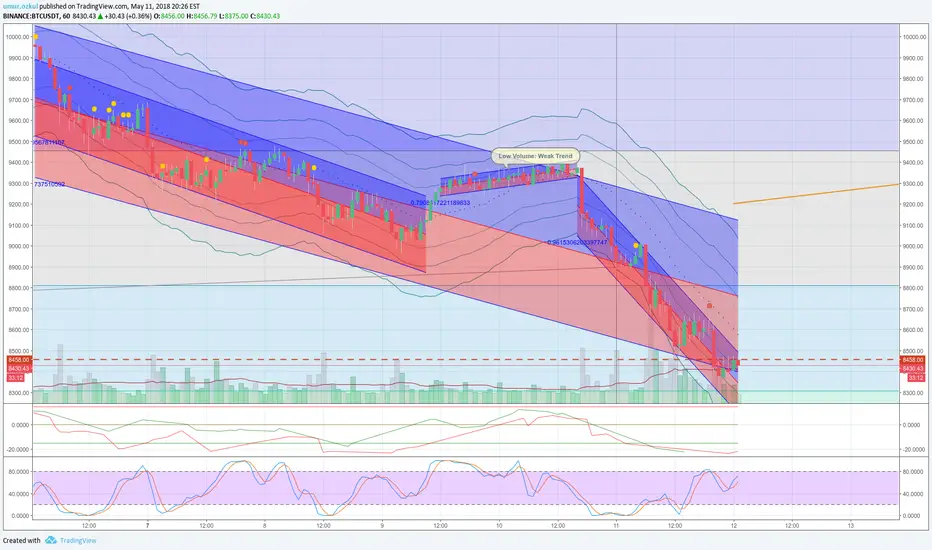
Regression Tool Showing Weak TrendBINANCE:BTCUSDT
This is an educational idea to highlight what happened in the last days.
Regression tool is showing what is going on nicely. I love it.
Between the 2 falls the up-trend is very weak. The volume is very low. Hence bulls cannot take over.