RSI-Adaptive T3 [ChartPrime]The RSI-Adaptive T3 is a precision trend-following tool built around the legendary T3 smoothing algorithm developed by Tim Tillson , designed to enhance responsiveness while reducing lag compared to traditional moving averages. Current implementation takes it a step further by dynamically adapting the smoothing length based on real-time RSI conditions — allowing the T3 to “breathe” with market volatility. This dynamic length makes the curve faster in trending moves and smoother during consolidations.
To help traders visualize volatility and directional momentum, adaptive volatility bands are plotted around the T3 line, with visual crossover markers and a dynamic info panel on the chart. It’s ideal for identifying trend shifts, spotting momentum surges, and adapting strategy execution to the pace of the market.
HOIW IT WORKS
At its core, this indicator fuses two ideas:
The T3 Moving Average — a 6-stage recursively smoothed exponential average created by Tim Tillson , designed to reduce lag without sacrificing smoothness. It uses a volume factor to control curvature.
A Dynamic Length Engine — powered by the RSI. When RSI is low (market oversold), the T3 becomes shorter and more reactive. When RSI is high (overbought), the T3 becomes longer and smoother. This creates a feedback loop between price momentum and trend sensitivity.
// Step 1: Adaptive length via RSI
rsi = ta.rsi(src, rsiLen)
rsi_scale = 1 - rsi / 100
len = math.round(minLen + (maxLen - minLen) * rsi_scale)
pine_ema(src, length) =>
alpha = 2 / (length + 1)
sum = 0.0
sum := na(sum ) ? src : alpha * src + (1 - alpha) * nz(sum )
sum
// Step 2: T3 with adaptive length
e1 = pine_ema(src, len)
e2 = pine_ema(e1, len)
e3 = pine_ema(e2, len)
e4 = pine_ema(e3, len)
e5 = pine_ema(e4, len)
e6 = pine_ema(e5, len)
c1 = -v * v * v
c2 = 3 * v * v + 3 * v * v * v
c3 = -6 * v * v - 3 * v - 3 * v * v * v
c4 = 1 + 3 * v + v * v * v + 3 * v * v
t3 = c1 * e6 + c2 * e5 + c3 * e4 + c4 * e3
The result: an evolving trend line that adapts to market tempo in real-time.
KEY FEATURES
⯁ RSI-Based Adaptive Smoothing
The length of the T3 calculation dynamically adjusts between a Min Length and Max Length , based on the current RSI.
When RSI is low → the T3 shortens, tracking reversals faster.
When RSI is high → the T3 stretches, filtering out noise during euphoria phases.
Displayed length is shown in a floating table, colored on a gradient between min/max values.
⯁ T3 Calculation (Tim Tillson Method)
The script uses a 6-stage EMA cascade with a customizable Volume Factor (v) , as designed by Tillson (1998) .
Formula:
T3 = c1 * e6 + c2 * e5 + c3 * e4 + c4 * e3
This technique gives smoother yet faster curves than EMAs or DEMA/Triple EMA.
⯁ Visual Trend Direction & Transitions
The T3 line changes color dynamically:
Color Up (default: blue) → bullish curvature
Color Down (default: orange) → bearish curvature
Plot fill between T3 and delayed T3 creates a gradient ribbon to show momentum expansion/contraction.
Directional shift markers (“🞛”) are plotted when T3 crosses its own delayed value — helping traders spot trend flips or pullback entries.
⯁ Adaptive Volatility Bands
Optional upper/lower bands are plotted around the T3 line using a user-defined volatility window (default: 100).
Bands widen when volatility rises, and contract during compression — similar to Bollinger logic but centered on the adaptive T3.
Shaded band zones help frame breakout setups or mean-reversion zones.
⯁ Dynamic Info Table
A live stats panel shows:
Current adaptive length
Maximum smoothing (▲ MaxLen)
Minimum smoothing (▼ MinLen)
All values update in real time and are color-coded to match trend direction.
HOW TO USE
Use T3 crossovers to detect trend transitions, especially during periods of volatility compression.
Watch for volatility contraction in the bands — breakouts from narrow band periods often precede trend bursts.
The adaptive smoothing length can also be used to assess current market tempo — tighter = faster; wider = slower.
CONCLUSION
RSI-Adaptive T3 modernizes one of the most elegant smoothing algorithms in technical analysis with intelligent RSI responsiveness and built-in volatility bands. It gives traders a cleaner read on trend health, directional shifts, and expansion dynamics — all in a visually efficient package. Perfect for scalpers, swing traders, and algorithmic modelers alike, it delivers advanced logic in a plug-and-play format.
Bands and Channels

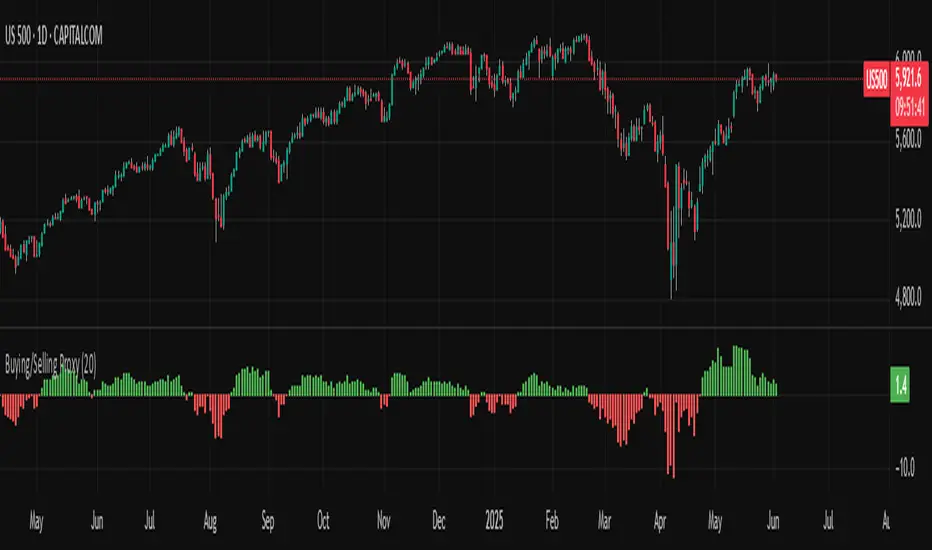
Buying/Selling ProxyTiltFolio Buying/Selling Proxy
This simple but effective indicator visualizes short-term buying or selling pressure using log returns over a rolling window.
How It Works:
Calculates the average of logarithmic returns over the past N bars (default: 20).
Positive values suggest sustained buying pressure; negative values indicate selling pressure.
Plotted as a color-coded histogram:
✅ Green = net buying
❌ Red = net selling
Why Use It:
This proxy helps traders gauge directional bias and momentum beneath the surface of price action — especially useful for confirming breakout strength, timing entries, or filtering signals.
- Inspired by academic return normalization, but optimized for practical use.
- Use alongside TiltFolio's Breakout Trend indicator for added context.
Regression Channel (Interactive)Weighted Interactive Regression Channel (WIRC)
Overview
The Weighted Interactive Regression Channel improves on traditional regression channels by emphasizing key price points through intelligent weighting. Instead of treating all candles equally, WIRC adapts to market dynamics for better trend detection and channel accuracy.
Key Differences from Standard Channels
Weighted vs. Equal: Prioritizes significant events over uniform weighting
Dynamic vs. Static: Adapts in real time to market changes
Accurate vs. Basic: Reduces noise, enhances signal clarity
Customizable vs. Fixed: Full control over weights and visuals
Weighting Methods
Direction Change – Highlights reversal points via local peaks/troughs
Volume-Based – Emphasizes high-volume candles, ideal for breakouts
Price Range – Weights wide-range candles to capture volatility
Time Decay – Prioritizes recent data for current market relevance
Interactive Features
Data Range: Set channel start/end over 1–500 bars
Visuals: Line styles, color coding, fill options, reference lines
Stats: Slope, R², standard deviation, point count, weight method
Technical Implementation
Weighted Regression Formula: Uses weights for slope, intercept, and deviation
Channel Lines: Center = weighted regression; bounds = ± deviation × multiplier
Usage Scenarios
Trend Analysis: Use Direction Change + longer range
Breakouts: Use Volume weighting + fill + boundary watching
Volatility: Apply Price Range weighting + monitor standard deviation
Current Market: Use Time Decay + shorter ranges + stat display
Parameter Tips
Channel Width:
Narrow (1.0–1.5): Responsive
Standard (1.5–2.0): Balanced
Wide (2.0–3.0+): Conservative
Weighting Intensity:
Conservative (1.5–2.0)
Moderate (2.0–3.0)
Aggressive (3.0+)
Advanced Use
Multi-Timeframe: Use different weightings per timeframe
Market Structure: Detect swings, institutional zones
Risk Management: Dynamic S/R levels, volatility-driven sizing
Best Practices
Start with Direction Change
Test different ranges
Monitor stats
Combine with other indicators
Adjust to market context
Recalibrate regularly
Conclusion
WIRC delivers a smarter, more adaptive view of price action than standard regression tools. With real-time customization and multiple weighting options, it’s ideal for traders seeking precision across strategies—trend tracking, breakout confirmation, or volatility insight.

TrendMaster Pro 2.3 with Alerts
Hello friends,
A member of the community approached me and asked me how to write an indicator that would achieve a particular set of goals involving comprehensive trend analysis, risk management, and session-based trading controls. Here is one example method of how to create such a system:
Core Strategy Components
Multi-Moving Average System - Uses configurable MA types (EMA, SMA, SMMA) with short-term (9) and long-term (21) periods for primary signal generation through crossovers
Higher Timeframe Trend Filter - Optional trend confirmation using a separate MA (default 50-period) to ensure trades align with broader market direction
Band Power Indicator - Dynamic high/low bands calculated using different MA types to identify price channels and volatility zones
Advanced Signal Filtering
Bollinger Bands Volatility Filter - Prevents trading during low-volatility ranging markets by requiring sufficient band width
RSI Momentum Filter - Uses customizable thresholds (55 for longs, 45 for shorts) to confirm momentum direction
MACD Trend Confirmation - Ensures MACD line position relative to signal line aligns with trade direction
Stochastic Oscillator - Adds momentum confirmation with overbought/oversold levels
ADX Strength Filter - Only allows trades when trend strength exceeds 25 threshold
Session-Based Trading Management
Four Trading Sessions - Asia (18:00-00:00), London (00:00-08:00), NY AM (08:00-13:00), NY PM (13:00-18:00)
Individual Session Limits - Separate maximum trade counts for each session (default 5 per session)
Automatic Session Closure - All positions close at specified market close time
Risk Management Features
Multiple Stop Loss Options - Percentage-based, MA cross, or band-based SL methods
Risk/Reward Ratio - Configurable TP levels based on SL distance (default 1:2)
Auto-Risk Calculation - Dynamic position sizing based on dollar risk limits ($150-$250 range)
Daily Limits - Stop trading after reaching specified TP or SL counts per day
Support & Resistance System
Multiple Pivot Types - Traditional, Fibonacci, Woodie, Classic, DM, and Camarilla calculations
Flexible Timeframes - Auto-adjusting or manual timeframe selection for S/R levels
Historical Levels - Configurable number of past S/R levels to display
Visual Customization - Individual color and display settings for each S/R level
Additional Features
Alert System - Customizable buy/sell alert messages with once-per-bar frequency
Visual Trade Management - Color-coded entry, SL, and TP levels with fill areas
Session Highlighting - Optional background colors for different trading sessions
Comprehensive Filtering - All signals must pass through multiple confirmation layers before execution
This approach demonstrates how to build a professional-grade trading system that combines multiple technical analysis methods with robust risk management and session-based controls, suitable for algorithmic trading across different market sessions.
Good luck and stay safe!

Low Volatility Breakout Detector)This indicator is designed to visually identify potential breakouts from consolidation during periods of low volatility. It is based on classic Bollinger Bands and relative volume. Its primary purpose is not to generate buy or sell signals but to assist in spotting moments when the market exits a stagnation phase.
Arrows appear only when the price breaks above the upper or below the lower Bollinger Band, the band width is below a specified threshold (expressed in percentage), and volume is above its moving average multiplied by a chosen multiplier (default is 1). This combination may indicate the start of a new impulse following a period of low activity.
The chart background during low volatility is colored based on volume strength—the lower the volume during stagnation, the less transparent the background. This helps quickly spot unusual market behavior under seemingly calm conditions. The background opacity is dynamically scaled relative to the range of volumes over a selected period, which can be set manually (default is 50 bars).
The indicator works best in classic horizontal consolidations, where price moves within a narrow range and volatility and volume clearly decline. It is not intended to detect breakouts from formations such as triangles or wedges, which may not always exhibit low volatility relative to Bollinger Bands.
Settings allow you to adjust:
Bollinger Band length and multiplier,
Volatility threshold (in %),
Background and arrow colors,
Volume moving average length and multiplier,
Bar range used for background opacity scaling.
Note: For reliable results, it’s advisable to tailor the volatility threshold and volume/background ranges to the specific market and timeframe, as different instruments have distinct dynamics. If you want the background color to closely match the color of breakout arrows, you should set the same volume analysis period as the volume moving average length.
Additional note: To achieve a cleaner chart and focus solely on breakout signals, you can disable the background and Bollinger Bands display in the settings. This will leave only the breakout arrows visible on the chart, providing a clearer and more readable market picture.

PER Bands (Auto EPS)PER Bands Indicator - Technical Specification
Function
This PineScript v6 overlay indicator displays horizontal price bands based on Price-to-Earnings Ratio multiples. The indicator calculates price levels by multiplying earnings per share values by user-defined PER multiples, then plots these levels as horizontal lines on the chart.
Data Sources
The script attempts to automatically retrieve earnings per share data using TradingView's `request.financial()` function. The system first queries trailing twelve months EPS data, then annual EPS data if TTM is unavailable. When automatic retrieval fails or returns zero values, the indicator uses manually entered EPS values as a fallback.
Configuration Options
Users can configure five separate PER multiples (default values: 10x, 15x, 20x, 25x, 30x). Each band supports individual color customization and adjustable line width settings from 1 to 5 pixels. The indicator includes toggles for band visibility and optional fill areas between adjacent bands with 95% transparency.
Visual Components
The indicator plots five horizontal lines representing different PER valuation levels. Optional fill areas create colored zones between consecutive bands. A data table in the top-right corner displays current EPS source, EPS value, current PER ratio, and calculated price levels for each configured multiple.
Calculation Method
The indicator performs the following calculations:
- Band Price = Current EPS × PER Multiple
- Current PER = Current Price ÷ Current EPS
These calculations update on each bar close using the most recent available EPS data.
Alert System
The script includes alert conditions for price crossovers above the lowest PER band and crossunders below the highest PER band. Additional alert conditions can be configured for any band level through the alert creation interface.
Debug Features
Debug mode displays character markers on the chart indicating when TTM or annual EPS data is available. This feature helps users verify which data source the indicator is using for calculations.
Data Requirements
The indicator requires positive, non-zero EPS values to function correctly. Stocks with negative earnings or zero EPS will display "N/A" for current PER calculations, though bands will still plot using the manual EPS input value.
Exchange Compatibility
Automatic EPS data availability varies by exchange. United States equity markets typically provide comprehensive fundamental data coverage. International markets may have limited automatic data availability, requiring manual EPS input for accurate calculations.
Technical Limitations
The indicator cannot fetch real-time EPS updates and relies on TradingView's fundamental data refresh schedule. Historical EPS changes are not reflected in past band positions, as the indicator uses current EPS values for all historical calculations.
Display Settings
The information table shows EPS source type (TTM Auto, Annual Auto, Manual, or Manual Fallback), allowing users to verify data accuracy. The table refreshes only on the last bar to optimize performance and reduce computational overhead.
Code Structure
Built using PineScript v6 syntax with proper scope management for plot and fill functions. The script uses global scope for all plot declarations and conditional logic within plot parameters to handle visibility settings.
Version Requirements
This indicator requires TradingView Pine Script version 6 or later due to the use of `request.financial()` functions and updated syntax requirements for plot titles and fill operations.

Consolidation Range with Signals (Zeiierman)█ Overview
Consolidation Range with Signals (Zeiierman) is a precision tool for identifying and trading market consolidation zones, where price contracts into tight ranges before significant movement. It provides dynamic range detection using either ADX-based trend strength or volatility compression metrics, and offers built-in take profit and stop loss signals based on breakout dynamics.
Whether you trade breakouts, range reversals, or trend continuation setups, this indicator visualizes the balance between supply and demand with clearly defined mid-bands, breakout zones, and momentum-sensitive TP/SL placements.
█ How It Works
⚪ Multi-Method Range Detection
ADX Mode
Uses the Average Directional Index (ADX) to detect low-trend-strength environments. When ADX is below your selected threshold, price is considered to be in consolidation.
Volatility Mode
This mode detects consolidation by identifying periods of volatility compression. It evaluates whether the following metrics are simultaneously below their respective historical rolling averages:
Standard Deviation
Variance
Average True Range (ATR)
⚪ Dynamic Range Band System
Once a range is confirmed, the system builds a dynamic band structure using a volatility-based filter and price-jump logic:
Middle Line (Trend Filter): Reacts to price imbalance using adaptive jump logic.
Upper & Lower Bands: Calculated by expanding from the middle line using a configurable multiplier.
This creates a clean, visual box that reflects current consolidation conditions and adapts as price fluctuates within or escapes the zone.
⚪ SL/TP Signal Engine
On detection of a breakout from the range, the indicator generates up to 3 Take Profit levels and one Stop Loss, based on the breakout direction:
All TP/SL levels are calculated using the filtered base range and multipliers.
Cooldown logic ensures signals are not spammed bar-to-bar.
Entries are visualized with colored lines and labeled levels.
This feature is ideal for traders who want automated risk and reward reference points for range breakout plays.
█ How to Use
⚪ Breakout Traders
Use the SL/TP signals when the price breaks above or below the range bands, especially after extended sideways movement. You can customize how far TP1, TP2, and TP3 sit from the entry using your own risk/reward profile.
⚪ Mean Reversion Traders
Use the bands to locate high-probability reversion zones. These serve as reference zones for scalping or fade entries within stable consolidation phases.
█ Settings
Range Detection Method – Choose between ADX or Volatility compression to define range criteria.
Range Period – Determines how many bars are used to compute trend/volatility.
Range Multiplier – Scales the width of the consolidation zone.
SL/TP System – Optional levels that project TP1/TP2/TP3 and SL from the base price using multipliers.
Cooldown – Prevents repeated SL/TP signals from triggering too frequently.
ADX Threshold & Smoothing – Adjusts sensitivity of trend strength detection.
StdDev / Variance / ATR Multipliers – Fine-tune compression detection logic.
-----------------
Disclaimer
The content provided in my scripts, indicators, ideas, algorithms, and systems is for educational and informational purposes only. It does not constitute financial advice, investment recommendations, or a solicitation to buy or sell any financial instruments. I will not accept liability for any loss or damage, including without limitation any loss of profit, which may arise directly or indirectly from the use of or reliance on such information.
All investments involve risk, and the past performance of a security, industry, sector, market, financial product, trading strategy, backtest, or individual's trading does not guarantee future results or returns. Investors are fully responsible for any investment decisions they make. Such decisions should be based solely on an evaluation of their financial circumstances, investment objectives, risk tolerance, and liquidity needs.

Daily Fibonacci Levels [Asa]This indicator plots dynamic daily Fibonacci levels based on the overnight session high and low, helping traders identify key price zones for potential reversals, breakouts, and pullbacks during the regular trading session.
Key Features:
Overnight Session High/Low Detection: Automatically captures the high and low between user-defined hours (default 16:00–09:30 EST).
Day Session Levels: Fibonacci retracement and extension levels are calculated once the regular session begins (default 09:30–16:00 EST).
Proximity Filter: Only plots levels that are within a customizable threshold of the current price to reduce chart clutter.
Custom Styling: Choose from solid lines, crosses, or circles, and customize the line width for a personalized look.
Mirrored Extensions: Includes both upside and downside Fibonacci extensions beyond the 100% level (up to 300%).
Labels: Clearly marks the overnight high and low with labeled points at session start.
Use Case:
Ideal for intraday and swing traders who rely on overnight price action to map out key Fibonacci levels before and during the trading day. This tool helps quickly identify zones of confluence, potential resistance/support, and continuation levels.
Customization Options:
Session hours and timezone
Line width and style
Proximity threshold for level visibility

AXR-VolSD-Loc📈 AXR-VolSD-Loc — Volatility & Range Mapping Tool for Smart Traders
The AXR-VolSD-Loc indicator is a professional-grade tool designed for traders who rely on precise volatility analysis and structured range-based levels. It combines dynamic volatility bands with configurable price ranges such as ADR, AWR, AMR, and AQR — offering strategic clarity across all timeframes.
🔍 Key Features
Multi-Timeframe Range Calculation
Supports Daily (ADR), Weekly (AWR), Monthly (AMR), and Quarterly (AQR) ranges — each with independent period controls.
Standard Deviation Volatility Bands
Automatically or manually calculate standard deviation (%) to plot multiple upper/lower levels from a base price reference.
Fully Customizable Lines & Labels
Choose the number of bands, enable half-volatility levels, apply color gradients, customize line styles, widths, label positions, font sizes and offsets.
Flexible Anchor Logic
Set the base line for volatility from Hi/Lo/50%/0% of AXR, or input your own manual price — ideal for ICT model alignment.
Smart Visuals & Optimized Drawing
Clean line and label management using line.new() and label.new() with efficient updates only when required.
Data Table & Summary Panel
Floating table displays key metrics like high/low range, midpoint, volatility settings, and source references.
Built-In Alerts
Receive alerts when price approaches key volatility levels or AXR range extremes — ideal for anticipating institutional behavior.
🛠️ How to Use & Configure
1. Choose the Range Mode
In "AXR Mode & Period Settings", select your preferred range type:
Daily (ADR) – Short-term or intraday.
Weekly (AWR) – Medium swing positions.
Monthly (AMR) – Optimal for higher-timeframe structure.
Quarterly (AQR) – Best for macro-level zones.
Then define the number of days/weeks/months/quarters used to calculate each.
2. Define the Volatility Base Line
Under "Volatility Base Line Settings", configure the anchor:
Use 0% AXR for midpoint, or Hi/Lo/50% for edges.
Manual mode allows custom price input.
Adjust the line color, style, and thickness.
3. Configure Standard Deviation
In "Standard Deviation - Calculation & Levels", select the source:
Automatic AXR — calculates % based on AXR range.
Manual — allows custom % input.
Define how many levels above/below the base line.
Use the scale factor to adjust relative strength (e.g., 0.5 = 50% of AXR).
4. Adjust Visual Display
In "Display & Labels":
Enable or disable volatility lines.
Use color progression for intensity from blue to red.
Show or hide intermediate lines (half deviation).
Choose label alignment: right, center, or left.
Fine-tune label position with candle offset and text size.
5. Extend Lines and Define Visibility
You can choose to extend the lines left, right or both directions — or use a fixed number of bars when not extended.
This applies to both volatility lines and AXR levels.
6. Show AXR Hi/Lo/50%/0% Lines
In "AXR Levels":
Enable display of Hi, Lo, midpoint, and 50% levels.
Toggle display of AXR open levels (MO-based).
Customize style, color and width of each line.
7. Enable the Table (Optional)
Turn on the floating data table to see a quick summary:
Range high/low/midpoint.
Volatility multiplier.
Source (manual vs automatic).
Period length.
Useful for fast review during market sessions.
8. Alerts
Receive automated alerts when price approaches:
AXR Hi/Lo
0% midpoint level
Custom-defined deviation bands
✅ Use Cases
Define and monitor volatility zones around structured ranges.
Combine AMR or AQR with deviation bands for swing setups.
React to price imbalances at 50% or 0% AXR zones.
Integrate with order blocks, liquidity zones or ICT-based confluences.
Questions or suggestions? Contact us via TradingView message or in the comments.
Happy trading!

DTMA (Double Triangular Moving Average)English Description:
DTMA (Double Triangular Moving Average) is a smoothed moving average indicator that applies a triangular moving average (TMA) twice to reduce lag and provide a more stable trend line. The formula used is:
DTMA = 2 * TMA(src, period) - TMA(TMA(src, period), period)
This implementation focuses on the core calculation and plotting of the DTMA line, omitting visual styling features like bar coloring or trend direction. It's useful for traders looking for a smoother alternative to standard moving averages when identifying trends.

Trend Scanner ProTrend Scanner Pro, Robust Trend Direction and Strength Estimator
Trend Scanner Pro is designed to evaluate the current market trend with maximum robustness, providing both direction and strength based on statistically reliable data.
This indicator builds upon the core logic of a previous script I developed, called Best SMA Finder. While the original script focused on identifying the most profitable SMA length based on backtested trade performance, Trend Scanner Pro takes that foundation further to serve a different purpose: analyzing and quantifying the actual trend state in real time.
It begins by testing hundreds of SMA lengths, from 10 to 1000 periods. Each one is scored using a custom robustness formula that combines profit factor, number of trades, and win rate. Only SMAs with a sufficient number of trades are retained, ensuring statistical validity and avoiding curve fitting.
The SMA with the highest robustness score is selected as the dynamic reference point. The script then calculates how far the price deviates from it using rolling standard deviation, assigning a trend strength score from -5 (strong bearish) to +5 (strong bullish), with 0 as neutral.
Two detection modes are available:
Slope mode, based on SMA slope reversals
Bias mode, based on directional shifts relative to deviation zones
Optional features:
Deviation bands for visual structure
Candle coloring to reflect trend strength
Compact table showing real-time trend status
This tool is intended for traders who want an adaptive, objective, and statistically grounded assessment of market trend conditions.

ATR Pulse Breakout ATR Pulse Breakout is a versatile volatility-based indicator that identifies buy and sell signals using an adaptive ATR trailing stop strategy. By dynamically tracking market volatility, this indicator highlights potential trend reversals and breakout opportunities with precision.
Features:
• Signals generated when price crosses the ATR-based trailing stop, indicating actionable buy and sell points
• Two extended horizontal lines marking the high and low of the breakout candle for clear visualization
• Semi-transparent candle highlights to emphasize signal bars
• Buy and Sell arrows with customizable colors and labels for easy identification
• User inputs for ATR length, multiplier, and smoothing method to adjust sensitivity
Trading Approaches:
• Aggressive Traders: May enter immediately after the signal candle closes on the 15-minute timeframe to capitalize on early momentum
• Conservative Traders: Should wait for a confirmed breakout above or below the highlighted lines before entering, reducing false signals and enhancing trade reliability
Usage:
Ideal for traders looking to capture volatility-driven moves, ATR Pulse Breakout works well for day trading, swing trading, and longer-term strategies. Use the signals alongside your preferred risk management and confirmation tools to improve trading accuracy.
Developed with care by Ats9, combining robust volatility measures with clean visual cues for improved trade decision-making.

PRO Trading Averaging Beta(v1)Adaptive Position Scaling
Automatically increases position size during pullbacks using exponential volume scaling (1x, 2x, 4x, etc.). This reduces average entry cost and accelerates breakeven when price reverses.
Multi-Timeframe Confirmation
All indicators operate on a higher timeframe (120 minutes), providing:
Noise-filtered signals
Stronger trend alignment
Reduced false entries
Triple-Layer Entry Logic
Requires simultaneous confluence of:
Custom Bollinger Band penetration
RSI oversold filter (above critical threshold)
Golden cross confirmation (fast MA > slow MA)
Volatility assessment via ATR
Intelligent Exit System
Position closure triggers when either:
Fixed profit target (% of account) is reached
Technical boundary (upper Bollinger Band) is touched
⚙️ Core Mechanics:
graph LR
A --> B
B --> C{Initial Entry: 1% capital}
C --> D
D -->|Yes| E
D -->|No| F
E --> G{Max Averaging Levels?}
G -->|No| D
G -->|Yes| H
F --> I
📊 Implementation Guide:
Capital Configuration
Set initial_capital to your actual account size
Calculate base contract size:
(Account Size × 0.01) / (Instrument Price × Point Value)
Example: $10,000 account → 0.01 BTC futures contracts
Pyramiding Structure
Volume progression per averaging level:
Level 1: 1× (Base volume)
Level 2: 2×
Level 3: 4×
Level 4: 8×
Level 5: 16×
Level 6: 32×
(Max 6 levels configurable in strategy settings)
Custom Entry Variations
Alternative approach for swing captures:
// Enter only at 3rd averaging with 5% capital
if averaging_condition and strategy.opentrades == 2
strategy.entry("SwingEntry", strategy.long, qty=base_order_size*5)
Risk Management Protocol
No traditional stop-loss (replaced by averaging)
Break-even trigger: Manually move to breakeven at +0.5% profit
Max exposure: Capped at 6 averaging levels
Commissions: Pre-configured at 0.1% per trade
⚠️ Critical Risk Disclosures:
"Past Performance ≠ Future Results"
Historical optimization requires continuous forward testing ("Walk Forward" in TV).
Pyramiding Hazards
Exponential volume growth demands:
Minimum 20% free margin buffer
High liquidity instruments (spread < 0.5% of ATR)
Strict per-level risk calculation
Market Regime Dependence
Peak efficiency during:
Strong trends with 2-4% retracements
Assets with ATR > 1.5% of daily range
Avoid ranging/low-volatility conditions
💡 Pro Usage Recommendations:
Position Sizing Formula
For futures: Contracts = (Capital × Risk %) / (Entry Price × Point Value × Stop Distance)
Profit Protection
Close 50% position at 50% profit target, trail remainder
Event Safety
Disable averaging during:
High-impact news events
Exchange outages
Abnormal volume spikes
pie
title Risk Allocation per Level
“First Entry” : 12
“Level 2” : 18
“Level 3” : 25
“Level 4” : 45
ESSENTIAL: This strategy demands strict discipline. Terminate averaging when price action deviates from expected patterns. Always maintain reserve capital exceeding maximum drawdown requirements. Regularly validate strategy performance against current market dynamics.
🔥 Уникальные особенности и ценность:
Адаптивное усреднение
Стратегия автоматически увеличивает позицию при движении против вас, используя экспоненциальное наращивание объема (1x, 2x, 4x и т.д.). Это снижает среднюю цену входа и ускоряет выход в прибыль при развороте.
Мультитаймфреймная фильтрация
Все индикаторы работают на старшем таймфрейме (120 минут), что:
Фильтрует рыночный шум
Обеспечивает более надежные сигналы
Синхронизируется с глобальным трендом
Комбинированный триггер входа
Для активации требуется одновременное выполнение 4 условий:
Пробитие кастомной полосы Боллинджера
Подтверждение тренда (быстрая MA > медленной MA)
Контроль перепроданности (RSI выше критического уровня)
Фильтр волатильности (ATR)
Двойной механизм выхода
Закрытие позиций происходит при:
Достижении целевого уровня прибыли (% от депозита)
Техническом сигнале (касание верхней полосы Боллинджера)
⚙️ Как работает стратегия:
graph TD
A --> B
B --> C{Первый вход: 1% депозита}
C --> D
D -->|Да| E
D -->|Нет| F
E --> G{Достигнут лимит усреднений?}
G -->|Нет| D
G -->|Да| H
F --> I
📊 Как пользоваться:
Стартовые настройки
Base Order Size: Стартовый объем = 1% депозита
(Пример: при $10 000 депозита = 0.01 контракта)
initial_capital: Укажите ваш реальный депозит
Правила пирамидинга
Объем наращивается по схеме:
Уровень 1: 1x (базовый объем)
Уровень 2: 2x
Уровень 3: 4x
Уровень 4: 8x
Уровень 5: 16x
Уровень 6: 32x
РЕКОМЕНДУЕТСЯ Максимум 6 уровней усреднения (настраивается в pyramiding)
Кастомизация входов
Пример модификации для агрессивной тактики:
// Вход только на 3-м усреднении с 5% депозита
if averaging_condition and strategy.opentrades == 2
strategy.entry("BuyAggressive", strategy.long, qty=base_order_size*5)
Можно поставить параметр пираммидинг 1 и получать больше сигналов на младших тайм фреймах
Управление рисками
Стоп-лосс: Не используется (заменен усреднением)
Перевод в безубыток: Активируйте вручную при +0.5%
Максимальная просадка: Рекомендуется Ограничивать 6 уровнями усреднения
Комиссии: Учтены (0.1% от объема сделки)
Критические предупреждения:
"Вчера ≠ Сегодня"
Стратегия оптимизирована под историческую волатильность. Регулярно тестируйте на новых данных (режим "Перед тест" в TV).
Опасность усреднения
Экспоненциальный рост объема требует:
Глубокого расчета риска на уровень
Минимум 20% свободного маржи
Ликвидный инструмент (спред < 0.5% от ATR)
Рыночные условия
Максимальная эффективность в:
Трендовых рынках с коррекциями 2-4%
Инструментах с ATR > дневного диапазона 1.5%
💡 Рекомендации по использованию:
Для фьючерсов: Рассчитайте контракты через (капитал * 0.01) / (цена * пункт_стоимости)
При 50% достижении цели прибыли - закройте 50% позиции
Отключайте усреднение при выходе макро-новостей
pie
title Распределение риска
"Первый вход" : 10
"Уровень 2" : 20
"Уровень 3" : 30
"Уровень 4" : 40
ВАЖНО: Эта стратегия требует дисциплины! Прекращайте усреднение при отклонении рынка от исторических паттернов. Всегда имейте резервный капитал для экстренных случаев.

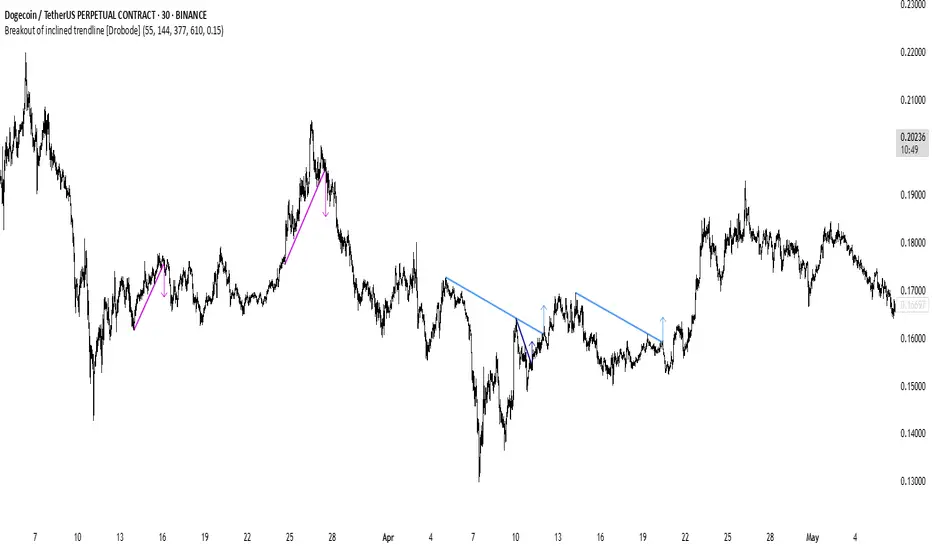
Breakout of inclined trendline [Drobode]█ DESCRIPTION
The script is designed to automatically detect a possible trendline breakout under the conditions of the popular "Slanted Trendline Breakout" strategy. The algorithm assumes that during the movement the price approaches the slanted (trend) line several times. With each subsequent approach (touch) to the trend line, the price consolidates more and more near this line, the distances between the extremes (touches) decrease, which indicates a high probability of a breakout of this line. The script checks the number of touches (approaches) of the extremes and the distances between the extremes. If all conditions are met, the script draws a slanted (trend) line in the corresponding area and an arrow with a possible price breakout direction. The length of the arrow is half the height of the slanted (trend) line and may indicate the level (price) at which it is advisable to fix the profit. In the script, you can enable or disable additional analysis periods (history length, number of bars), the more periods are enabled, the slower the script may load. For example, when placing the script on M-15, we can additionally enable the period 300 or 500, which will allow us to take into account a larger number of historical bars, and this can be considered as the extremes of the older timeframe. The script calculates each period separately, so one large period will not be able to take into account and analyze smaller periods. You can set the percentage deviation of the distance of the extremes from the trend line that touch the inclined line, depending on your needs and style of technical analysis. The smaller the percentage, the more accurate and closer to the inclined line the price extreme should be and vice versa. The main goal of the script is to facilitate the trader's routine work of identifying a possible trend line breakout. However, it should be understood that the script is not a full-fledged self-sufficient strategy, in case of receiving a signal, it is recommended to additionally conduct a comprehensive thorough analysis before taking trading actions. The script can be useful for traders of all levels, both beginners and experienced analysts. Like any other strategy or script, this script can work better on some instruments than on others. When analyzing trading setups, it is desirable to have a clear trend, it is recommended to take into account the signal of this script with a small period when the arrow shows the direction of the trend. However, at the same time, it is necessary to deeply analyze many other factors at this stage, in particular, such as volumes, consolidation, volatility, candlestick patterns, etc.
█ SCRIPT SETTINGS
By default, the script was developed and tested on medium timeframes with cryptocurrency futures instruments USDT.P
Alert
The Alert function in the script is enabled by default, you just need to activate Alert in the TradingView window and select the signal source - Breakout of inclined trendline .
The notification provides the following information (example):
Possible breakout to the upside
Ticker- DOGEUSDT.P
Price- 0.15844
Timeframe- 30
Period length- 377
Periods length
The script allows you to set the length of the period (number of bars) for which the calculation will be performed. Different periods allow you to cover more timeframes (in particular, larger timeframes). You can change up to 4 periods at a time. However, if you choose too large periods, the script may slow down and the loading time will increase. To increase the loading speed of the script, disable additional periods 3, 4, i.e. uncheck the corresponding checkboxes and use only fields 1 and 2 for periods, where you can also set the period length you need.
Percentage deviation of extremes from the trend line
The next settings are the percentage deviation of the extremes from the sloping line. The smaller the deviation, the more accurate and closer to the line the extreme bars should be, however, in this case the number of identification signals will be smaller. By default, the rejection zone is - 0.15%. On larger timeframes, the deviation can be set to be larger.
Relative Wave: Volatility IncludedFor the setup shown, it is best used with the following scripts I have written:
1. Indicator: Volatility Candle Based
2. Multi-Period Charts (use 2 of them): @ 30m and 1H settings
3. Relative Wave: Volatility Included.
Indicator Description: Relative Wave: Volatility Included (RW: Vol)
Pine Script v6 – Technical Overview
🔍 Purpose
The Relative Wave: Volatility Included (RW: Vol) is a custom oscillator designed to measure price position relative to dynamic upper and lower bounds that are influenced by volatility. It incorporates trend filtering, momentum smoothing, and zone detection, providing a composite view of price waves and potential reversal signals.
🧠 How It Works
1. Core Concept: Relative Position within Volatility Bands
The indicator calculates a Relative Wave Index, which measures where the current price sits between recent upper and lower bands derived from standard deviation. These bounds are sorted over a historical window to filter for sensitivity.
2. Sensitivity & Smoothing
Trend Length (Historical_Bar_Count): Defines how many bars are used to build the volatility-adjusted trend range.
Sensitivity Control: Adjusts how reactive the index is to recent price changes.
EMA Smoothing: Custom exponential moving averages are used to smooth values for fast, slow, and overall momentum.
3. Components & Visuals
RW Short-Term Fast Line: Plotted as colored circles indicating quick changes in trend.
RW Short-Term Slow Line: A smoother trend line for signal filtering.
RW Overall Momentum Line: Step-style line measuring broader directional trend.
RW Wave Line: A smoothed average of recent crests and troughs, acting as a cyclical midline reference.
Zone Lines (5/20/50/80/95): Visual thresholds often used as overbought/oversold regions.
⚙️ Key Inputs & Their Effects
Trend Length: Longer = smoother but laggy trends; shorter = more responsive but volatile.
Sensitivity: Higher values = less sensitivity; lower = more reactive.
Signal Lengths (Fast/Slow/Overall): Control the degree of smoothing for each plotted line.
Crest/Trough Lookback: Determines how crests and troughs are calculated from past wave behavior.
✅ Trade Signal Logic
The script defines bullish and bearish conditions based on the interaction of:
RW Wave direction
Overall Momentum direction
Slow Line behavior
Relative positioning (e.g., below or above 50)
Bullish Example:
RW Wave and Momentum are both rising
Values are below 50 (potential upside room)
Slow Line may be falling or just crossed upward
Bearish Example:
RW Wave and Momentum are falling
Values are above 50 (potential downside room)
Slow Line rising or crossed downward
🎨 Visual Aids & Colors
Green: Bullish momentum
Red: Bearish momentum
Blue/Purple Circles: Transition points and fast line status
White/Midrange Lines: Reference zones (like RSI levels)
📈 Best Use Cases
Identifying shifts in market direction before price breakout
Confirming trend strength using wave/momentum alignment
Spotting oversold/overbought zones with volatility context
Combining with other indicators (e.g., price action or volume)
How the Relative Wave Indicator, Volatility-Based Candle Signals, and Multi-Time Period Charts Work Together
This strategy combines three core components—Relative Wave, Volatility Candle Signals, and Multi-Time Period Analysis—to build a layered, high-probability trading framework.
🔷 1. Relative Wave Indicator (used on 3-minute chart)
The Relative Wave Indicator is a momentum and volatility-based oscillator that tracks price movement within a defined range using historical highs and lows derived from standard deviation bands. It smooths price action using fast and slow custom EMAs to identify underlying trend strength and reversals.
Key Features:
Tracks short-term wave structure
Detects momentum shifts based on rising/falling conditions
Uses color-coded momentum signals to help spot turning points early
The wave line and overall momentum line help confirm the quality of trend setups
🔶 2. Volatility Candle-Based Indicator (used on 3-minute chart)
The Volatility Candle Signal highlights significant price action based on expanding or contracting volatility. This tool helps identify moments of potential breakout or reversal by evaluating candle size, wick structure, and deviation from recent ranges.
Key Purpose:
Pinpoints actionable moments when volatility is entering or exiting the market
Works in tandem with Relative Wave to validate whether a momentum shift is strong enough to act on
🕰 3. Multi-Time Period Chart Confirmation (30-minute & 2-hour)
To avoid false signals and ensure alignment with broader market context, two higher timeframes (30m and 2h) are used as confirmation filters.
How They Integrate:
The 30-minute chart provides mid-range trend direction—ideal for intraday bias
The 2-hour chart offers broader trend context and helps avoid trading against dominant macro trends
These are used as overlays or separate indicators that mirror Relative Wave or other trend-detection tools to show whether the short-term setup aligns with bigger picture momentum
✅ Optimal Setup
Execution Timeframe: 3-minute chart
Confirmation Timeframes: 30-minute and 2-hour charts
Ideal Conditions for Trade Entry:
Relative Wave shows bullish/bearish alignment (e.g., wave and momentum lines rising with value <50 for bulls, >50 for bears)
Volatility candles indicate a breakout or reversal
Both the 30m and 2h multi-timeframe indicators confirm the trend direction or support a momentum shift
This integrated approach minimizes noise and increases confidence in each trade setup by ensuring that short-term signals are supported by volatility behavior and broader market context.

Commodity Trend Reactor [BigBeluga]
🔵 OVERVIEW
A dynamic trend-following oscillator built around the classic CCI, enhanced with intelligent price tracking and reversal signals.
Commodity Trend Reactor extends the traditional Commodity Channel Index (CCI) by integrating trend-trailing logic and reactive reversal markers. It visualizes trend direction using a trailing stop system and highlights potential exhaustion zones when CCI exceeds extreme thresholds. This dual-level system makes it ideal for both trend confirmation and mean-reversion alerts.
🔵 CONCEPTS
Based on the CCI (Commodity Channel Index) oscillator, which measures deviation from the average price.
Trend bias is determined by whether CCI is above or below user-defined thresholds.
Trailing price bands are used to lock in trend direction visually on the main chart.
Extreme values beyond ±200 are treated as potential reversal zones.
🔵 FEATURES\
CCI-Based Trend Shifts:
Triggers a bullish bias when CCI crosses above the upper threshold, and bearish when it crosses below the lower threshold.
Adaptive Trailing Stops:
In bullish mode, a trailing stop tracks the lowest price; in bearish mode, it tracks the highest.
Top & Bottom Markers:
When CCI surpasses +200 or drops below -200, it plots colored squares both on the oscillator and on price, marking potential reversal zones.
Background Highlights:
Each time a trend shift occurs, the background is softly colored (lime for bullish, orange for bearish) to highlight the change.
🔵 HOW TO USE
Use the oscillator to monitor when CCI crosses above or below threshold values to detect trend activation.
Enter trades in the direction of the trailing band once the trend bias is confirmed.
Watch for +200 and -200 square markers as warnings of potential mean reversals.
Use trailing stop areas as dynamic support/resistance to manage stop loss and exit strategies.
The background color changes offer clean confirmation of trend transitions on chart.
🔵 CONCLUSION
Commodity Trend Reactor transforms the simple CCI into a complete trend-reactive framework. With real-time trailing logic and clear reversal alerts, it serves both momentum traders and contrarian scalpers alike. Whether you’re trading breakouts or anticipating mean reversions, this indicator provides clarity and structure to your decision-making.

2-Day Volume Weighted Average Price (VWAP)This indicator extends TradingView’s built-in VWAP by calculating a volume-weighted average price over a continuous two-day window (yesterday + today), anchoring VWAP at the start of yesterday’s session and carrying it through to today’s close, but only plotting the segment that falls within the current trading session—yesterday’s data feeds into the calculation to ensure today’s VWAP reflects the prior session’s volume and price action, while the line drawn on your chart always begins at today’s session open.
Standard Deviation Bands: Optional ±1σ, ±2σ, and ±3σ envelopes, exactly as in the default VWAP, but based on the rolling two-day data.

QQQ Strategy v2 ESL | easy-peasy-x This is a strategy optimized for QQQ (and SPY) for the 1H timeframe. It significantly outperforms passive buy-and-hold approach. With settings adjustments, it can be used on various assets like stocks and cryptos and various timeframes, although the default out of the box settings favor QQQ 1H.
The strategy uses various triggers to take both long and short trades. These can be adjusted in settings. If you try a different asset, see what combination of triggers works best for you.
Some of the triggers employ LuxAlgo's Ultimate RSI - shoutout to him for great script, check it out here .
Other triggers are based on custom signed standard deviation - basically the idea is to trade Bollinger Bands expansions (long to the upside, short to the downside) and fade or stay out of contractions.
There are three key moving averages in the strategy - LONG MA, SHORT MA, BASIC MA. Long and Short MAs are guides to eyes on the chart and also act as possible trend filters (adjustable in settings). Basic MA acts as guide to eye and a possible trade trigger (adjustable in settings).
There are a few trend filters the strategy can use - moving average, signed standard deviation, ultimate RSI or none. The filters act as an additional condition on triggers, making the strategy take trades only if both triggers and trend filter allows. That way one can filter out trades with unfavorable risk/reward (for instance, don't long if price is under the MA200). Different trade filters can be used for long and short trades.
The strategy employs various stop loss types, the default of which is a trailing %-based stop loss type. ATR-based stop loss is also available. The default 1.5% trailing stop loss is suitable for leveraged trading.
Lastly, the strategy can trigger take profit orders if certain conditions are met, adjustable in settings. Also, it can hold onto winning trades and exit only after stop out (in which case, consecutive triggers to take other positions will be ignored until stop out).
Let me know if you like it and if you use it, what kind of tweaks would you like to see.
With kind regards,
easy-peasy-x

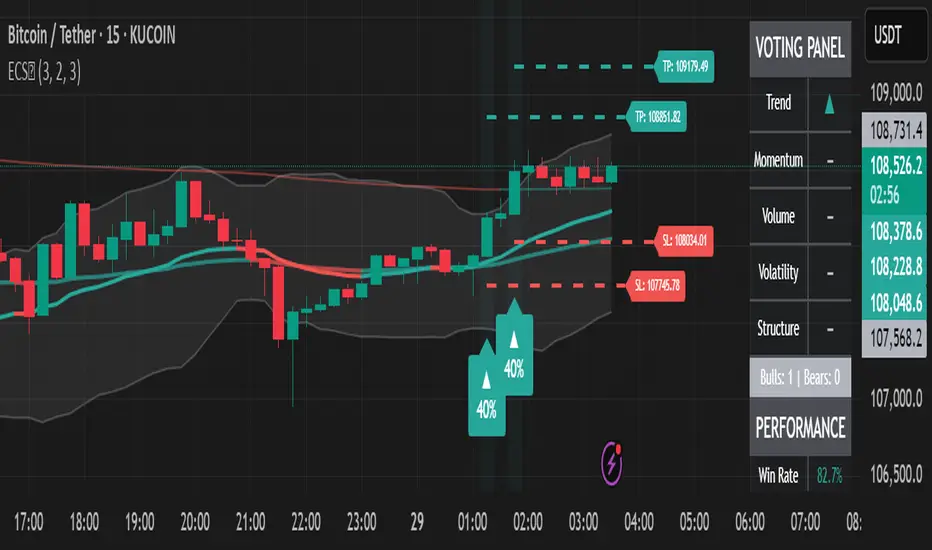
Ensemble Consensus System
The Ensemble Consensus System (ECS) brings a **Random Forest-style ensemble vote** to Pine Script: five orthogonal "expert" strategies each cast a bull/bear vote (+1/-1/0), and only high-confidence consensus moves become signals—dramatically reducing noise while capturing strong directional moves.
## What Makes This Original
ECS is the first Pine Script indicator to implement true machine learning-style ensemble voting. Rather than relying on a single methodology, five independent experts analyze different market dimensions:
• **Trend Expert**: Multi-timeframe EMA alignment analysis
• **Momentum Expert**: RSI/MACD/Stochastic confluence with consistency filters
• **Volume Expert**: Proprietary volume pressure + OBV confirmation
• **Volatility Expert**: Bollinger Band mean reversion opportunities
• **Structure Expert**: Adaptive pivot-based support/resistance detection
## How It Works
The system requires consensus among experts, with an **adaptive threshold** based on market volatility:
| Volatility Regime | ATR/Close | Votes Required |
|-------------------|-----------|----------------|
| Low Volatility | <1% | 2+ |
| Normal Markets | 1-2% | 3+ |
| High Volatility | >2% | 4+ |
This dynamic adjustment prevents overtrading in choppy conditions while maintaining responsiveness during strong trends.
## Key Features
### Signals
• **Visual entry points** with strength percentage (60% = 3/5 experts agree)
• **Adaptive thresholds** that adjust to market conditions
• **Multi-expert consensus** reduces false signals
### Risk Control
• **Dynamic stop-loss/take-profit** based on ATR
• **Regime-adjusted targets** (±50% in volatile markets)
• **Visual SL/TP lines** with exact price labels
### Analytics
• **Real-time vote panel** showing each expert's stance
• **Performance tracking** with win rate and P/L
• **Market regime indicator** (Trending/Ranging/Volatile)
• **Light Mode** for better performance on slower systems
## How to Use
1. **Apply ECS** to a liquid instrument on 15m-4H timeframe (best: 1H)
2. **Wait for signal** - green ▲ for long, red ▼ for short with strength %
3. **Verify votes** - check panel to see which experts agree
4. **Execute trade** using the displayed SL/TP levels
5. **Monitor regime** - be cautious if market regime changes
### Quick Start Settings
• **Standard Trading**: Use defaults (3 votes, adaptive mode ON)
• **Conservative**: Increase to 4 votes minimum
• **Aggressive**: Reduce to 2 votes, tighten stops
## Important Limitations
• **Chart Types**: Not compatible with Renko/Heikin-Ashi
• **Volume Data**: Requires reliable volume (forex pairs may underperform)
• **News Events**: Signals may lag during gaps/major announcements
• **Processing**: Heavy calculations - use Light Mode if needed
## Settings Guide
**Ensemble Controls**
• `Minimum Votes` (default: 3): Base threshold before volatility adjustment
• `Adaptive Mode` (default: ON): Auto-adjusts threshold by market volatility
**Visual Options**
• `Vote Panel`: Live expert voting display
• `Performance Stats`: Win rate and trade tracking
• `Light Mode`: Disables heavy visuals for speed
**Risk Parameters**
• `Stop Multiplier` (default: 2.0): ATR multiple for stop-loss
• `TP Multiplier` (default: 3.0): ATR multiple for take-profit
• `Dynamic TP` (default: ON): Adjusts targets by market regime
## Troubleshooting
**Too few signals?**
→ Lower minimum votes or check if market is ranging
**Indicator running slow?**
→ Enable Light Mode, disable performance tracking
**Weird volume votes?**
→ Verify your symbol has accurate volume data
## Technical Concepts
The ensemble approach mimics **Random Forest algorithms** where multiple decision trees vote on outcomes. By requiring agreement among experts using orthogonal methodologies, ECS filters out signals that would fail under different market lenses. The adaptive threshold addresses fixed-parameter weakness by dynamically adjusting selectivity based on volatility.
• Adaptive pivot lookback for dynamic structure detection
• Safe volume pressure calculation preventing division errors
• Momentum consistency filter reducing choppy false signals
• Unified dashboard merging vote panel + performance stats
• Regime-based dynamic take-profit adjustment
*Educational indicator demonstrating ensemble methods in Pine Script. No guarantee of future performance. Always use proper risk management and position sizing.*
Senn System A"Senn System A" is a robust, all-in-one indicator engineered to enhance your market analysis by intelligently combining the power of Volume Weighted Average Price (VWAP) for range-bound conditions and Exponential Moving Average (EMA) Ribbons for trending environments. This script aims to provide traders with a clear, dynamic visual representation of market structure and momentum across multiple timeframes. A core feature allows you to select and display two distinct VWAP instances simultaneously, each anchoring to your choice of Daily, Weekly, Monthly, Quarterly, or Yearly periods. These VWAPs include clean, filled bands highlighting the area between Standard Deviation 1 and Standard Deviation 2, providing immediate visual cues for key price zones. Furthermore, a unique "Previous VWAP" feature, complete with its own selectable bands and fills, offers valuable historical context for understanding past price action relative to significant volume profiles.
Complementing the VWAP functionality, the indicator integrates an advanced EMA ribbon system, building upon the principles of effective trend visualization. You can customize the lengths of the primary EMA ribbon (defaulting to 25, 36, 50 periods) to suit your analysis of short to medium-term trends. Additionally, dedicated toggles enable the display of higher-timeframe trend ribbons, using EMAs of 100/200 for daily trend and 600/1200 for weekly trend. These ribbons are color-coded based on EMA crossovers, providing intuitive visual signals of trend direction and strength. The "Senn System A" is designed to be highly configurable, allowing traders to tailor the indicator's appearance and active components to their specific trading strategies and market conditions.

SD Median NUPL-Z🧠 Overview
SD Median NUPL-Z is a trend-following indicator that leverages a normalized version of Bitcoin’s Net Unrealized Profit/Loss (NUPL) metric, filtered through a median-based volatility band. Unlike traditional NUPL which is often used to spot extremes, this indicator is designed to identify sustained directional trends — entering only when both on-chain momentum and price structure align.
🧩 Key Features
Z-Scored NUPL Trend Engine: Normalizes NUPL using rolling mean and standard deviation to create a smoothed trend signal.
Price Structure Filter: Implements a median-based price band to avoid false entries during short-term volatility.
Custom Thresholds: User-defined thresholds determine when the trend signal is strong enough to justify a long or short directional bias.
Directional Candle Coloring: Reinforces current trend regime visually with aqua (bullish) and red (bearish) plots and candles.
Optimized for BTC: Uses Bitcoin’s Market Cap and Realized Cap to construct the NUPL input.
🔍 How It Works
On-Chain Core: NUPL is calculated as the percentage of unrealized profit in the market: (Market Cap - Realized Cap) / Market Cap * 100.
Z-Score Transformation: The raw NUPL value is normalized using a rolling average and standard deviation over a set window (default 134 days), producing the NUPL-Z series.
Median-Based Price Filter: A rolling 50th percentile (median) of price is used alongside its own standard deviation to create upper and lower bounds.
These bounds define a "volatility corridor" around price; the trend signal is only acted upon if price confirms by staying outside these bands.
Signal Logic:
A Long signal is triggered when NUPL-Z rises above the long threshold and price is not below the lower band.
A Short signal is triggered when NUPL-Z falls below the short threshold.
State Variable (CD): Tracks the current market regime, used to control plotting and color changes.
🔁 Use Cases & Applications
Momentum-Based Trend Following: Helps traders align with directional moves backed by both on-chain sentiment and supportive price structure.
Filtered Entry Timing: Reduces premature or noise-based entries by requiring price confirmation before committing to NUPL-based signals.
Best Suited for BTC: This tool is designed specifically around Bitcoin’s on-chain metrics and is not intended for altcoins or low-volume assets.
✅ Conclusion
SD Median NUPL-Z repurposes a traditionally cyclical valuation tool into a modern trend-following signal by combining statistical normalization with dynamic price structure filtering. It offers a more robust way to participate in high-conviction directional trends, reducing the likelihood of entering during short-lived counter moves.
⚠️ Disclaimer
The content provided by this indicator is for educational and informational purposes only. Nothing herein constitutes financial or investment advice. Trading and investing involve risk, including the potential loss of capital. Always backtest and apply risk management suited to your strategy.

SD Median MVRV-Z🧠 Overview
SD Median MVRV-Z is a trend-following indicator that uses on-chain valuation signals as a supportive filter. It blends the momentum of the MVRV Z-score with a dynamic median-based price structure to provide cleaner, more reliable directional signals. This tool is designed to identify when price and trend align with favorable broader context — not to pinpoint overbought or oversold extremes.
🧩 Key Features
Trend-Following Core: Signals are built around directional strength, not reversion.
MVRV Z-Score Momentum: Utilizes the statistical momentum of Market Cap vs Realized Cap as a macro trend driver.
Rolling Median Filter: Applies a price-based condition to ensure trend signals are not triggered during short-term counter-moves or noise.
Threshold Customization: Input controls allow traders to define the strength required to trigger long or short signals.
Dynamic Visualization: Candle coloring and filled zones provide instant feedback on current market regime.
🔍 How It Works
Trend Signal: The MVRV ratio is normalized via Z-scoring to produce a momentum-like signal based on how far current valuation deviates from its rolling average.
Price Filter: A rolling median and standard deviation of price define an upper and lower band. These serve to filter out MVRV-Z signals that occur when price is moving against the perceived direction.
Signal Logic:
Long signal = MVRV-Z above threshold and price is not in the lower volatility band.
Short signal = MVRV-Z below threshold, regardless of price band (more aggressive condition).
Directional Engine (CD): Encodes the market regime state (1 for long, -1 for short, 0 for neutral), and drives all visual outputs.
🔁 Use Cases & Applications
Momentum Confirmation: Identify when on-chain momentum and price structure both confirm a trend direction.
Reduced Whipsawing: Filter out weak or conflicting trend signals that would otherwise lead to false entries.
Best Suited for BTC: This indicator is specifically tailored for Bitcoin, using BTC’s Market Cap and Realized Cap data from on-chain sources.
✅ Conclusion
SD Median MVRV-Z is a trend-centric tool that ensures directional conviction by requiring agreement between price structure and underlying market momentum. It is not meant to detect tops or bottoms, but instead to help traders participate in sustainable moves with greater confidence.
⚠️ Disclaimer
The content provided by this indicator is for educational and informational purposes only. Nothing herein constitutes financial or investment advice. Trading and investing involve risk, including the potential loss of capital. Always backtest and apply risk management suited to your strategy.

Dynamic Range Filter with Trend Candlesticks (Zeiierman)█ Overview
Dynamic Range Filter with Trend Candlesticks (Zeiierman) is a volatility-responsive trend engine that adapts in real-time to market structure, offering a clean and intelligent visualization of directional bias. It blends dynamic range calculation with customizable smoothing techniques and layered trend confirmation logic, making it ideal for traders who rely on clear trend direction, structural range analysis, and momentum-based candlestick signals.
By measuring scaled volatility over configurable lengths and applying advanced moving average techniques, this indicator filters out market noise while preserving true directional intent. Complementing this, a dual-trend system (range-based and candle-based) enhances clarity and responsiveness, particularly during shifting market conditions.
█ How It Works
⚪ Scaled Volatility Band Calculation
At the core lies a volatility engine that constructs adaptive range bands around price using smoothed high/low calculations. The bands are dynamically adjusted using:
High/Low Smoothing – Applies a moving average to the raw high and low data before calculating the range.
Scaled Range Volatility – A 2.618 multiplier scales the distance between smoothed highs and lows, forming a responsive volatility envelope.
Band Multiplier – Controls how wide the upper/lower range bands extend from the mean.
This filtering process minimizes false signals and highlights only structurally meaningful moves.
⚪ Multi-Type Smoothing Engine
Users can choose from a wide array of smoothing algorithms for trend construction, including:
HMA (default), SMA, EMA, RMA
KAMA – Adapts to market volatility using efficiency ratios.
VIDYA – Momentum-sensitive smoothing using CMO logic.
FRAMA – Dynamically adjusts to fractal dimension in price.
Super Smoother – Ideal for eliminating aliasing in range signals.
This provides the trader with fine-tuned control over reactivity vs. smoothness.
⚪ Trend Detection (Dual Engine)
The indicator includes two independent trend tracking systems:
Main Trend Filter – Based on adaptive volatility band shifts.
Candle Trend Filter – A second-tier confirmation using smoothed candle data, ideal for directional candles and confirmation entries.
█ How to Use
⚪ Trend Confirmation
Use the Trend Line and colored candlesticks for high-probability entries in the trend direction. The more trend layers that align, the higher the confidence.
⚪ Reversal Zones
When the price reaches the outer bands or fails to break them, look for candle color shifts or a crossover in the range to anticipate possible reversals or consolidations.
█ Settings
Scaled Volatility Length – Controls the lookback used to stabilize the base volatility band.
MA Type & Length – Choose and fine-tune the smoothing method (HMA, EMA, KAMA, etc.)
High/Low Smoother – Pre-smoothing for structural high/low banding.
Band Multiplier – Adjusts the width of the dynamic bands.
Trend Length (Candles) – Length used for candle-based trend confirmation.
-----------------
Disclaimer
The content provided in my scripts, indicators, ideas, algorithms, and systems is for educational and informational purposes only. It does not constitute financial advice, investment recommendations, or a solicitation to buy or sell any financial instruments. I will not accept liability for any loss or damage, including without limitation any loss of profit, which may arise directly or indirectly from the use of or reliance on such information.
All investments involve risk, and the past performance of a security, industry, sector, market, financial product, trading strategy, backtest, or individual's trading does not guarantee future results or returns. Investors are fully responsible for any investment decisions they make. Such decisions should be based solely on an evaluation of their financial circumstances, investment objectives, risk tolerance, and liquidity needs.
