Процентные уровниIndent as a percentage from the current price of the instrument
Отступ в процентах от текущей цены инструмента
Bands and Channels

BK AK-SILENCER (P8N)Unique features:
Uses CVD MA length for standard deviation calculation (tighter bands)
Bands are positioned around the CVD MA (signal line), not the CVD itself
Custom standard deviation multiplier (default: 0.8)

IVR, Current IV, Fair IV (3 variants), Implied Move (MC) v5This indicator shows the Implied Volatility (IV), IV Rank (IVR), Fair IV (3 variants), and Implied Move Forecast for the currently selected symbol using volatility statistics and VIX.
The user can define the volatility calculation length (default 30 days) and number of forecast days (default 30 days) to be used with these parameters.
Updated Fair IV calculation using 3 popular methods: (1) Market-Relative (correlated to VIX and SPX), (2) SMA of HV, and (3) SMA of VIX. User can select among one of these 3 methods.

IVR, Current IV, Fair IV, Implied Move (MC)This indicator shows the Implied Volatility (IV), IV Rank (IVR), Fair IV , and Implied Move Forecast for the currently selected symbol using volatility statistics and VIX.
The user can define the volatility calculation length (default 30 days) and number of forecast days (default 30 days) to be used with these parameters.

✨ HAZE PIVOTS ENHANCED ✨HAZE PIVOTS ENHANCED - Technical Analysis Indicator
Overview
A pivot point detection and visualization tool that identifies potential support and resistance zones based on price structure. The indicator uses Average True Range (ATR) for dynamic level calculation and risk management.
Key Features
Pivot Detection
Identifies swing highs and lows using customizable pivot length
Marks significant price levels where momentum may shift
Zone Visualization
Creates visual zones around pivot points
Adjustable zone width and height based on ATR multiplier
Color-coded zones for easy identification
Risk Management Levels
Automatically calculates stop loss levels using ATR
Projects potential target levels based on volatility
Displays risk-reward ratios for reference
Visual Elements
Optional signal markers at pivot points
Customizable labels and colors
Information table showing current levels
Clean, professional chart presentation
Technical Components
ATR-based calculations for adaptive levels
Pivot high/low algorithm for structure identification
Real-time alert conditions for zone formation
Persistent visual objects that update with new pivots
Customization Options
Pivot length adjustment (1-20 bars)
ATR period and multipliers
Zone dimensions and opacity
Complete color scheme control
Toggle individual visual components
Use Cases
This indicator serves as a technical analysis tool for:
Identifying potential reversal zones
Setting objective stop loss levels
Calculating risk-reward scenarios
Monitoring price structure changes
Important Notes
This is a technical analysis tool for educational purposes
Past performance does not indicate future results
Always conduct your own analysis before making decisions
The indicator provides objective technical levels only
This indicator is designed to assist with technical analysis by visualizing price structure and volatility-based levels. It does not provide trading signals or recommendations.

ADR Custom Anchor n %sAverage daily range.
Advantages on this indicator:
1 - you can select how many days to make the average, this is important on cryptos, because there's 24h/7d of negotiation
2 - select where to anchor, because central banks uses NY 17h candle close on parities to hedge (as know to remove sunday bar)
3 - new levels to get you new reversals spots

Uniswap LP Range Helper by Dayn12Sir
A lightweight Pine Script indicator that lets you:
Visualize any v3/v4 position – set lower/upper ticks, entry price and deposit; the script draws the range and entry lines.
See token balances – labels show how much Token0 or Token1 you’ll hold when the price hits the lower or upper boundary.
Estimate earnings – enter pool TVL, 24 h volume and fee-tier (%). An optional k-factor boosts fees if your range is tighter than the average pool. The panel displays daily fees (USD) and projected APR %.
Toggle everything – check-boxes quickly hide/show range lines, entry line, balance labels or fee label.
Works on any USD-quoted chart; just update the inputs to match the pool you’re analysing.
-------------------------------------------------------------------------------------------------------------
Небольшой Pine Script-индикатор, который позволяет:
Визуализировать позицию v3/v4 — задайте нижнюю/верхнюю границы, цену входа и депозит; скрипт рисует диапазон и линию входа.
Показать остатки токенов — подписи отображают, сколько Token0 или Token1 останется при выходе по нижней или верхней границе.
Оценить доход — введите TVL пула, объём за 24 ч и комиссию пула (%). Дополнительный k-factor увеличивает доход, если ваш диапазон уже среднего. В панели выводятся суточные комиссии (USD) и прогноз APR %.
Управлять отображением — чек-боксы позволяют скрыть/показать линии диапазона, линию входа, подписи остатков или подпись комиссий.
Работает на любом графике, котируемом в USD; достаточно подставить реальные данные пула.


Support and Resistance with SL and TrendOverview :
This script builds a complete chart overlay using dynamic pivot-based Support/Resistance zones, adaptive to market volatility. It incorporates SL estimation, visual trade context cues, and trendline structure—all derived from a smart ATR-normalized engine. Ideal for discretionary traders who want structural confluence, rapid proximity alerts, and volatility-aware S/R levels.
Core Components:
> 1. Volatility-Normalized Pivot Detection: The script computes pivot highs/lows using an adaptive strength mechanism, which scales dynamically based on ATR fluctuations. This ensures S/R levels are responsive to shifting volatility regimes, rather than being fixed or rigid.
> 2. Horizontal S/R Line Generation: Pivot highs form resistance zones (Red), while pivot lows map support zones (Green). Lines can be extended or set to expire after a fixed bar duration for clean charting.
> 3. SL Labeling (Structure-Based): Each S/R level is labeled with a corresponding “Sell SL” or “Buy SL”, computed using the extreme structure from the previous 10 bars. This provides a fast visual cue for risk management placement.
> 4. Proximity Highlighting: When price comes within a % threshold (user-defined) of any active S/R level, triangle markers appear—Red near Resistance, Green near Support. These cues reduce screen-watching and help time entries.
> 5. Trendline Projection from Pivot Pairs: Dashed trendlines connect the two most recent swing highs and swing lows respectively, offering additional structure awareness—perfect for spotting compression zones, flags, and swing breaks.
Configuration & Usage Guide:
> 🛠 Inputs You Can Adjust:
Base Swing Strength: Controls how "wide" the pivots are
ATR Sensitivity: Amplifies or softens the impact of volatility on pivot strength
Proximity %: Sets how close price must be to trigger the triangle markers
Extend Lines: Whether S/R lines extend infinitely right or expire after set bars
How to Use It:
Add to chart and configure settings to match your trading style (scalping = higher sensitivity).
Watch for price nearing plotted zones. Triangle markers appear when proximity criteria are met.
Use the SL labels below/above the zones to anchor stop placement relative to structure.
Observe dashed trendlines to define the current local range or trend structure.
Ideal For:
Scalpers wanting S/R zones with trigger cues
Swing traders needing volatility-adaptive structure
Manual traders seeking precise stop placement and trend context
Those who dislike repainting and want structure-driven logic

2-Year MA + Adjustable MA + Offset MidlineProvides a very accurate macro channel to gauge tops and bottoms for Bitcoin.

unprofitable stratThe indicator is a comprehensive trend-following indicator for TradingView. It's designed to identify and trade in the direction of the market's primary trend while using a dynamic, volatility-based system for exits. It filters out counter-trend noise and provides a clear visual dashboard of market conditions.
Core Trading Strategy
The indicator's logic is based on a two-part confirmation system to ensure trades are only taken in favorable conditions.
Master Trend Filter: The indicator first determines the "master trend" by checking if the price is above or below a long-term (200-period) Exponential Moving Average (EMA). It will only look for BUY signals when the price is above this EMA (in a master bullish trend) and only look for SELL signals when the price is below it. This prevents fighting the main market current.
Entry Trigger: Once the master trend is confirmed, the indicator doesn't enter immediately. It waits for a secondary confirmation: a breakout above a recent swing high (for a BUY) or a breakdown below a recent swing low. This ensures that short-term momentum has aligned with the long-term trend before a signal is generated.
Dynamic Exit Strategy
Exits are not based on a fixed target. Instead, the indicator uses a professional-grade ATR-based Trailing Stop Loss.
This "smart" stop loss automatically trails behind a profitable trade. It moves up to lock in gains during a BUY trade but never moves down.
The distance of the stop from the price is determined by the Average True Range (ATR), meaning it gives the trade more room to breathe in volatile markets and tightens up to protect profits in calm markets.
An "EXIT" signal appears on the chart when the price finally pulls back and hits this trailing stop line.
Visual Features on the Chart
The indicator provides several visual aids to make the trading process clear and intuitive.
Custom-Plotted Candles: The indicator draws its own candlesticks that are colored based on the trade status:
Blue: An active BUY trade is in progress.
Purple: An active SELL trade is in progress.
Gray: The indicator is flat with no active trade.
Signal Labels: Clear "BUY", "SELL", and "EXIT" labels are plotted directly on the chart at the moment they occur.
Trailing Stop Line: A bright orange line appears and follows the price during a trade, showing you the exact level of your trailing stop loss.
Multi-Timeframe Table: An optional dashboard in the top-right corner displays the master trend status ("Bullish" or "Bearish") on the 1m, 5m, 15m, 1-hour, and 4-hour timeframes simultaneously.
Trend Background: An optional feature allows you to color the entire chart background light blue or purple to match the master trend direction.

🚀 Kapsamlı Kripto Teknik Analizkta fib crt göstergesi crt bölgesi beyaz mum ile belirtilmiş fib seviyeleri otomatik yeniler

2-Year MA + Scaled + % OffsetGives you a reliable channel to gauge macro tops and bottoms for Bitcoin.

Super Stock Ranking v6 - Rank 1-100Overview:
This powerful indicator is designed to evaluate and rank all stocks across the entire market based on multi-timeframe price performance. It helps traders and investors quickly identify the strongest stocks—those consistently outperforming their peers over various cycles.
Key Features:

Volumatic Variable Index Dynamic Average [BigBeluga]Strong Buying Power Detector – Indicator Introduction This indicator is designed to identify stocks exhibiting strong buying pressure — a key characteristic of potential market leaders and super-performing stocks. By analyzing volume dynamics,

KY CO KHOEThis powerful custom indicator is designed to help traders identify potential super stocks—those with exceptional momentum, trend alignment, and breakout behavior. By combining multiple proven techniques into a single view, this tool gives you a data-driven edge in spotting high-probability trade setups.

GANN_0.09 setup📊 0.09% Zone Indicator for Nifty & BankNifty (Intraday)
This indicator is built specifically for intraday traders on NSE, focusing on Nifty and BankNifty. It identifies key price zones based on the market's first 5-minute candle (9:15–9:20 AM IST) to help traders catch early momentum or set directional bias for the day.
✅ What It Does:
Detects the 9:15–9:20 AM candle on Indian market time.
Plots a Buy Zone and Sell Zone by adjusting the close price of this candle by ±0.09%.
Optionally plots three target levels (TP1, TP2, TP3) above and below this zone using +0.18% extensions.
Levels are drawn only for the current day, keeping your chart clean and focused.
All lines extend forward for 60 bars, perfect for short-term setups.
⚙️ How It Works:
Accurate detection using timestamp("Asia/Kolkata") to isolate the 9:20 AM candle.
Lines are drawn only once per day and reset daily.
A checkbox allows you to toggle target levels on or off.
Works across all timeframes without cluttering the chart.
🧠 Use Cases:
Ideal for scalping or breakout trading right after market open.
Acts as an intraday bias tool:
Price above upper zone = strength.
Price below lower zone = weakness.
Can be used in manual trading or integrated with automated setups.
🌟 Why Traders Like It:
Tailored for Indian markets with accurate time handling.
Uses fixed percentage logic instead of lagging indicators.
No clutter, no distractions — just clean, actionable levels.
No external scripts or dependencies needed.

BB + Supertrend with One-Time 100 USD Half ExitUse these signals for 4 hour and above time frames. It shows an exit of 50% of your trade after 100 pip profit. This is best for crypto. For gold I would suggest exit half the position at 50 pips profit. You can then trail the rest of manage manually.
Works best with crypto and gold

SYRUP/ETH Alert MarkersTracks the values of SYRUP/ETH Ratio and supports creating an alert for the used defined high and low values.


Bollinger Bandwidth TrendflowThe Bollinger Bandwidth Trendflow is an experimental regime detection tool that analyzes the width of Bollinger Bands and combines it with the Adaptive Trend Flow (ATF), developed by QuantAlgo. The ATF has been integrated into this script exactly as originally published — all credit goes to QuantAlgo for this powerful contribution.
Features:
- Utilizes Bollinger Bandwidth (BBW) to assess volatility-driven momentum
- Adaptive Trend Flow (ATF) provides dynamic regime detection based on historical volatility
- Orange zones indicate trending phases
- Purple zones highlight mean-reverting environments
- Clean subpane plots for BBW and ATF, each toggleable and fully color-customizable
This indicator is particularly useful for traders looking to distinguish between explosive market moves and quiet consolidation — perfect for breakout or reversion-style setups.
I recommend using this script on the TOTAL CRYPTO Market Cap (1D) chart. The default settings represent the best values I could find quickly — feel free to tweak and explore them as you like.

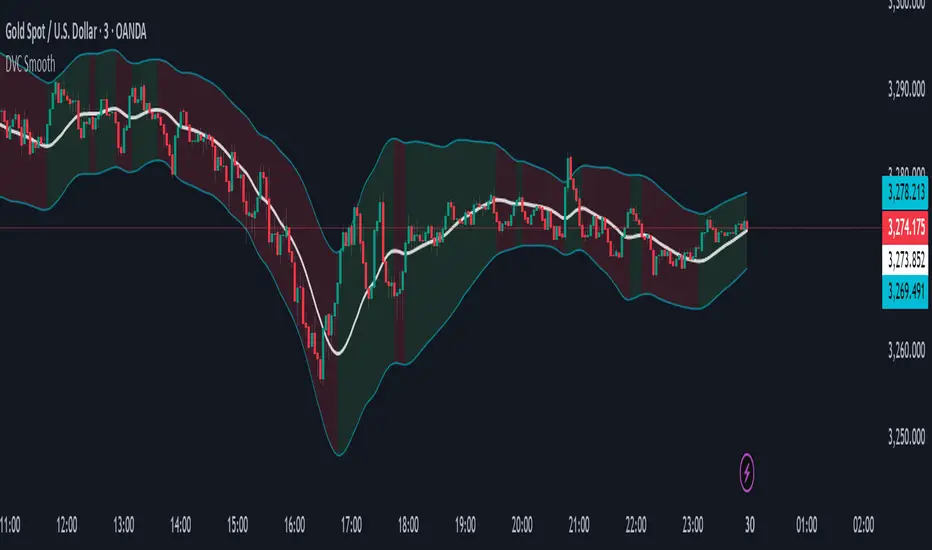
Dynamic Volatility Channel (DVC) - Smooth
The indicator's adaptability comes from a unique blend of well-known concepts:
The Adaptive Engine (ADX): The indicator uses the Average Directional Index (ADX) in the background to analyze the strength of the trend. This acts as the "brain", telling the channel whether the market is trending strongly or moving sideways.
Hybrid Volatility: This is the core of the indicator. The width of the channel is determined by a weighted mix of two volatility measures:
In trending markets (high ADX), the channel gives more weight to the Average True Range (ATR).
In ranging markets (low ADX), the channel gives more weight to Standard Deviation.
Smooth Centerline (HMA): The channel is centered around a Hull Moving Average (HMA), which is known for its smoothness and reduced lag compared to other moving averages.
Advanced Smoothing Layers: This version includes dedicated smoothing for both the volatility components (ATR and StDev) and the logic that switches between regimes. This ensures the channel expands, contracts, and adapts in a very fluid manner, eliminating sudden jumps and reducing market noise.
Mean Reversion: In ranging markets (indicated by a flatter channel), the outer bands can act as dynamic support and resistance levels. Look for opportunities to sell near the upper band and buy near the lower band, always waiting for price action confirmation like reversal candles.
Trend Following: In strong trends (indicated by a steeply sloped channel), the centerline (HMA) often serves as a dynamic level of support (in an uptrend) or resistance (in a downtrend). Pullbacks to the centerline can present opportunities to join the trend. A "band ride," where price action consistently pushes against the upper or lower band, signals a very strong trend.
Volatility Analysis: A "squeeze," where the bands come very close together, indicates low volatility and can foreshadow a significant price breakout. A sudden expansion of the bands signals an increase in volatility and the potential start of a new, powerful move.
All core parameters are fully customizable to suit your trading style and preferred assets:
You can adjust the lengths for the HMA, ATR, StDev, and the ADX filter.
You can change the multipliers for the ATR and Standard Deviation components.
Crucially, you can control the Volatility Smoothing Length and Logic Smoothing Length to find the perfect balance between responsiveness and smoothness.
Disclaimer: This indicator is provided for educational and analytical purposes only. It is not financial advice, and past performance is not indicative of future results. Always conduct your own research and backtesting before risking capital in a live market.