Dynamic Fibonacci Retracement with ConfirmationDynamic Fibonacci Retracement with Confirmation plus MFI CCI RSI MA MACD Candle stick pattern
Bands and Channels

Strateji Paneli + 4H FibonacciStrategy Features and Usage
Time Frames: Our strategy performs best when followed on 4-hour and 15-hour time frames. We recommend using it on Heikin Ashi candles in these time frames for more reliable signals.
Testing Phase: The strategy is currently in the testing phase, so caution is advised when making real trading decisions.
Panel Feature:
The panel displays position information. When the position is "LONG", the total average shows a "BUY" signal,
When the position is "SHORT", the total average shows a "SELL" signal.
Fibonacci Levels and Horizontal Lines:
The horizontal lines in the panel are manually adjusted according to Fibonacci levels.
Key levels used are: 0%, 23.6%, 38.2%, 50%, 61.8%, 78%, and 100%.
The 78% level is particularly significant as a support/resistance point in the strategy.
Usage Recommendation: When using the indicator, check the Fibonacci settings on the panel and track them together with the horizontal lines to improve performance.

S/D-QTECHSupply and Demand Level Indicator
The Supply and Demand Level Indicator is a dynamic market analysis tool designed to visualize potential turning points in price by identifying zones of hesitation and imbalance in the market. It aims to help traders better understand where buying or selling pressure may emerge, allowing for more informed trading decisions.
This indicator automatically detects and draws supply (resistance) and demand (support) levels based on price behavior. Specifically:
Supply Levels (Red Lines): These are drawn when the market shows hesitation or stalls during upward movement, indicating potential selling pressure. Once price moves above a supply level, that level is invalidated and the red line is removed.
Demand Levels (Blue Lines): These are formed when price hesitates or consolidates on the way down, suggesting possible buying interest. When the price drops below a demand level, it is considered broken, and the blue line is removed.
The concept is rooted in the idea that markets rarely move in straight lines. Price often pauses, pulls back, or consolidates, reflecting shifts in trader sentiment or institutional activity. This indicator captures those moments of hesitation and marks them as potential zones where future reactions might occur.
Dynamic Behavior and Market Character
The strength of this indicator lies in its adaptability. Markets change — sometimes they trend smoothly, and at other times they behave erratically. The levels generated by the indicator reflect this: in fast, smooth markets, fewer levels may be plotted, while in choppier conditions, more lines can appear, showing clusters of indecision.
These lines are not meant to be predictive with pinpoint accuracy, but rather as visual guides for where the market has previously shown hesitation. They can help you frame risk, manage trade entries, and avoid chasing price blindly.
A Note on Trader Psychology
While the indicator provides objective levels, your interpretation matters. Every trader operates on different timeframes, tolerates risk differently, and has unique decision-making styles. A level that holds significance for one trader might be noise to another. Always factor in your own strategy, discipline, and timing when using these tools.


Simplified Deviation Bands [TrendRidersTR]Simplified Deviation Bands
A clean and intuitive indicator to visualize dynamic price envelopes around a moving average.
It plots a customizable EMA and upper/lower bands at 1, 2, and 3 times the ATR above and below the EMA.
The EMA line dynamically changes color based on its slope, giving you an instant visual cue for trend direction or momentum.
How to Use
Best used in confluence with other Rider Algo tools to plan entries and improve your trading edge.
When price reaches an extreme deviation band (for example, +2 or +3 ATR), it suggests the price is extended and may eventually revert to the mean (EMA).
The EMA serves as a natural magnet and reference point for normalization.
Combine with the Rider Algo Volume Profile to check if deviation levels align with key volume nodes or liquidity zones.
Use together with Rider Algo Trend Support Lines: If price is at a high deviation and at a strong trendline/support, this increases the probability of reversal or pullback.
Look for confluence : the more signals from different indicators at the same level, the stronger the setup.
Typical Applications
Channel trading
Mean reversion setups
Volatility-based references for risk and trade management
Identifying exhaustion, reversal, or breakout points when combined with other tools
Pro Tip:
Deviation Bands are most powerful when they align with other context clues.
If price touches a +2 ATR band and the Rider Algo Volume Profile highlights a major volume shelf at the same level, this is a high-probability area for reversal or consolidation.
Note:
This indicator does not generate trade signals by itself.
It is designed to provide a clear visual context for your trading decisions—especially when used alongside other Rider Algo indicators.
Combine, confirm, and ride the trend with confidence!

VWAPADAindicator("VWAPADA", overlay=true) Crossing of the EMA 18 with the VWAP and the SMA 200 for the trend

ULTIMATE PENETRATORUser Guide
ULTIMATE PENETRATOR
(Order Blocks, Volatility Bands, Flip Triangles, Multi MA Overlay…)
General Overview
The ULTIMATE PENETRATOR is an advanced multi-tool indicator for TradingView that combines several powerful features for technical analysis:
Order Blocks and Breaker Blocks (institutional zones)
Bicolored Moving Averages (EMA and SMA)
Dynamic Volatility Bands based on ATR
SMA Flip Reversal Signals
Fully Customizable Visual Display (colors, signals, points, etc.)
Feature Breakdown

MTF Zones | مناطق الفريمات المتعددة✅ Indicator Overview: MTF Zones | Multi-Timeframe Zones
🔍 What does this indicator offer?
A comprehensive tool that displays the most important price zones from higher timeframes — Daily, Weekly, and Monthly — highlighting:
✅ High
✅ Low
✅ Midpoint (50% level)
For each of the previous time periods. This gives you a clear view of key:
Support / Resistance / Equilibrium zones
across multiple timeframes — dynamically plotted directly on your chart.
📊 Key Features:
Displays previous Day, Week, and Month levels with clean visual lines.
Optional labels to show exact level names and prices.
Projection lines to extend past levels into the future.
Includes multiple moving average types: EMA, SMA, WMA, etc.
Adds static price levels like 29 and 71 for strategic confluence.
Calculates Stop Loss and 3 Take Profit levels based on ATR.
Shows Buy/Sell signals visually using the AlphaTrend indicator.
Displays TP, SL, and buyer/seller strength in a clean, dynamic table.
Supports Order Blocks (Demand/Supply zones) based on structure and volume.
🎯 Who is this for?
Perfect for traders who use:
Multi-timeframe analysis
Smart support/resistance levels
Price action + indicator confluence
Scalping, intraday, or swing strategies
💡 Benefits:
Helps you spot strong potential reversal/reaction zones
Reduces chart noise by organizing market structure clearly
Automatically shows entry and exit points with logic-based visuals


tornado cash money 3User Manual for the “Tornado Cash Money ” Indicator
Summary
This indicator is designed to help you identify and trade only in the dominant trend, as defined by the 200-period exponential moving average (EMA 200). It integrates different moving averages and volatility bands to provide clear visual signals, provided you use it in the direction of the trend.
Indicator Components
Bicolor EMA 200
Role: Indicates the major market trend.
Interpretation:
Green: Bullish trend (only take buy trades).
Red: Bearish trend (only take sell trades).
Imperative Instruction:
ONLY TRADE IN THE DIRECTION OF THE EMA 200 COLOR.
If it is green, you only open long positions (buys).
If it is red, you only open short positions (sells).
Bicolor SMA 28
Used to detect shorter-term trend reversals (color changes between blue/orange).
Special Signals:
Blue/Teal Triangles ("S+") below the price: Potential buy signal (if EMA 200 is green).
Red/Brown Triangles ("S-") above the price: Potential sell signal (if EMA 200 is red).
Volatility Bands (EMA 21 + ATR 14)
Display bands around the EMA 21, adjusted to volatility (ATR * 2).
Help identify overbought/oversold zones or dynamic support/resistance levels.
Colored Dots
Blue dots below the band: Confirmation of bullish momentum if the SMA 28 is bullish.
Red dots above the band: Bearish momentum if the SMA 28 is bearish.
Usage Rules
Identify the trend with the EMA 200
If EMA 200 is green → Only look for buy (long) signals
If EMA 200 is red → Only look for sell (short) signals
Wait for a reversal signal on the SMA 28
A blue/teal “S+” triangle appears below the price:
Buy only if EMA 200 is green.
A red/brown “S-” triangle appears above the price:
Sell only if EMA 200 is red.
Confirm with the volatility bands and dots
Ideally, the price reacts to a band and/or a colored dot appears in the direction of the trade.
Avoid trading if the signal appears opposite to the EMA 200 trend, even if it is visible.
Risk Management
Always accompany your strategy with risk management suited to your profile (stop-loss, position sizing, etc.).
The bands can serve as indications for stop levels or partial targets.
Visual Summary
EMA 200 green → Only longs (favor “S+” signals and blue dots)
EMA 200 red → Only shorts (favor “S-” signals and red dots)
Never take trades against the color of the EMA 200.
Disclaimer
This indicator is not foolproof. It should be used as a decision support tool and not as a standalone trading system. Always validate your signals with broader analysis and practice on a demo account before using it for real trading.

Engineer_Invest Target SellEngineer_Invest Target Sell is a Simple and Affordable Tool for Exiting a Deal
Engineer_Invest Target Sell is an indicator that helps you quickly determine the best levels for profit taking. It is designed in such a way that it is easy for even a beginner to understand when it is worth selling an asset.
The way it works:
1. Two levels for sale:
The indicator calculates two key points (or lines) on the chart where it is beneficial to lock in profits. This helps you see where you can reduce your risk and lock in revenue.
2. Three modes for different market moods:
Depending on the market volatility, the setup is divided into three modes:
Target Sell 3 (High Volatility): for fast market movements.
Target Sell 2 (Average Volatility): for balanced conditions.
Target Sell 1 (Low Volatility): for quiet trading sessions.
This separation allows the indicator to be adapted to any market conditions.
Simple settings:
You can choose the type of moving average (SMA or EMA) and adjust the transparency and color of the labels so that the information on the chart is as clear and easy to understand as possible.
Ease of use:
Visibility:
The indicator draws lines and marks directly on the chart, which allows you to immediately see the key levels for exiting a trade.
Adaptability:
Three modes allow you to adjust to the current market conditions — from rapid dynamics to a calm trend.
Easy to use:
Minimal settings and intuitive visualization allow you to quickly learn how to use the tool and make informed decisions.


Super_Momentum_BandThe Super Momentum Band is a powerful multi-purpose indicator designed for scalpers & intraday. It combines the strength of an EMA Band with the reliability of Supertrend to help you catch momentum trades with clear visual cues.
Key Features:
✅ Dynamic EMA Band with colour-coded zones.
✅ Built-in Supertrend plotted directly on the chart.
✅ Helps to identify scalp opportunities & trend direction.
Ideal For:
🔸 Scalping setups on lower timeframes
🔸 Intraday trend confirmation
🔸 Breakout and retest trading
🔸 Quick visual identification of trend shifts

tornado cash money 3User Guide: Tornado Cash Money 3
General Description
This indicator is designed to help you track and trade with the market’s dominant trend, emphasizing the strength of the 200 EMA (Exponential Moving Average) — considered here as the true "boss" for all trading decisions.
It combines:
a dual-color 200 EMA (the boss),
a dual-color 28 SMA (for timing signals),
volatility bands,
colored visual buy/sell signals (triangles).
Key Points to Remember
Trend is your friend!
This system is designed to ONLY TRADE IN THE DIRECTION OF THE TREND.
Every decision should ALWAYS be filtered and validated according to the direction of the 200 EMA.
200 EMA = The Boss
If price is above the 200 EMA and the 200 EMA is rising: focus only on buy signals (upward triangles).
If price is below the 200 EMA and the 200 EMA is falling: focus only on sell signals (downward triangles).
Visual Interpretation
Dual-color 200 EMA:
Green: Long-term uptrend.
Red: Long-term downtrend.
Dual-color 28 SMA:
Blue: Short-term bullish correction or recovery.
Orange: Short-term bearish correction or pullback.
Teal triangles (below the candle):
Short-term buy signal.
Appears when the 28 SMA shifts from bearish to bullish.
Brown triangles (above the candle):
Short-term sell signal.
Appears when the 28 SMA shifts from bullish to bearish.
Volatility bands:
Dynamic zones showing the amplitude of price moves.
Blue/red dots:
Secondary indications based on the slope of the SMA.
How to Use the Signals
Identify the trend with the 200 EMA:
If it’s green AND sloping upward, you should ONLY look for buy signals (teal triangles below the candles).
If it’s red AND sloping downward, you should ONLY look for sell signals (brown triangles above the candles).
Use triangles for timing:
Triangles indicate a short-term momentum shift in the 28 SMA.
Never buy against the direction of the 200 EMA trend!
Ignore all signals that are against the 200 EMA trend (e.g., don’t sell if the 200 EMA is green).
Practical Tips
The 200 EMA protects you: It tells you which way the wind is blowing. Never trade against it—you’ll be swimming upstream.
Combine with your money management: These signals are powerful when taken in the trend’s direction, but no indicator is infallible! Always use stop-losses and adapt your position size.
Avoid ranges (sideways markets): The indicator works best in trending markets.
Summary
Trade ONLY in the direction of the 200 EMA: Trend is your friend!
Teal triangles: Buy opportunities if the 200 EMA is bullish.
Brown triangles: Sell opportunities if the 200 EMA is bearish.
Ignore all signals that go against the direction of the 200 EMA trend.

adanardelliindicator("adanardelli", overlay=true, max_bars_back=1000, max_labels_count=200, max_lines_count=200, max_boxes_count=200)

Catnobi Neon ThemeYour description is too short. Please tell your audience a little more about what you are posting. Meow.

King 3EMA Trader CryptoShorter EMA Periods: The 13/55/21-period EMAs are more responsive than the original 21/89/34, better capturing the rapid price movements in BTC and ETH markets.

BB VolatilityBB Volatility indicator is monitoring the famous Bollinger Bands volatility in a normalised manner.
Could not find anything similar so thought this would be useful.
For confirmation signals of the BB to move into one or another direction it is complemented with SMA and EMA.
Additionally, it is complemented with Min Level of BB line - a level user can define and decide to use or not for even stronger conviction for a potential BB expansion.
How to use?
As it monitors when the BB narrows, it helps to identify potential price breakout moments in one or another direction.
Users can adjust duration and Min Level inputs as per security they are interested.
For better visualisation purposes, the background is plotted light green when BB crosses both SMA and EMA upwards. And plotted light red when BB crosses both downwards. Users can also adjust the colors as per their preferences.
This indicator just helps to define potential BB expansion moments. No indicator alone is perfect and for most effective use needs to be complemented with overall market context and other chart patterns.

ORACULUM LABFX v1.1 A + tp/sl Adapitivo [com Confirmador]
This script is an independent confirmation module for primary signal strategies such as ORACULUM LABFX.
It applies a combination of advanced technical filters including candlestick patterns, market context (trend/reversal), volume, volatility, and indicators such as CCI, OBV, and VWAP.
The script returns a directional strength score (final_strength) between -3 and +3, which can be accessed via request.security() by any external script to validate buy/sell signals.
Used indicators:
CCI, ROC, ADX, OBV, VWAP, VWMA, RSI
Candlestick patterns: Engulfing, Marubozu, Piercing, Hammer, etc.
Market context via Hull, moving averages, and volatility (BB Width, ATR)
Main return variables:
final_strength → Positive = confirms buy, Negative = confirms sell
final_dir → Pure direction (1 = buy, -1 = sell)
✅ Recommended for use as a filter in signal validation setups.

Custom EMA 5 LinesThis is a Pine Script example for 5 EMAs where each EMA can have a customizable length, and each line is set to 1 pixel width:

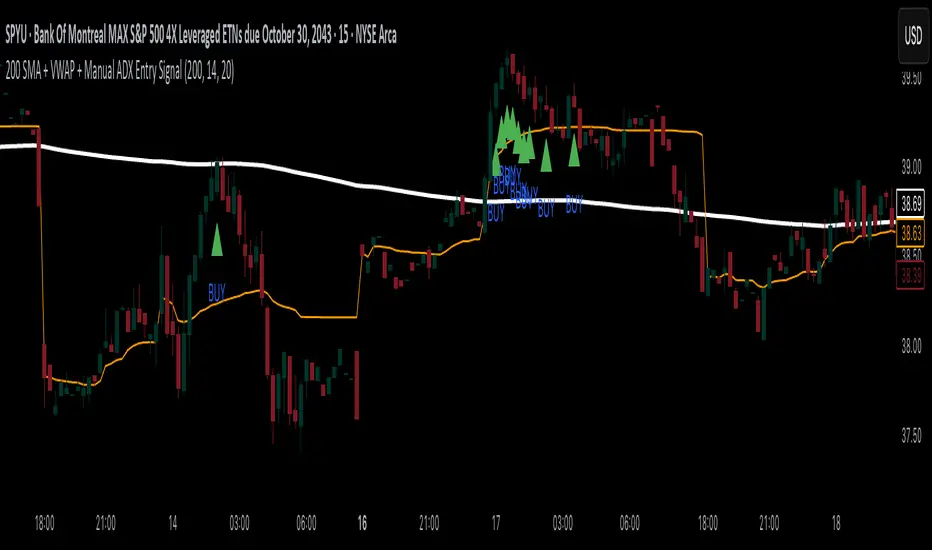
200 SMA + VWAP + Manual ADX Entry Signal200 SMA + VWAP + Manual ADX Entry Signal – Indicator Description
This custom indicator is designed for trend-following intraday traders who want a powerful, rules-based entry confirmation system. It combines three proven tools—the 200-period Simple Moving Average (SMA), Volume-Weighted Average Price (VWAP), and a manually coded ADX (Average Directional Index)—to identify high-probability long entries in strong, directional markets.
By filtering trades through a combination of trend direction, mean-reversion reference, and momentum strength, this indicator helps traders avoid false breakouts, whipsaws, and low-quality setups. It’s particularly well-suited for traders using 15-minute charts, leveraged ETFs, or high-beta stocks, where precision entries and trend confirmation are critical to consistent profitability.
⸻
✅ What This Indicator Does
This indicator visually displays:
• The 200-period SMA (orange line) – a long-term trend filter.
• The VWAP (blue line) – a dynamic intraday price average used by institutions.
• A buy signal triangle below the price bar – when all bullish criteria are met.
• It also includes an alert condition so traders can be notified when a new buy signal appears in real time.
Behind the scenes, the indicator calculates trend and strength conditions and plots a BUY signal only when all three tools agree that a bullish move is in play.
⸻
🔍 The Three-Pillar Entry System
1. 200 SMA Filter – Defining Market Bias
The 200 SMA is a widely used institutional benchmark that represents long-term trend direction. In this indicator:
• A trade is only considered valid if price is above the 200 SMA.
• This helps eliminate trades in downtrending or range-bound markets.
• It ensures that entries are aligned with broader directional bias.
By filtering out trades below the 200 SMA, you instantly remove a majority of low-probability setups and whipsaw environments.
⸻
2. VWAP – Institutional Mean Price Anchor
VWAP (Volume-Weighted Average Price) is often used by hedge funds and algorithmic systems to judge whether price is considered “expensive” or “cheap” within a given trading session.
• This version of VWAP is anchored to the current intraday session.
• Trades are only considered valid if price is above the VWAP, which shows market consensus is favoring the upside.
• VWAP provides both confirmation and support levels, helping ensure your entry isn’t into overextended territory.
By combining the 200 SMA and VWAP filters, the indicator ensures that trades are only taken when price is strong on both the macro and micro timeframes.
⸻
3. ADX – Confirming Momentum Strength
ADX (Average Directional Index) is used to measure trend strength without regard to direction. However, TradingView has limited functionality with the ta.adx() call in some environments, so this script includes a custom-coded version of ADX that follows standard Wilder’s smoothing and directional movement logic.
• A BUY signal only triggers if ADX is above a user-defined threshold (default is 20) and rising from the previous bar.
• This means not only is the market trending — but the trend is strengthening.
This final filter prevents entries in chop or decaying rallies, and ensures you’re catching the strongest part of a move, not the tail end.
⸻
⚙️ Logic Summary
A BUY signal is plotted when:
• Price > 200 SMA ✅
• Price > VWAP ✅
• ADX > 20 and rising ✅
Only when all three conditions are true does the indicator plot a green triangle below the price bar.
This visual simplicity makes it ideal for fast trade decisions, and the alert function allows hands-free monitoring during busy sessions.
⸻
🧠 Recommended Use
This indicator works best on:
• 15-minute to 1-hour charts
• Intraday leveraged ETFs (e.g., TQQQ, SPYU, SQQQ)
• Trend-following strategies
• Breakout continuation trades
⸻
📉 Limitations
• This is a long-only system by design. If you want to trade short, you’ll need to invert the logic (e.g., price < 200 SMA, price < VWAP, ADX > threshold).
• It doesn’t generate exit signals. You should pair this with your own take-profit or trailing stop strategy.
• While it works great for momentum entries, it may underperform in range-bound or news-driven chop markets.
⸻
🛠️ Settings Customization
• SMA Length: default is 200; adjust for faster or slower trend confirmation.
• ADX Length: default is 14; shorter periods = more sensitive, longer = smoother.
• ADX Threshold: default is 20; raise to 25 or 30 to only catch very strong moves.
These settings give you flexibility to match the indicator to your trading style.
⸻
🚀 Final Thoughts
The 200 SMA + VWAP + Manual ADX Entry Signal is a battle-tested, rule-based tool to help you:
• Enter only when the trend, mean, and momentum align
• Avoid fakeouts and poor risk-reward entries
• Automate part of your setup process without overcomplication
This is the kind of filter used by professional traders to reduce screen time and improve trade quality. If you’re looking to build confidence in your intraday trading with clear, logical entries — this indicator will help you stay consistent and systematic.
Happy trading!
Lidor Kalderon Trader - Custom Watermark + Smart PivotsLidor kalderon trader, ATR 14 days back average, stock ticker, market cap, PIVOT, and many other things in another thing
