tornado cash money 3User Guide: Tornado Cash Money 3
General Description
This indicator is designed to help you track and trade with the market’s dominant trend, emphasizing the strength of the 200 EMA (Exponential Moving Average) — considered here as the true "boss" for all trading decisions.
It combines:
a dual-color 200 EMA (the boss),
a dual-color 28 SMA (for timing signals),
volatility bands,
colored visual buy/sell signals (triangles).
Key Points to Remember
Trend is your friend!
This system is designed to ONLY TRADE IN THE DIRECTION OF THE TREND.
Every decision should ALWAYS be filtered and validated according to the direction of the 200 EMA.
200 EMA = The Boss
If price is above the 200 EMA and the 200 EMA is rising: focus only on buy signals (upward triangles).
If price is below the 200 EMA and the 200 EMA is falling: focus only on sell signals (downward triangles).
Visual Interpretation
Dual-color 200 EMA:
Green: Long-term uptrend.
Red: Long-term downtrend.
Dual-color 28 SMA:
Blue: Short-term bullish correction or recovery.
Orange: Short-term bearish correction or pullback.
Teal triangles (below the candle):
Short-term buy signal.
Appears when the 28 SMA shifts from bearish to bullish.
Brown triangles (above the candle):
Short-term sell signal.
Appears when the 28 SMA shifts from bullish to bearish.
Volatility bands:
Dynamic zones showing the amplitude of price moves.
Blue/red dots:
Secondary indications based on the slope of the SMA.
How to Use the Signals
Identify the trend with the 200 EMA:
If it’s green AND sloping upward, you should ONLY look for buy signals (teal triangles below the candles).
If it’s red AND sloping downward, you should ONLY look for sell signals (brown triangles above the candles).
Use triangles for timing:
Triangles indicate a short-term momentum shift in the 28 SMA.
Never buy against the direction of the 200 EMA trend!
Ignore all signals that are against the 200 EMA trend (e.g., don’t sell if the 200 EMA is green).
Practical Tips
The 200 EMA protects you: It tells you which way the wind is blowing. Never trade against it—you’ll be swimming upstream.
Combine with your money management: These signals are powerful when taken in the trend’s direction, but no indicator is infallible! Always use stop-losses and adapt your position size.
Avoid ranges (sideways markets): The indicator works best in trending markets.
Summary
Trade ONLY in the direction of the 200 EMA: Trend is your friend!
Teal triangles: Buy opportunities if the 200 EMA is bullish.
Brown triangles: Sell opportunities if the 200 EMA is bearish.
Ignore all signals that go against the direction of the 200 EMA trend.
Bands and Channels

adanardelliindicator("adanardelli", overlay=true, max_bars_back=1000, max_labels_count=200, max_lines_count=200, max_boxes_count=200)

Catnobi Neon ThemeYour description is too short. Please tell your audience a little more about what you are posting. Meow.

King 3EMA Trader CryptoShorter EMA Periods: The 13/55/21-period EMAs are more responsive than the original 21/89/34, better capturing the rapid price movements in BTC and ETH markets.

BB VolatilityBB Volatility indicator is monitoring the famous Bollinger Bands volatility in a normalised manner.
Could not find anything similar so thought this would be useful.
For confirmation signals of the BB to move into one or another direction it is complemented with SMA and EMA.
Additionally, it is complemented with Min Level of BB line - a level user can define and decide to use or not for even stronger conviction for a potential BB expansion.
How to use?
As it monitors when the BB narrows, it helps to identify potential price breakout moments in one or another direction.
Users can adjust duration and Min Level inputs as per security they are interested.
For better visualisation purposes, the background is plotted light green when BB crosses both SMA and EMA upwards. And plotted light red when BB crosses both downwards. Users can also adjust the colors as per their preferences.
This indicator just helps to define potential BB expansion moments. No indicator alone is perfect and for most effective use needs to be complemented with overall market context and other chart patterns.

ORACULUM LABFX v1.1 A + tp/sl Adapitivo [com Confirmador]
This script is an independent confirmation module for primary signal strategies such as ORACULUM LABFX.
It applies a combination of advanced technical filters including candlestick patterns, market context (trend/reversal), volume, volatility, and indicators such as CCI, OBV, and VWAP.
The script returns a directional strength score (final_strength) between -3 and +3, which can be accessed via request.security() by any external script to validate buy/sell signals.
Used indicators:
CCI, ROC, ADX, OBV, VWAP, VWMA, RSI
Candlestick patterns: Engulfing, Marubozu, Piercing, Hammer, etc.
Market context via Hull, moving averages, and volatility (BB Width, ATR)
Main return variables:
final_strength → Positive = confirms buy, Negative = confirms sell
final_dir → Pure direction (1 = buy, -1 = sell)
✅ Recommended for use as a filter in signal validation setups.

Custom EMA 5 LinesThis is a Pine Script example for 5 EMAs where each EMA can have a customizable length, and each line is set to 1 pixel width:

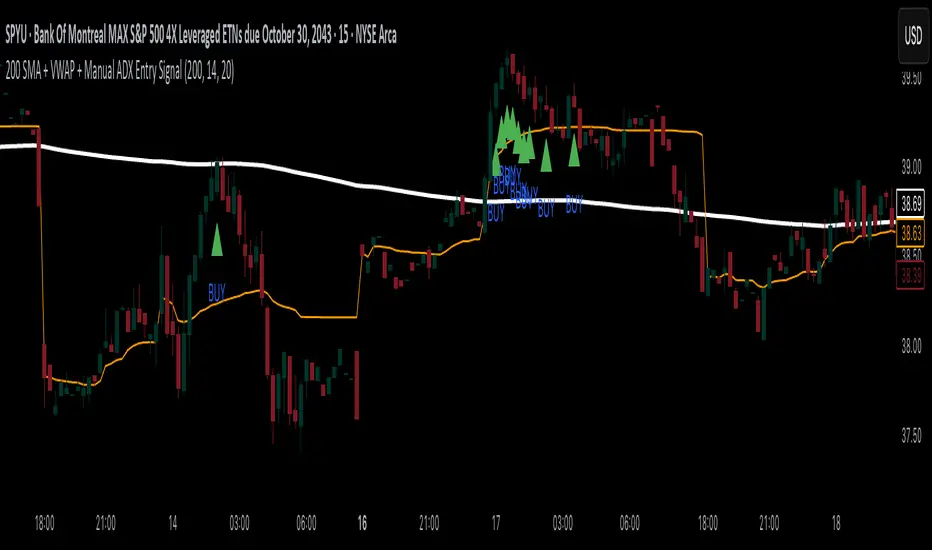
200 SMA + VWAP + Manual ADX Entry Signal200 SMA + VWAP + Manual ADX Entry Signal – Indicator Description
This custom indicator is designed for trend-following intraday traders who want a powerful, rules-based entry confirmation system. It combines three proven tools—the 200-period Simple Moving Average (SMA), Volume-Weighted Average Price (VWAP), and a manually coded ADX (Average Directional Index)—to identify high-probability long entries in strong, directional markets.
By filtering trades through a combination of trend direction, mean-reversion reference, and momentum strength, this indicator helps traders avoid false breakouts, whipsaws, and low-quality setups. It’s particularly well-suited for traders using 15-minute charts, leveraged ETFs, or high-beta stocks, where precision entries and trend confirmation are critical to consistent profitability.
⸻
✅ What This Indicator Does
This indicator visually displays:
• The 200-period SMA (orange line) – a long-term trend filter.
• The VWAP (blue line) – a dynamic intraday price average used by institutions.
• A buy signal triangle below the price bar – when all bullish criteria are met.
• It also includes an alert condition so traders can be notified when a new buy signal appears in real time.
Behind the scenes, the indicator calculates trend and strength conditions and plots a BUY signal only when all three tools agree that a bullish move is in play.
⸻
🔍 The Three-Pillar Entry System
1. 200 SMA Filter – Defining Market Bias
The 200 SMA is a widely used institutional benchmark that represents long-term trend direction. In this indicator:
• A trade is only considered valid if price is above the 200 SMA.
• This helps eliminate trades in downtrending or range-bound markets.
• It ensures that entries are aligned with broader directional bias.
By filtering out trades below the 200 SMA, you instantly remove a majority of low-probability setups and whipsaw environments.
⸻
2. VWAP – Institutional Mean Price Anchor
VWAP (Volume-Weighted Average Price) is often used by hedge funds and algorithmic systems to judge whether price is considered “expensive” or “cheap” within a given trading session.
• This version of VWAP is anchored to the current intraday session.
• Trades are only considered valid if price is above the VWAP, which shows market consensus is favoring the upside.
• VWAP provides both confirmation and support levels, helping ensure your entry isn’t into overextended territory.
By combining the 200 SMA and VWAP filters, the indicator ensures that trades are only taken when price is strong on both the macro and micro timeframes.
⸻
3. ADX – Confirming Momentum Strength
ADX (Average Directional Index) is used to measure trend strength without regard to direction. However, TradingView has limited functionality with the ta.adx() call in some environments, so this script includes a custom-coded version of ADX that follows standard Wilder’s smoothing and directional movement logic.
• A BUY signal only triggers if ADX is above a user-defined threshold (default is 20) and rising from the previous bar.
• This means not only is the market trending — but the trend is strengthening.
This final filter prevents entries in chop or decaying rallies, and ensures you’re catching the strongest part of a move, not the tail end.
⸻
⚙️ Logic Summary
A BUY signal is plotted when:
• Price > 200 SMA ✅
• Price > VWAP ✅
• ADX > 20 and rising ✅
Only when all three conditions are true does the indicator plot a green triangle below the price bar.
This visual simplicity makes it ideal for fast trade decisions, and the alert function allows hands-free monitoring during busy sessions.
⸻
🧠 Recommended Use
This indicator works best on:
• 15-minute to 1-hour charts
• Intraday leveraged ETFs (e.g., TQQQ, SPYU, SQQQ)
• Trend-following strategies
• Breakout continuation trades
⸻
📉 Limitations
• This is a long-only system by design. If you want to trade short, you’ll need to invert the logic (e.g., price < 200 SMA, price < VWAP, ADX > threshold).
• It doesn’t generate exit signals. You should pair this with your own take-profit or trailing stop strategy.
• While it works great for momentum entries, it may underperform in range-bound or news-driven chop markets.
⸻
🛠️ Settings Customization
• SMA Length: default is 200; adjust for faster or slower trend confirmation.
• ADX Length: default is 14; shorter periods = more sensitive, longer = smoother.
• ADX Threshold: default is 20; raise to 25 or 30 to only catch very strong moves.
These settings give you flexibility to match the indicator to your trading style.
⸻
🚀 Final Thoughts
The 200 SMA + VWAP + Manual ADX Entry Signal is a battle-tested, rule-based tool to help you:
• Enter only when the trend, mean, and momentum align
• Avoid fakeouts and poor risk-reward entries
• Automate part of your setup process without overcomplication
This is the kind of filter used by professional traders to reduce screen time and improve trade quality. If you’re looking to build confidence in your intraday trading with clear, logical entries — this indicator will help you stay consistent and systematic.
Happy trading!
Lidor Kalderon Trader - Custom Watermark + Smart PivotsLidor kalderon trader, ATR 14 days back average, stock ticker, market cap, PIVOT, and many other things in another thing

Moving Average RibbonShowing Multiple Moving Averages (5 MAs) in one 1 indicator. Very useful if you're still using free version of Trading View

Moving Average RibbonShowing Multiple Moving Averages (5 MAs) in one 1 indicator. Very useful if you're still using free version of Trading View

Historical Volatility with HV Average & High/Low Trendlines
### 📊 **Indicator Title**: Historical Volatility with HV Average & High/Low Trendlines
**Version**: Pine Script v5
**Purpose**:
This script visualizes market volatility using **Historical Volatility (HV)** and enhances analysis by:
* Showing a **moving average** of HV to identify volatility trends.
* Marking **high and low trendlines** to highlight extremes in volatility over a selected period.
---
### 🔧 **Inputs**:
1. **HV Length (`length`)**:
Controls how many bars are used to calculate Historical Volatility.
*(Default: 10)*
2. **Average Length (`avgLength`)**:
Number of bars used for calculating the moving average of HV.
*(Default: 20)*
3. **Trendline Lookback Period (`trendLookback`)**:
Number of bars to look back for calculating the highest and lowest values of HV.
*(Default: 100)*
---
### 📈 **Core Calculations**:
1. **Historical Volatility (`hv`)**:
$$
HV = 100 \times \text{stdev}\left(\ln\left(\frac{\text{close}}{\text{close} }\right), \text{length}\right) \times \sqrt{\frac{365}{\text{period}}}
$$
* Measures how much the stock price fluctuates.
* Adjusts annualization factor depending on whether it's intraday or daily.
2. **HV Moving Average (`hvAvg`)**:
A simple moving average (SMA) of HV over the selected `avgLength`.
3. **HV High & Low Trendlines**:
* `hvHigh`: Highest HV value over the last `trendLookback` bars.
* `hvLow`: Lowest HV value over the last `trendLookback` bars.
---
### 🖍️ **Visual Plots**:
* 🔵 **HV**: Blue line showing raw Historical Volatility.
* 🔴 **HV Average**: Red line (thicker) indicating smoothed HV trend.
* 🟢 **HV High**: Green horizontal line marking volatility peaks.
* 🟠 **HV Low**: Orange horizontal line marking volatility lows.
---
### ✅ **Usage**:
* **High HV**: Indicates increased risk or potential breakout conditions.
* **Low HV**: Suggests consolidation or calm markets.
* **Cross of HV above Average**: May signal rising volatility (e.g., before breakout).
* **Touching High/Low Levels**: Helps identify volatility extremes and possible reversal zones.


High & Low SessionsHigh und Low von drei variablen Sessions rechts neben dem aktuellen Preis darstellen


CM_Williams_Vix_Fix v5The Kompas Volatility Signal (KVS) is a smart volatility-based indicator powered by the Williams Vix Fix (WVF) method. It’s designed to detect moments of heightened market fear or extreme price compression — often signaling potential reversal zones or deep pullbacks.
Key Features:
⚡️ Histogram spikes that react to price capitulation
📈 Optional Bollinger Bands and percentile thresholds for filtering extremes
🔄 Dual EMA smoothing (WVF EMA 10 & 50) to track volatility momentum
🛠️ Flexible settings for advanced traders to adjust sensitivity
How to Use: Use KVS to identify volatility spikes that align with oversold conditions or after major downswings. When paired with other momentum tools (like RSI or MACD), it becomes a powerful signal for early trend reversals or accumulation zones.


TR37The 377-day EMA is a long-term trend indicator, giving more weight to recent prices compared to an SMA. Traders may use it to:
Identify long-term trends (e.g., price above EMA = bullish, below = bearish).
Spot potential support/resistance levels.
Confirm trend direction for swing or position trading.

Squeeze & Breakout Confirmation StrategyThis strategy focuses on identifying periods of low volatility (Bollinger Band Squeeze) and then confirming the direction of the subsequent breakout with momentum, volume, and candle strength.
Concepts Applied: Bollinger Bands (Squeeze), RSI (Momentum), Market Volume (Conviction), Candle Size (Strength)
Buy Signal:
Bollinger Band Squeeze: Look for a period where the Bollinger Bands contract significantly, indicating low volatility and consolidation. The bands should be very close to the price action.
RSI Breakout: After the squeeze, wait for the price to break decisively above the upper Bollinger Band. Simultaneously, the RSI should break above 60 (or even 70), indicating strong bullish momentum.
Volume Surge: The breakout candle should be accompanied by a significant increase in trading volume, ideally above its recent average, confirming strong buying interest.
Strong Bullish Candle: The breakout candle itself should be a large, bullish candle (e.g., a strong green candle with a small upper wick or a bullish engulfing pattern), demonstrating buyer conviction.
Sell Signal (Short):
Bollinger Band Squeeze: Look for a period where the Bollinger Bands contract significantly.
RSI Breakdown: After the squeeze, wait for the price to break decisively below the lower Bollinger Band. Simultaneously, the RSI should break below 40 (or even 30), indicating strong bearish momentum.
Volume Surge: The breakdown candle should be accompanied by a significant increase in trading volume, ideally above its recent average, confirming strong selling interest.
Strong Bearish Candle: The breakdown candle itself should be a large, bearish candle (e.g., a strong red candle with a small lower wick or a bearish engulfing pattern), demonstrating seller conviction.

Poprzedni Dzień – Box 5M + gruba środkowa liniaThe script draws a box which has bottom at the low of the previous trading day and high at the top of the previous trading day.

Advanced VWAP (Webull-style + Bands + Anchor)//@version=6
//© 2025 YourNameHere (optional)
//This script plots an advanced VWAP with optional bands and anchoring
/*
────────────────────────────────────────────────────────────
🔹 Advanced VWAP (Webull-style + Bands + Anchor)
────────────────────────────────────────────────────────────
This indicator replicates Webull-style VWAP behavior by:
• Calculating VWAP during only regular trading hours (9:30 AM – 4:00 PM ET)
• Optionally including pre-market and post-market sessions
• Supporting VWAP bands at ±1σ and ±2σ for volatility analysis
• Optional anchor feature to start VWAP from a custom price level
────────────────────────────────────────────────────────────
📌 Features:
────────────────────────────────────────────────────────────
✅ VWAP calculated using (High + Low + Close) / 3
✅ Optional inclusion of extended hours
✅ Toggleable ±1σ and ±2σ bands (standard deviation)
✅ Anchor VWAP to any price breakout (e.g., yesterday's high)
────────────────────────────────────────────────────────────
🛠 How to Use:
────────────────────────────────────────────────────────────
1. Toggle "Include Extended Hours" to match your broker (like Webull).
2. Use anchor mode to begin VWAP when price crosses a key level.
3. Use bands to identify overbought/oversold zones.
4. Combine with price action for momentum/bounce trades.
────────────────────────────────────────────────────────────
🔔 Tips:
────────────────────────────────────────────────────────────
• Use this VWAP on 1m–15m charts for intraday momentum.
• Set anchor to a specific price like previous day open/high/low.
• Bands are useful for scalping and mean-reversion entries.
────────────────────────────────────────────────────────────
📧 Created by: Adebola| © 2025
────────────────────────────────────────────────────────────
*/

Rainbow Price Chart This indicator is a technical and on-chain analysis tool for Bitcoin, designed to help investors better understand the different phases of the market cycle and underlying sentiment. It directly overlays on the price chart (overlay=true).
Indicator Name: "Rainbow Price Chart & V/T Ratio Signals"
General Purpose:
It combines two popular methodologies for visualizing Bitcoin's value and sentiment: the classic "Rainbow Price Chart" and signals derived from the "Value per Transaction Ratio" (V/T Ratio) based on blockchain data. It is ideal for long-term investors looking for strategic entry/exit points.
Main Components:
Rainbow Price Chart:
Concept: Divides Bitcoin's price range into different market "sentiment zones" (e.g., "Bubble Zone," "FOMO Zone," "HODL Zone," "Accumulation Zone," "Buy Zone," "Fire Sale Zone") using colored bands. These bands are calculated as ascending and descending multiples of a base Exponential Moving Average (EMA), configurable by default to 200 periods.
Visualization: The zones are represented with transparent color fills on the price chart. A detailed legend in the top right corner of the chart explains the meaning of each color and sentiment zone.
Important Note: This type of chart is designed to be viewed and analyzed correctly on a logarithmic price scale. The indicator includes a visual reminder to activate this scale.
Value per Transaction (V/T) Ratio Signals:
Concept: Measures the average value per transaction on the Bitcoin blockchain by dividing the total transacted volume in USD by the number of transactions. This ratio is smoothed with an Exponential Moving Average (by default, 7 periods) and is framed within a dynamic Linear Regression Channel (LRC) based on standard deviation.
Signal Generation: Based on the position of the smoothed V/T Ratio within this LRC channel, the indicator generates signals directly on the price chart, such as:
"BOTTOM": Low price, V/T Ratio in the lower band of the LRC.
"SEMI-LOW" / "SEMI-HIGH": Intermediate phases within the channel.
"ATH" (All-Time High): Potentially overvalued price, V/T Ratio in the upper band of the LRC.
On-Chain Data: The indicator requests external daily on-chain data for total transacted volume (TVTVR) and number of transactions (NTRAN) from the Bitcoin blockchain.
Diagnostic Panes: Includes plots of the raw on-chain data (volume and number of transactions) in a separate pane, which are useful for debugging or verifying the data source. The lines for the V/T Ratio itself and its LRC channel are not plotted by default but can be activated in the code for deeper analysis.
Ideal for:
Bitcoin investors and "hodlers" who desire a visual tool that combines price-based market cycle context with fundamental signals derived from on-chain activity, to help identify key moments for accumulation or potential distribution.
Considerations:
Relies on the availability of external on-chain data (QUANDL:BCHAIN) within TradingView.
Functions best on a daily timeframe.
