DMI RSI AO 3 indicators in 1 overlayThis is simple indicators that plot 3 indicators DMI, RSI and AO on 1 pane
How to use: you can add on your chart and edit color and display in setting page of indicators
The directional movement index (DMI) is an indicator developed by J. Welles Wilder in 1978 that identifies in which direction the price of an asset is moving. The indicator does this by comparing prior highs and lows and drawing two lines: a positive directional movement line (+DI) and a negative directional movement line (-DI). An optional third line, called the average directional index (ADX), can also be used to gauge the strength of the uptrend or downtrend.
When +DI is above -DI, there is more upward pressure than downward pressure in the price. Conversely, if -DI is above +DI, then there is more downward pressure on the price. This indicator may help traders assess the trend direction. Crossovers between the lines are also sometimes used as trade signals to buy or sell.
The relative strength index (RSI) is a momentum indicator used in technical analysis that measures the magnitude of recent price changes to evaluate overbought or oversold conditions in the price of a stock or other asset. The RSI is displayed as an oscillator (a line graph that moves between two extremes) and can have a reading from 0 to 100. The indicator was originally developed by J. Welles Wilder Jr. and introduced in his seminal 1978 book, “New Concepts in Technical Trading Systems.”1
Traditional interpretation and usage of the RSI are that values of 70 or above indicate that a security is becoming overbought or overvalued and may be primed for a trend reversal or corrective pullback in price. An RSI reading of 30 or below indicates an oversold or undervalued condition.
Awesome Oscillator is developed by famous technical analyst and charting enthusiast Bill Williams. Awesome Oscillator (AO) is an indicator that is non-limiting oscillator, providing insight into the weakness or the strength of a stock. The Awesome Oscillator is used to measure market momentum and to affirm trends or to anticipate possible reversals. It does this by effectively comparing the recent market momentum, with the general momentum over a wider frame of reference.
Bill Williams Indicators

Haos Visual Divergence + Volume Analysis█ OVERVIEW
The Haos Visual Oscillators is a trend indicator that combines two William % indicators with different periods , to show Over Sold and Over Bought signals.
I have added Divergences and a volume indicator to check if buying or selling pressure is exhausted or showing divergences
this can help spot trend reversals
code taken from:
www.prorealcode.com
█ DESCRIPTION
Divergences:
• checks up to 20 pivot points to look for Divergences
• Divergences require single candle confirmation
• Divergences are only confirmed if oscillator pivot is of close proximity of a price pivot
Volume Indicator:
• checks for volume divergences or exhaustion
This is done by comparing relative change in price to the relative change in volume when oscillator is at over bought or over sold levels
indicator Columns:
• Yellow => divergence has been spotted
• Dim Yellow => divergence was spotted on the previous candle
• Blue => volume exhaustion was spotted
• Dim Blue => volume exhaustion was spotted on the previous candle
• Green => OverSold
• Red => OverBought
OB/OS:
• OverBough t => above 30
• OverSold => below -30
Alerts:
• Regular Bullish Divs
• Hidden Bullish Divs
• Regular Bearish Divs
• Hidden Bearish Divs
- if you realized that I posted 2 versions of the indicator :
• its because I named the first version wrongly on the publishing name and cant change it

Haus Visual Divergence + Volume Analysis█ OVERVIEW
The Haos Visual Oscillators is a trend indicator that combines two William % indicators with different periods , to show Over Sold and Over Bought signals.
I have added Divergences and a volume indicator to check if buying or selling pressure is exhausted or showing divergences
this can help spot trend reversals
code taken from:
www.prorealcode.com
█ DESCRIPTION
Divergences:
• checks up to 20 pivot points to look for Divergences
• Divergences require single candle confirmation
• Divergences are only confirmed if oscillator pivot is of close proximity of a price pivot
Volume Indicator:
• checks for volume divergences or exhaustion
This is done by comparing relative change in price to the relative change in volume when oscillator is at over bought or over sold levels
indicator Columns:
• Yellow => divergence has been spotted
• Dim Yellow => divergence was spotted on the previous candle
• Blue => volume exhaustion was spotted
• Dim Blue => volume exhaustion was spotted on the previous candle
• Green => OverSold
• Red => OverBought
OB/OS:
• OverBought => above 30
• OverSold => below -30
Alerts:
• Regular Bullish Divs
• Hidden Bullish Divs
• Regular Bearish Divs
• Hidden Bearish Divs


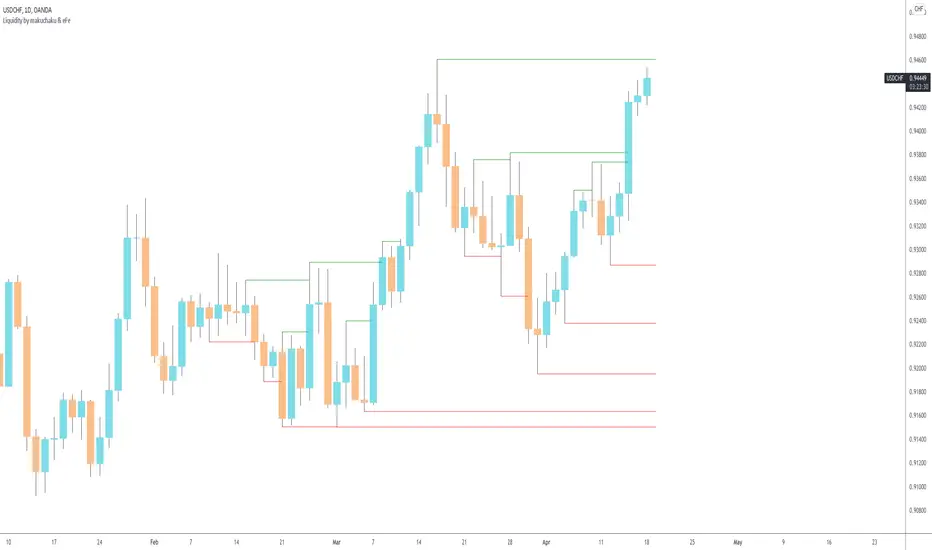
Makuchaku's trading tools - Liquidity visualizerThis indicator plots those pivots/fractals which have not been taken out by price, whereby showing where are the clusters of highs/lows where stop orders (or liquidity) could be hiding.
This is a fantastic tool for taking reversal trades.
RSI Failure Swings & AO DivergencesHello!
The script identifies RSI divergences, similar to other public scripts; however, RSI failure swings are also distinguished. When a failure swing is identified, the script calculates the highest RSI measurement (bottom failure swing) or the lowest RSI measurement (top failure swing) between the two RSI pivot points. A continually updating line is plotted at the "fail point" until it is penetrated for two sessions! In addition, the script displays the RSI fail point measurement. RSI bearish divergences are only distinguished when both RSI peaks form above 70. bullish divergences are only distinguished when both RSI troughs form below 30. Top failure swings require the initial RSI peak be above 70, the second RSI peak can form at any measurement. Bottom failure swings require the initial RSI trough be below 30, the second RSI trough can form at any measurement.
Included are Awesome Oscillator divergences. The indicator is a bit tricky; the oscillator does not incorporate an upper or lower extremity. Consequently, the script uses interpolated percentiles to characterize relatively high measurements and relatively low measurements. Bearish divergences that form within the 90th - 99th percentile are distinguished, and bullish divergences that form within the 1 - 10th percentile are distinguished. This can CERTAINLY be changed should you copy the source code and think of something better! For AO, white columns reflect a difference measurement >= 0; black bars reflect a difference measurement < 0

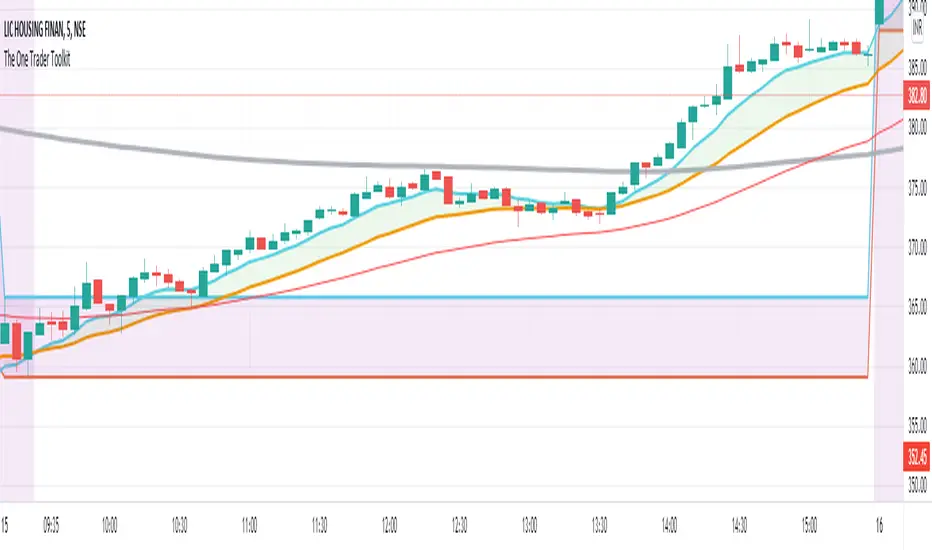
The One Trader Toolkit - Open AccessThis script is the open version of my existing invite-only script of the same name and has been opened for access to the community to use, but not modify or clone in any way.
This has been done as the invite-only script cannot be changed back to a public script and vice-versa, keeping in line with Tradingview House Rules.
The code is based on a full strategy that has been explained in detail as follows:
// Step 1:
// We will consider the 200ema a standard to assess the average price over the longer term.
// If the current price on the daily chart is seen above the 200ema, we will consider that the stock is in a long term uptrend.
// If the current price on the daily chart is seen below the 200ema, we will consider that the stock is in a long term downtrend.
// In order to assess the long term trend, a band is plotted between the CLOSE (Average price), HIGH (Average High Price), LOW (Average Low Price) of the last 200 days.
// This band has been color coded for easy visual recognition. Green fill between ema close and ema high. Red fill between ema close and ema low.
// The methodology explains that the trader should have a long bias when the price is above the green part of the band and a short bias while price is below the red part of the band.
// Step 2:
// Now we come to a lower timeframe analysis with the 200ema moving average on the hourly timeframe.
// This is marked by a very distinct solid blue line which cannot be missed.
// If the price is still above this moving average and correlates with the higher timeframe trend in step 1, then we will continue our analysis.
// Otherwise, the stock is not ready to be filtered down and we will move to another stock.
// Step 3:
// On the same hourly timeframe, we will continue further analysing the position of a red 50ema line as compared to the same blue 200ema line or a separetely plotted gray 200ema line.
// If the 50ema is above the blue or the gray 200ema line (and in correlation with trend in steps 1-3), then the stock is believed to be bullish.
// If the 50ema is below the blue or the gray 200ema line (and in correlation with trend in steps 1-3), then the stock is believed to be bearish.
// Step 4:
// After multiple confirmation of a continuing trend, we will try to ascertain a good entry point.
// On the one hour timeframe, we will apply the Phase Changer.
// Phase Changer configuration is derived from a common setup which includes the 8ema and 20ema lines.
// I have implemented it in the Indian stock market setup with an added theory that we ignore the Phase Changer position on any timeframe higher than hourly timeframe.
// So the Phase Changer is not only an indication of the continuing trend, but also a great indicator of what the price is trying to achieve through its interaction with the lines.
// If 8ema is above the 20ema on the hourly chart, then the stock is believed to be bullish.
// If 8ema is below the 20ema on the hourly chart, then the stock is believed to be bearish.
// The same will be done on 15 minutes timeframe.
// In either setup, if there is a pullback and price is touching any of the two ema lines and eventually gets rejected towards the continuing trend, then it is an indication of a good entry at the failure of the pullback.
// Step 5:
// After confirmation through Daily, Hourly and 15 minutes timeframes, we will now come to the execution (5 Minute) timeframe.
// Apply the breakfast range. This is the range formed during the first hour of trading.
// The high of the first hour and the low of the first hour form the breakfast breakout.
// This method is also widely known as Open Range Breakout (ORB).
// The breakfast range is commonly used for stock indices only on a Monday morning, we use it for all days of the week and mostly on stocks.
// If the breakout is consistent with the trend that we have been confirming since step 1, we will enter the trade.
// Step 6:
// An additional daily range has been plotted for those who would like to trade the breakout of the daily range.
// This is the sum of the open price of the day the range of the previous day.
// The green line is used as resistance and the red line is used as support.
// Any breakout of those lines will be considered a strong continuation of the trend, mostly until the end of the trading session.
// Miscellaneous
// The first hour of the trading day is marked yellow with a black solid bar marked at the end of the first hour.
// All trades will be taken only after 10:20am.
// Stoploss Settings
// We will be calculating stoploss with the help of the ATR values.
// I have defined two stop loss levels, one for safe traders and the other for aggressive traders.
// Safe traders will select the safe option in a long trade or short trade respectively and mark the stoploss indicated at the time of taking the breakout entry.
// Aggressive traders on the other hand will select the aggressive stop loss option in long or short trades respectively and mark the stoploss indicated at the time of taking the breakout entry.
Сatching knivesThis strategy is based on the regression line and volume
The Linear Regression Channel is a three-line technical indicator that displays the high, low and midpoint of the current trend.
How does it work in strategy?
If there is a deviation by a given percentage, the entry occurs
//LOGIC ENTRY
-Length-сhannel length
-Deviation-deviation of the boundaries, the higher , the rarer the entries
-% low for regression-deviation directly from the boundaries, the higher the number, the less frequent the entries
-Required % down bar-additional condition for entry (the candle on which the entry takes place from the logic must necessarily fall by a given percentage)
-Volume-the volume, which must be larger by the number of times you specify ( you can set the volume lower, but for better entries, you need to set the deviation percentages higher!)
//EXIT SETTING
Take profit and stop loss when a certain percentage is reached
//SETTINGS NEXT ENTRY AND GRID
Allow signal lower than,% - the next entry into a trade from logic occurs only when a decrease by a certain percentage
Allow grid,% - when the price drops by the percentage specified in the settings, the entry will take place, but only on the next bar.
//DATA RANGE
-Testing results for any period of time
//
Default settings for infrequent but relatively accurate entries for TF 1 hour.
It costs pyramiding 5 and take profit 5%. Choose the flavors of your choice!
Good luck!

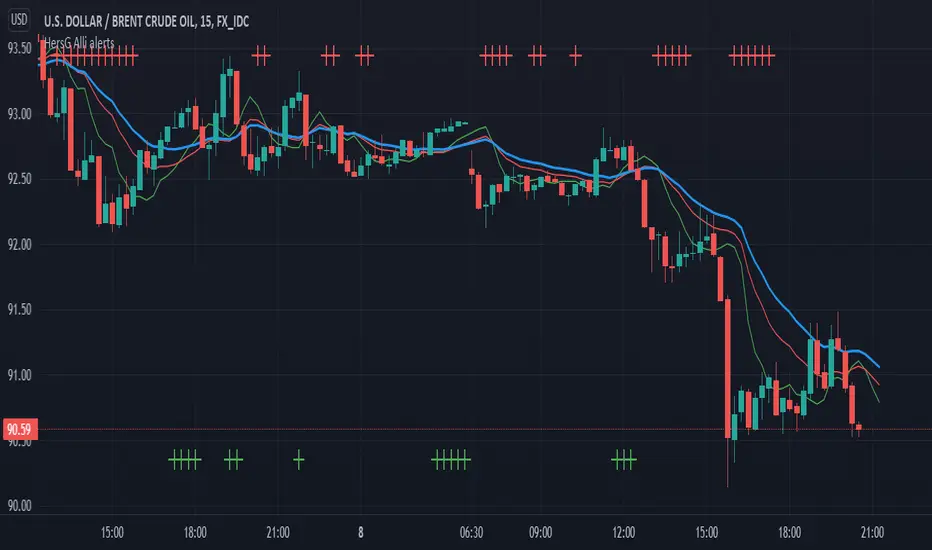
Alligator: Three signals confirmation with AlertsHello Trading Viewers,
The following is the William’s Alligator indicator with alerts indicating strong momentum, it can be used for scalping in lower time-frames or just riding the momentum in 1hr or 4hrs charts.
Input choices are:
1. Source of Data: Open, Low, High, Close, HL2, HLC3 and so on.
2. Simple and Exponential are the two choices of moving averages.
3. Lips, Teeth and Jaws input numbers are Fibonacci numbers with offsets from -4 to +4.
4. Up Momentum and Down Momentum signals will be plotted top and bottom of the charts respectively when conditions are met.
Idea used to confirm strong momentum
When (High + Low / 2) price is greater than Alligator’s Lips, Teeth, and Jaws, it is considered as a good time to go long; however, to strengthen the idea, the up-momentum condition needs to be approved three times consecutively. (Three consecutive candle bars should remain above Lips, Teeth, and Jaws to trigger an alert signal and plot Up- momentum shape on the charts)
The same idea with down-momentum, but the condition (High + Low / 2) price should be less than Alligator’s Lips, Teeth, and Jaws.
There is an alert set-up, once strong momentum is spotted it will send an alert once per bar close. You can relax and run an errand when the alert is not triggered.
Happy Trading!
Liquidity RaidThe market always seeks liquidity. Liquidity rests above previous highs and below previous lows.
The script highlights the breach of a market structure high or low (W/D/4H/1H), and will alert you on the first fractal break in the opposite direction.
The idea is that the raid happens, and you are only alerted once a candle breaks a fractal and closes in the opposite direction.
When a signal is printed, it does not mean to enter immediately. It just means that there is a fractal break in the opposite direction, and that you will need to assess current price action and market structure for a potential trade on pullback.
You still need to take HTF directional bias, market structure, order blocks and imbalances into consideration.
The script is for trading on on smaller time frames (1/2/3/5m).
Fractal periods, lines and colours are all customizable

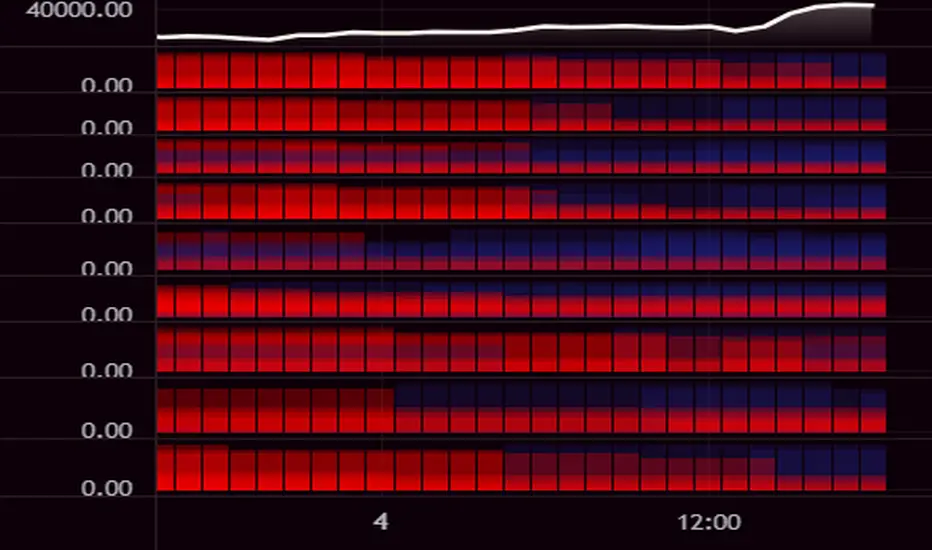
Williams Alligator Trend Filter HeatmapHello I've decided that the alligator lines can be used to find a trend. This script expands on that and checks 10 different multipliers to see trend over the long term and have 10 values. Those 10 values each give a color to one of the 10 lines in turn giving this Fire like plotting. I personaly use this to see if there is fear (red) in the markets or greed (blue), plotted 9 different crypto coins on the chart and have 4 columns in my setup to see the values on different timeframes. In the chart preview this is 1H,30M,10M,1M to see current environment. The colors use alot of data to generate especialy the bottom part, that colors based on a very long time zone.
Williams Alligator Trend FilterI've edited the normal Bill Williams Alligator indicator to have a color fill that indicates the trend. There is a percentage range filter which checks if the 2 outer lines are enough far away from eachother to indicate a trend. The indicator also checks if the lines are below or above eachother in the right order as a last check to confirm Trend

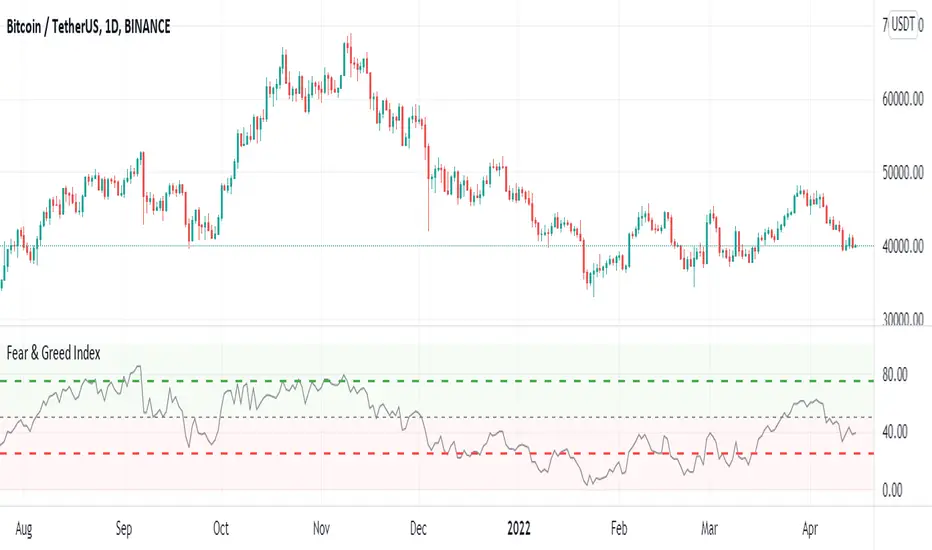
Crypto Fear & Greed IndexCrypto Fear & Greed Index
Crypto Fear & Greed Index is a metric to gauge sentiment levels in the crypto market.
The index starts from 0 to 100, with 0 meaning “Extreme Fear” (a potential bottom signal as investors are overly worried), and 100 meaning “Extreme Greed” (a potential top signal as investors are overly bullish).
Why Measure Fear and Greed?
In most markets, participants tend to be emotional with their behavior. Market participants often get overly greedy and FOMO when prices are on a euphoric rise, whilst they also tend to be overly fearful when prices are down and irrationally selling their positions at a loss.
Using the Crypto Fear and Greed Index
The Crypto Fear and Greed Index is commonly used to time entry into the market. As such, the Index is seen as less of an investment research tool and more of a market-timing tool. As stated by Warren Buffet, “Be fearful when others are greedy, and greedy when others are fearful.”
Calculation of the Crypto Fear and Greed Index
The Crypto Fear and Greed Index is based on three different factors – each factor is gauged from 0 to 100 and equally weighted to generate the index value.
The three factors are:
1. Stable coin flows
If there is a market sell-off and investors are expecting the value of their crypto investment to decline, they may rotate into stable coins as a safe haven.
As such, we look at the general trend of stable coins volume and activity to measure if the market is greedy or fearful.
2. Market Momentum
The performance of the top 18 coins relative to its 30-day average. A greater relative performance indicates greed and vice versa.
3. Top 18 Coins Price Strength
The number of coins of the top 18 coins hitting 90-days highs relative to those hitting 90-days lows. A greater number of coins hitting 90-days highs versus 90-days lows indicates greed and vice versa.
ADX+BB %B+AO+EMA Strategy [PineMyths] #2Indicator List
ADX (14,14)
Bollinger Bands %B (20,close,2)
Awesome Oscillator
EMA(5), EMA(21), EMA(50), EMA(200)
Strategy Rules and Conditions
LONG Side
EMA(5) > EMA(21)
EMA(50) > EMA(200)
BB %B > 0.75
ADX > 15
Awesome Oscillator > 2
SHORT Side
EMA(5) < EMA(21)
EMA(50) < EMA(200)
BB %B < 0.25
ADX > 15
Awesome Oscillator < -2
Stop: Fixed %2
Take Profit: Fixed %1

Up & Down Trend following trading strategy for BTC/USDT 3hThis strategy is based on multi time frame technical indicators such as;
1. RSI (10,50,100)
2. MFI (10,50,100)
3. RVI (10,50,100)
4. BOP (10,50,100)
5. Super Trend
6. SAR indicator
7. Higher highs and lower lows
8. SMA (9,500)
9. EMA (9,200)
After evaluating different parameters provided by those indicators, script is in a possition to determine optimul positions to enter in to market as well as exit from the market. In some cases stratergy will exit fully or partially depends on the situation. Other than that, this strategy is in a possition to calculate and specify the quantity you need to buy or sell depending on market situation. You can specify amount available for investment and how many times you are going to average (if downtrend). Parameters are optimised to BTC/USDT, 3h standerd candlestic chart.
goodluck

5min Williams Fractals scalping (3commas)Another strategy I'm learning Pine Script on. It is inspired by a MoneyZG youtube strategy called "Easy 5 Minute Scalping Strategy (Simple to Follow Scalping Trading Strategy)".
Again this is a one order per trade strategy compatible with the 3commas bot (works also with the free 3commas subscription). This strategy is based on the signals from Williams Fractals, taking the signals in reverse - red triangle indicates a bottom and hence we go long. The green triangle indicates a top so we go short. By default these signals are only accepted if they occur between the two Emas. However, you can also turn this off and when a WF signal comes in, only the current price has to be between the Emas. Stop loss is set to the current Ema slow and the take profit is a multiple of the distance to the slow ema.
Like previously I have added different filters as well as the ability to view essential things like the WF signal and Emas. I hope the script will help you to be more successful and if so it would be great if you could share here your setups, or tips on what would be good to refine to make it an even a more profitable strategy. Kind of a community approach so that we help each other out :).
Instructions for the 3commas connector:
1. First, you need to prepare 3commas Long/Short bots that will only listen to custom TV signals.
2. Inputs for the 3commas bot can be found at the end of the user inputs.
3. Once you have entered the required details into the inputs, turn on 3commas comments. They should appear on the chart (looks messy).
4. Now you can add the alert where you should paste the 3commas Webhook URL: 3commas.io
5. For the alert message text insert the placeholder {{strategy.order.comment}} and delete the rest.
6. Once the alert is saved, you can turn off those 3commas comments to have a clearer chart.
7. With a new alert, the bot and trade should launch.
In the near future I would like to publish more scripts that will carry similar elements as the first two, incl. compatibility with 3commas (I don't have access to another bot system). I will choose some strategies myself, but I will also be glad for some tips on what strategy would be good to do and is still missing here on Tradingview (short youtube videos or brief strategy manuals would be great).
Thanks and keep it up
PS: My screen values starting at Long Target Profit and ending at Pullback NOT greater than: 1.5; 1.5; 0; ON; 1; 2; OFF; 17; 36; ON; 0.05; ON; Chart; 14; 46; 50; 48.5; 51; OFF; 1; ON; 4; 2.

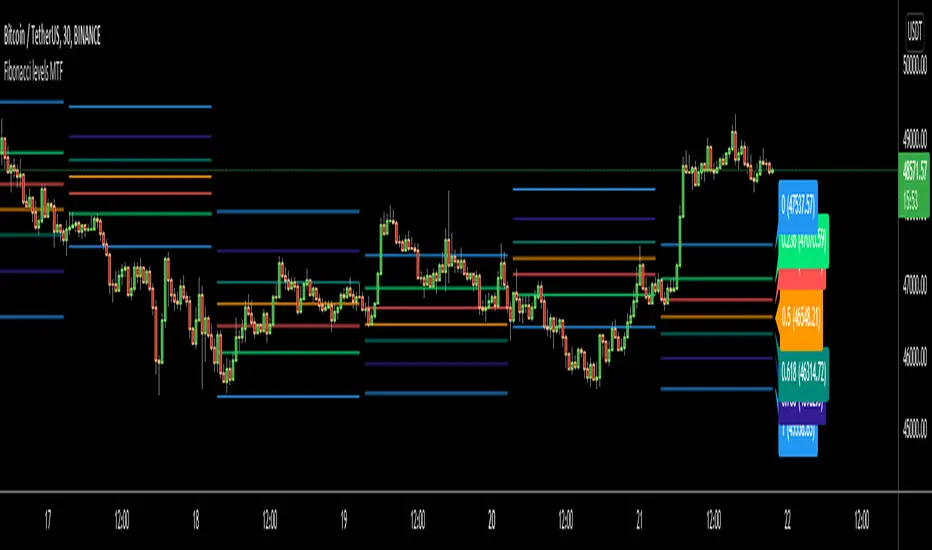
Fibonacci levels MTFHello All,
I got some requests for a script that shows Fibonacci Levels of Higher Time Frame Candles. so I made/published this script. I hope it would be useful for you.
Options:
You can set Higher Time Frame, by default it's 1 Day.
Optionally it can use Current or Last Candle of higher time frame to calculate/show its Fibonacci Levels.
It can show higher time frame candles at the background optionally. You can change its colors.
You can enable/disable/change each Fibonacci levels and their colors.
You can enable/disable Fibonacci Labels that is shown at the right ride and see only Fibonacci lines/levels
example, Fibonacci levels with higher time frame candles:
P.S. if you have ideas to improve this script, drop a comment under the script please
Enjoy!
[JL] How Many Signals last N barsGot this idea after I found Multiple Indicators Screener from QuantNomad.
This script learnt some codes from QuantNomad's great script. Thanks to him.
------------------------------------------------------------------------------------------------------------------------------------------------------------------------
This table show how many signals happened during the last N bars.
I only take care Forex, so this table only has 28 symbols. Feel free to change it.
Calculate the following signals:
RSI cross over/under 50
Short Moving average cross over/under long moving average
Stochastic k cross over/under d
MACD hist cross over/under 0
Williams Fractals: Up and Down fractals happened.
The concept is simple: Range period will always happen more cross signals than the trend period.
When the counter is less than median of all symbols, will be set green color. So more green mean more chance to be trend.

Smart Swing Strategy for StockSpecial indicator for stock but you can try another instrument.
Trend determination and buy/sell signals are using the Alligator system from Bill Williams .
To get maximum profit, the system uses the trailing stop technique using Average True Range (ATR) with 4 moving average options (RMA, SMA , EMA , WMA ).
Please leave comments if any opinions.
Disclaimer
The content is in any event provided with the intention of being for general circulation and availability only. As such it is not intended to and does not form part of any offer or recommendation directed at you specifically, or have any regard to your investment objectives, financial situation, or needs of yourself or any other specific person. Before committing to a trade or investment, please seek advice from financial or other professional advisers regarding the suitability of the trade for you. If you do not wish to seek such financial advice, please consider carefully whether the product is suitable for you as you alone remain responsible for your trading gains and losses.


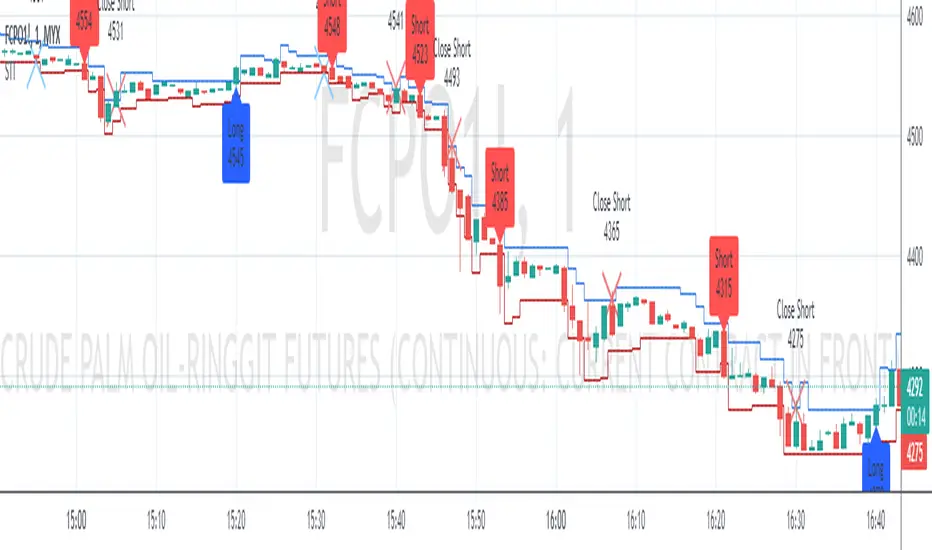
Swing Indicator (Tune for FCPO)Special indicator for FCPO (Crude Palm Oil Futures - Bursa Malaysia Derivative) traders but you can try another instrument.
Trend determination and buy/sell signals are using the Alligator system from Bill Williams.
To get maximum profit, the system uses the trailing stop technique using Average True Range (ATR) with 4 moving average options (RMA, SMA, EMA, WMA).
Please leave comments if any opinions.
Disclaimer
The content is in any event provided with the intention of being for general circulation and availability only. As such it is not intended to and does not form part of any offer or recommendation directed at you specifically, or have any regard to your investment objectives, financial situation, or needs of yourself or any other specific person. Before committing to a trade or investment, please seek advice from financial or other professional advisers regarding the suitability of the trade for you. If you do not wish to seek such financial advice, please consider carefully whether the product is suitable for you as you alone remain responsible for your trading gains and losses.
SMART4TRADER - Bill Williams Market Facilitation IndexThis indicator is written by 🔴 correct formula and for the correctness of the data is used by the Security function for the correct data request name from the open schedule, and not as usual with a similar ticker.
1️⃣ volume grows and MFI grows ➖ Green bar occurs when a growing volume and market dynamics. It signals us forward (down or up), that is, the number of transactions in the market is growing and they move the market in one specific side. Usually this bar is useless to enter the market, as the movement is already going, but it is very useful to determine the correctness of our entrance. In other words, if we are already in the market and see "green light" when a market hiking, for example, down, then we can be confident in the correctness of our entrance.
2️⃣ volume decreases and MFI decreases - Fuchsia (pink) ➖ "fading" bar appears in case of falling interest in the market in players, that is, the number of transactions (teak volume) decreases, and the market freezes (motion slows down). In trade, this bar is practically useless, although it often appears on the top of the first wave of Elliot.
3️⃣ volume decreases, and MFI grows - gray ➖ "fake" bar manifests when the activity of the market is growing with a decrease in volumes. This is an ambiguous bar and no sense from him. It is just necessary to understand that the market is moving, despite the decline in the activity of participants.
4️⃣ volume is growing, and MFI is reduced - blue ➖ "squatting" bar, perhaps the most interesting bar, since all movements end in a squatting bar, which may be, but not necessarily at the very bottom (vertex), and maybe near (one two bars). As stated in the book of Bill Williams, all the main trends end with the "squat" bar, which is among one of the three bars in the top or base.
--------------------------------
Этот индикатор написано по 🔴ПРАВИЛЬНОЙ ФОРМУЛЕ🔴 и для корректности данных используется функция SECURITY для правильного запроса данных имено с открытого графика, а не как обычно с похожего тикера.
1️⃣ Объем растет и MFI растет ➖ зеленый бар возникает при растущем объеме и динамике рынка. Он сигнализирует нам движение вперед (вниз или вверх), то есть количество сделок на рынке растет и они двигают рынок в одну определенную сторону. Обычно этот бар бесполезен для входа в рынок, так как движение уже идет, но он очень полезен для определения правильности нашего входа. Иными словами, если мы уже в рынке и видим «зеленый свет» при походе рынка, например, вниз, то мы можем быть уверенным в правильности нашего входа.
2️⃣ Объем снижается и MFI снижается – фуксия (розовый) ➖ «Увядающий» бар появляется в случае падения интереса к рынку у игроков, то есть количество сделок (тиковый объем) уменьшается, и рынок замирает (движение замедляется). В торговле этот бар практически бесполезен, хотя он часто появляется на вершине первой волны Эллиота.
3️⃣ Объем снижается, а MFI растет – серый ➖ «Фальшивый» бар проявляется, когда активность рынка растет при снижении объемов. Это неоднозначный бар и толку от него особо никакого нет. Просто надо понимать, что рынок движется, несмотря на снижение активности участников.
4️⃣ Объем растет, а MFI снижается – синий ➖ «Приседающий» бар, пожалуй, самый интересный бар, так как все движения заканчиваются приседающим баром, который может быть, но не обязательно в самом дне (вершине), а может быть рядом (один-два бара). Как говорится в книге Билла Вильямса, все основные тренды заканчиваются «приседающим» баром, который находится среди одного из трех баров в вершине или основании.

Fractal Breakout Strategy [KL]Fractal Breakout Strategy
This strategy will enter into a Long position when (a) bullish fractal is formed, combined with (b) ATR is relatively low. Trailing stop loss is set based on ATR.
Bullish fractal pattern :
A bullish fractal pattern looks like this:
It is formed when lower-low has reached a local minimum followed by higher-lows.
By default, this script plots the pivot point (the local minimum) using green crosses. This line will extend to the right until the next bullish fractal is formed. The local minimum pivot point is considered as key level of support. For long position entry, entry price must be higher or equal to it.
On the other hand, a bearish fractal pattern looks like the exact opposite. Reversing the logic, it is a local maximum indicated by higher-highs followed by lower-highs. This is shown by red crosses.
Why use ATR to confirm entry :
Two reasons to enter when ATR is low:
1) Since trailing stop loss is based on ATR, entering the market when ATR is low means risking less for potentially high reward.
2) Low ATR often signals price consolidation. There are two favorable scenarios, either: (i) period of accumulation, or (ii) bull flag, ideally followed by breakout.
Determining whether ATR is low :
Relative lows are quantified out by using the method in my other script: Modified ATR Indicator
The method involves applying two-tailed hypothesis testing to assess whether ATR (ie. by default lookback period of 5) has greatly deviated from a larger sample size (ie. lookback period of 50). Assuming ATR is normally distributed and variance is known, then test statistic (z) can be used to determine whether ATR5 is within the critical area under Null Hypothesis: ATR5 == ATR50. If z falls below/above the left/right critical values (ie. 1.645 for a 90% confidence interval), then ATR is determined to the relatively low/high respectively. For the purpose of assessing whether ATR is low, the left-tail is the main focus.
Profit taking :
Profits by default are taken over 3 levels based on risk to reward ratio (ie. 1R, 2R, 3R). When a target is met at each level, strategy will close out one third of current position size. Remainders (ie. already taken once at 1R, but not yet reaching 2R or 3R) will eventually be closed at the trailing stop loss price.
