Godmode 4.0.0 [Oscillator]First off, a huge thank you to the following people:
LEGION:
LazyBear: www.tradingview.com
xSilas: www.tradingview.com
Ni6HTH4awK: www.tradingview.com
sco77m4r7and:
SNOW_CITY: www.tradingview.com
oh92: www.tradingview.com
alexgrover: www.tradingview.com
cI8DH: www.tradingview.com
DonovanWall: www.tradingview.com
Since I've been on TradingView I've become somewhat enthralled by Godmode and the collective work that goes in to it, so I decided to publish my own iteration, building off the ideas already present. (This is a great way to get familiar with Pine by the way, just in case there are any beginners reading this)
Changes
The first change I made was to allow the user to select whatever tickerid they wanted as a benchmark. If trading XBTUSD on BitMEX for example, the indicator will react to exchange-specific activity, which means it will respond to all the little whipsaws, whipsaws that can be especially present on a futures exchange. By typing CRYPTOCAP:BTC or CRYPTOCAP:TOTAL we endeavor to remove noise. It can also signal earlier. Less noise and less lag. Another idea would be to choose a benchmark that has a strong inverse relationship with the asset you're trading: try CRYPTOCAP:USDT as the benchmark against BTC to see what I mean.
I also added the ability to smooth the plot, yet again removing noise but adding considerable lag.
The linear regression of the wave-trend is calculated in place of the EMA. This is plotted as columns with the midline (50) as the base. This is just calculating the slope of the wave-trend and can signal a weakening trend before a reversal takes place.
Using cI8DH's True RSI script () as inspiration, I added a function for calculating the True TSI in an attempt to remove any bullish bias. Funnily enough, when I tried to do the same with the RSI I had some problems. I'll try to resolve this in the coming weeks.
Made slight changes to the aesthetics. Tried to bring the two main plots alive by making their bold, opaque colors stand off the subtle tones in the background.
To Do List
1. I would like to sort out the issue with the True RSI.
2. When the plots are smoothed, there's an issue with the green 'Caution!' dots appearing in the lower half of the indicator.
3. I'd like to adjust the code so that if the 'Benchmark' box is empty, that it will automatically register the current tickerid as the 'Benchmark'.
If anyone has any suggestions on other fixes or how to apply the fixes mentioned by me, please don't hesitate to reach out to me here or through other media platforms.
Want to Learn?
If you'd like the opportunity to learn Pine but you have difficulty finding resources to guide you, take a look at this rudimentary list: docs.google.com
The list will be updated in the future as more people share the resources that have helped, or continue to help, them. Follow me on Twitter to keep up-to-date with the growing list of resources.
Suggestions or Questions?
Don't even kinda hesitate to forward them to me. My (metaphorical) door is always open.
BITMEX:XBTUSD
CRYPTOCAP:BTC
CRYPTOCAP:TOTAL
CRYPTOCAP:USDT.D
Bill Williams Indicators

SampleInvitePublish - V1
This strategy is designed for trading stocks and crypto currencies on the long side.
It uses three different timeframes to determine the most profitable entry prices (Day, 4 hour and chart interval).
The strategy employs ten different setups to accommodate both range trading and trend following markets.
The system contains sophisticated algorithms that scale to varies chart intervals.
Tailored to perform best between 4 hours to as low as 10 minutes.
The entire system consists of three tools: HullbusterScope, HullbusterBacktest and HullbusterSignal.
Hullbuster scope is used to obtain configuration information about the market instrument which will be applied to the HullbusterBacktest.
Commit an iterative approach to the backtest tool until the simulated results match your entry and exit expectations .
Apply the HullbusterSignal to the chart and use the same backtest configuration to setup actual trading alerts.

Swing PointsThis indicator gives a clear indication of price action swing-points as well as an indication of whether it is a higher, lower, or equal swing point relative to the last high/low.

Short Selling BITMEX Alts (15min scalp strategy)So this is a strategy i made for trading BITMEX alts on 15minute timeframe.
Works simply. You get sell signal when it is considered overbought and way too far from its mean -> the moving average. So you short it with that moving average as the target. Sometimes it goes lower, since the sell signal represents resistance area and average represents support and they act accordingly. Might break through, might bounce back to entry. So its safer to exit at support then pray on breakdown, its 15min strategy afterall.
There is no defined stop loss on this strategy. When i trade it i take risk/reward setup and my stop is calculated based on reward from entry to target. Usually its 1R or above that,usually i use price action for that purpose. if you trade it manually you have advantage, since signal gets confirmed on candle close, yet it could appear as soon as candle opens. So if you dont want any additional risks - wait for candle close and short it. If you want to gamble it - enter and average it up as it goes until you meet your risk limit.
Here is how it is inteded to be traded.
This strategy does not account for limit fees on bitmex, so it wouldnt be much practical to entry AND exit with market orders. As you can see in example, simple 1.5% move would lose 1/3 of its reward if you used market entry+exit.
This one works on :
TRX
EOS
LTC
BCH
ADA
All 15 minute timeframes. Plus it showes really good results in spot exachnges too, if you want to use as a tool to exit spot exposure (binance chart, same symbols).
Contact for free trial here or at twitter.com (i post full perfomance on all pairs there)
Also check this strategies performance on BCHH contract on bitmex. Absolute banger.

Oscillator Strategy for Scalping (BITMEX Swaps btc + eth)This is short selling strategy for BITMEX's XBTUSD and ETHUSD swaps scalping.
Made specifically for 3M XBTUSD and 3M-5M ETHUSD timeframe trading.
Not gonna open all the details, but it works mostly on bear divergences and moving averages.
On premium it shows 10000 bars back on 3minute timeframe and over that period(3 weeks aprox) XBTUSD had 28 trades and ETHUSD had 25(+17 on 5M timeframe) trades with that strategy.
How to trade it and setups that i use for manual trading:
1: You can use it to confirm your bias. Sell signal appears + price tries to retake previous resistance = most likely it will fail.
2. Sell signal after wick up suggests that you are likely to get filled at the top.
Your main target should be this moving average. Basically sell signal appears at resistance/near one and moving average represents current line of support. So when you enter short you should be eyeing this MA as your exit/target. Yes, there is a good possibility that support wount hold and this is a bear market we talking about BUT it is 3M bot oriented trading strategy, dont forget about and dont hold for too long to find yourself with price lending on MA and jumping from it.
This strategy does not have a defined stop, rather it suggests you to calculate it based on entry (provided) and target (provided).
Here is what i usually do to calculate my risks. My reward is a move to line of support, my stop is usually 1R, winrate is much higher than 50% so i feel good about it. Entry either at sell signal or at wick. Wicks not always get runned, but they provide incredible r/r setups.
Free trial for 36 hours for this one.

Oscillator Based Scalping (Forex Majors)This is a scalping strategy based on oscillator divergences.
Tested on ForexICE market data.
Signal might appear and disappear during candle making since it is based on Moving Average and therefore acts on close, but since candle closed signal is final and does not repaint.
1M timeframes is recommended for bot trading. 5M-15M is more suitable for manual trading.
Full list of tested intraday timeframes below:
EUR-USD - 1M-5M-15M
USD-JPY - 1M-5M
GBP-USD - 1M
AUD-USD - 1M-5M-15M
USD-CHF - 1M-15M
NZD-USD - 1M-5M-15M
USD-CAD - 1M-5M
There is 2 more similar trading strategies that im finishing now, 1 for BITMEX ETHUSD and XBTUSD contracts, and 1 for bitmex alts. Should be ready in a day or two.
Additional notes on executing trades:
-Trade should be entered as close to sell signal as possible. You can enter at market at red circle candle or at limit at top of sell signal candle. In both cases your target is red Moving Average and entering at market just makes overall R/R for a trade is lower yet limit order might not always get filled.
-This strategy doesnt have a defined stop loss by itself, but your target is a moving average and 1-1 risk reward should be enough. Although the win rate is much higher than 50% so you can be less greedy if you feel like playing it safer.
-Strategy itself uses pyramiding, so i would recommend averaging up if you get 2-3 consecutive sell signals above moving average.
-It is assumed that you have OANDA spread rates or better.
-- Free trial for 24 hours. Contact me here or at twitter.com --

Traderset Uni Renko - Awesome OscillatorThis is simply Bill Williams AO oscillator, fabricated with predefined numbers to better fit the Uni Renko charts and my methodology. The reason for publishing this version is that the original numbers (you can see them on the top instance of the oscillator) does not behave that much satisfactory when it comes to renko charting in my methodology !
The AO is not a part of my methodology nor Alligator, but i know some people who would like to have these two tools in renko charts. Here you have it.

SetMax Positions-BBAO3dirty coding right now so be patient and wait for updates and upgrades
cheers.

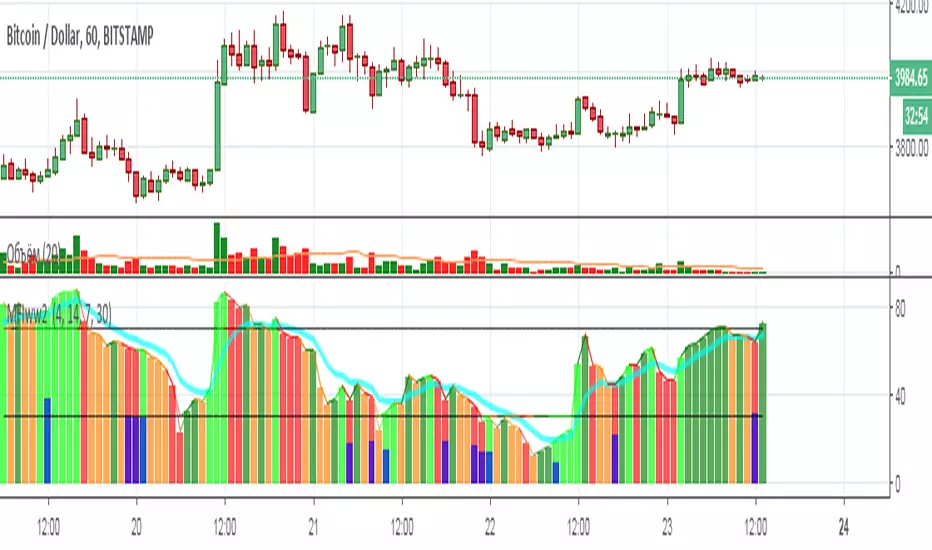
MFIww MFI/RSI_v2[wozdux]A new version of the indicator Mfi_v2. Added new control parameters.
tt - the averaging period of the volume.
Len - the period for calculating the MPI.
nn-averaging period MFI (blue line). level-critical levels from below and above (black horizontal lines).
Level 0 or 50 - switch between different histogram views with the middle at either level 50 or level 0.
key level-key to remove black critical levels.
key ema (MFI, nn) - key to remove mfi averaging (blue line).
key color-key to remove histogram coloring.
key colomns a-line - key switching modes represent the mfi histrogram or line.
---------------------------
Новая версия индикатора MFIww_v2. Добавлены новые управляющие параметры.
tt- период усреднения объема.
Len - период вычисления MFI.
nn- период усреднения MFI (голубая линия).
level- критические уровни снизу и сверху (черные горизонтальные линии).
Level 0 or 50 - переключение между разными представлениями гистрограммы с серединой либо на уровне 50 , либо на уровне 0.
key level- ключ убрать черные критические уровни.
key ema(mfi,nn) - ключ убрать усреднение mfi (голубая линия).
key color- ключ убрать расцветку гистрограммы.
key colomns-line - ключ переключения режимов представления mfi гистрограммой или линией.

pooya ATRthis is modified ATR for signal strength test
with custom ATR in multi time chart
comment your opinion...


TB!G-Scalp Strategy [Alert]Scalping Crypto Assets Made Easy
TB!G-Scalp is a TradingView based alert and accompanying strategy PineV3 Script.
Backtest vs Realtime
When designing the algorithms for this strategy our focus was primarily on ease of use.This results in a beautiful yet easy to use scalping strategy. As input it takes a chart period and only one extra parameter for fine tuning. The backtest results are an accurate representation of it’s real-time behaviour.
What makes it tick?
Over the last 2 years we collected a lot of market data regarding Bull and Bear behaviours. This previous market behaviour echo’s into the current market trend.
By recognising these echo’s we are able to anticipate an upcoming micro reversal which eventually end up being a scalping strategy.
Interested
Access is provided to a limited amount of people and for the duration that is determined by it’s Alpha Decay Rate.
This ADR is expected to become problematic after 2.3 year of usage on a lot of 150 users.

TB!G-Scalp Strategy [Backtest]Scalping Crypto Assets Made Easy
TB!G-Scalp is a TradingView based alert and accompanying strategy PineV3 Script.
Backtest vs Realtime
When designing the algorithms for this strategy our focus was primarily on ease of use.This results in a beautiful yet easy to use scalping strategy. As input it takes a chart period and only one extra parameter for fine tuning. The backtest results are an accurate representation of it’s real-time behaviour.
What makes it tick?
Over the last 2 years we collected a lot of market data regarding Bull and Bear behaviours. This previous market behaviour echo’s into the current market trend.
By recognising these echo’s we are able to anticipate an upcoming micro reversal which eventually end up being a scalping strategy.
Interested
Access is provided to a limited amount of people and for the duration that is determined by it’s Alpha Decay Rate.
This ADR is expected to become problematic after 2.3 year of usage on a lot of 150 users.

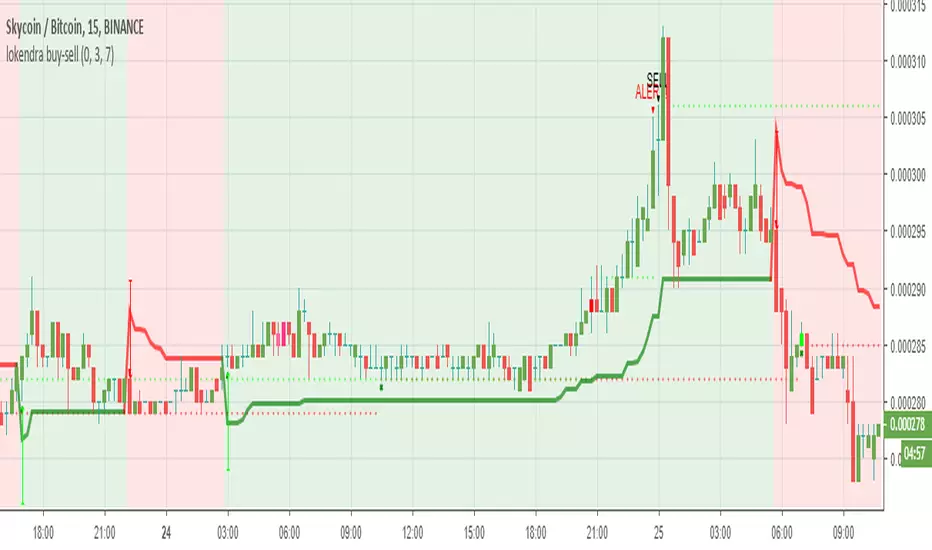
lokendra buy-sellbuy sell prediction with trend and sequence to be used with EMA (9,18) for better decision taking and accuracy
Fractals V9 ModifiedSo taking Ricardo Santos script for fractals V9 -I change the time function of the high TF fractal to non repainting one
adding daily fib levels
This hybrid seems to look nice . I have to admit that all credit to Ricardo Santos for his exelent script.
thi work it hybrid work and not so much original work....
The main improvment is the signals which are not reapinting as we remove security from that.
Security function exist for daily fib but it has nothing to do wih signal generation so i did not touch it

MFIww2 MFI/RSI [wozdux]Bill Williams indicator (MFI).
The indicator calculates the range of oscillations per unit volume. In fact, this indicator shows the tick volume or the readiness of the market to move the price.
The indicator is presented as vertical columns or as a line with levels.
Vertical columns are painted in different colors depending on the displacement of the indicator and the displacement of the volume. The indicator can increase or decrease (+-). The volume can also increase or decrease (+-). The combination of these factors generates four types of indicator columns.
++ lime
+- dark green
-+ red
-- orange
The red bar on Williams is a squat bar. This bar is important for market reversal indication.
-------------------------------
Индикатор Билла Вильямса (MFI).
Индикатор вычисляет диапазон колебаний на единицу объема. Фактически этот индикатор показывает тиковый объем или готовность рынка переместить цену.
Индикатор представлен в виде вертикальных колонок или в виде линии с уровнями.
Вертикальные колонки раскрашены в различные цвета в зависимости от смещения индикатора и смещения объема. Индикатор может увеличиваться или уменьшаться (+-). Объем также может увеличиваться или уменьшаться (+-). Сочетание этих факторо порождает четыре вида столбиков индикатора.
++ салатный
+- темно-зеленый
-+ красный
-- оранжевый
Красный столбик по Вильямсу есть приседающий бар. Этот бар важен для индикации разворота рынка.

Gator OscillatorThis indicator was originally developed by Bill M. Williams. It shows the degree of convergence / divergence of the Alligator lines.

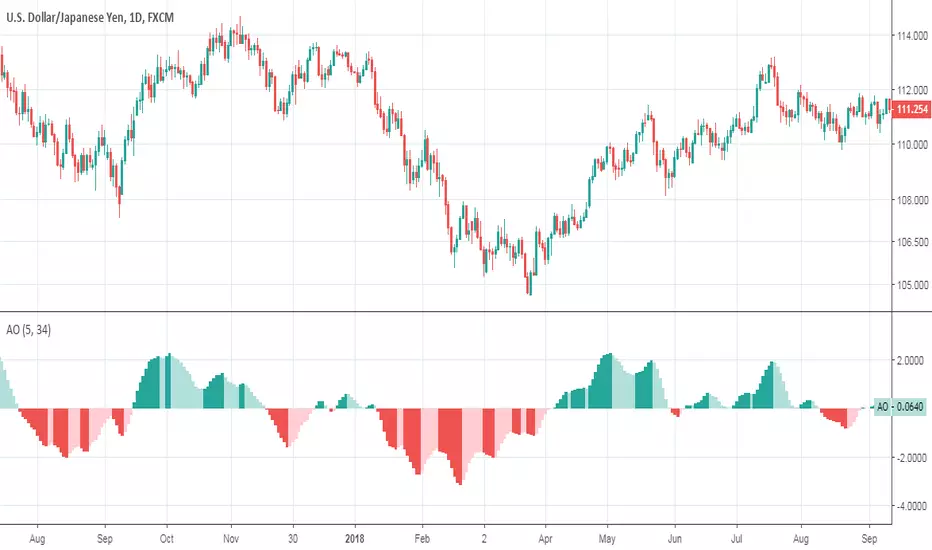
Accelerator OscillatorThis indicator was originally developed by Bill M. Williams. Also known as Acceleration/Deceleration Oscillator.

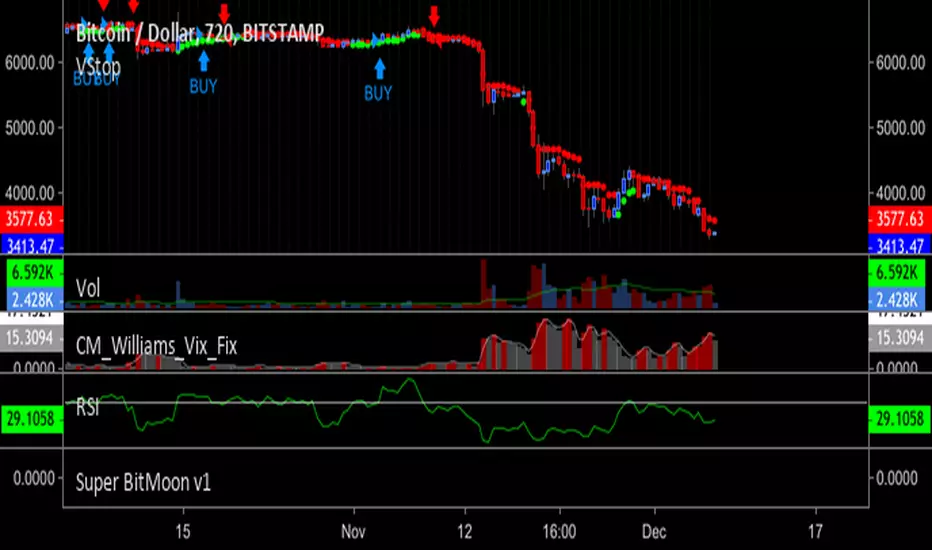
KHANDELWAL SYSTEMTHIS INDICATOR HAS CREATED SPECIALLY FOR ETF AND STOCK TRADING.
IT WORKS GREAT ON 5 MIN. TIME FRAME.
YOU NEED TO WAIT TILL YOU GET AND SIGNAL.
DOWN ARROW MEANS SELL AND VICE VERSA FOR BUY.
IF YOU SEE A STAR AND A SIGNAL ARROW ON SAME CANDLE THEN YOU WILL AVOID TO TAKE THIS SIGNAL.
IF A SIGNAL MADE BUT THERE IS A STAR ABOVE PREVIOUS CANDLE THEN YOU WILL AVOID THIS SIGNAL TOO.
USE THIS INDICATOR FOR EDUCATIONAL PURPOSE ONLY. IF YOU GET ANY LOSS BY USING THIS INDICATOR THEN I WILL NOT BE RESPONSIBLE FOR THAT.

Bitcoin - NVT and Velocity [NeoButane]Different Bitcoin studies that include more than price. Averaging types are arithmetic, geometric, logarithmic, and something that's supposed to be harmonic.
This has:
NVT Ratio
NVT Signal
Velocity
Sources:
NVT - medium.com
Velocity - charts.woobull.com